
Picasso: A free open-source visualizer for Convolutional Neural Networks:
https://medium.com/merantix/picasso-a-free-open-source-visualizer-for-cnns-d8ed3a35cfc5
#vizualization #deeplearning
https://medium.com/merantix/picasso-a-free-open-source-visualizer-for-cnns-d8ed3a35cfc5
#vizualization #deeplearning
Medium
Picasso: A free open-source visualizer for Convolutional Neural Networks
Cloudy with a chance of tanks
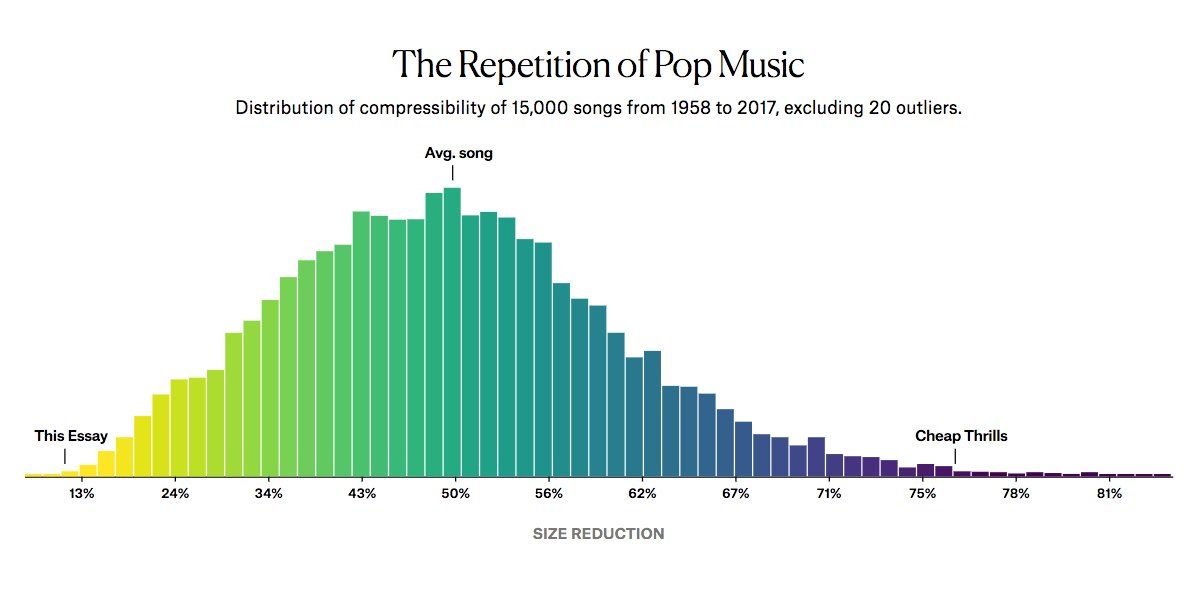
Are Pop Lyrics Getting More Repetitive?
Well-written article on pop music analysis. Is the repetitiveness in songs rising? Does it influence song popularity?
Article contains well-designed and illustrated research.
Link: https://pudding.cool/2017/05/song-repetition/
#popularDS #researh #statistics #vizualization
Well-written article on pop music analysis. Is the repetitiveness in songs rising? Does it influence song popularity?
Article contains well-designed and illustrated research.
Link: https://pudding.cool/2017/05/song-repetition/
#popularDS #researh #statistics #vizualization
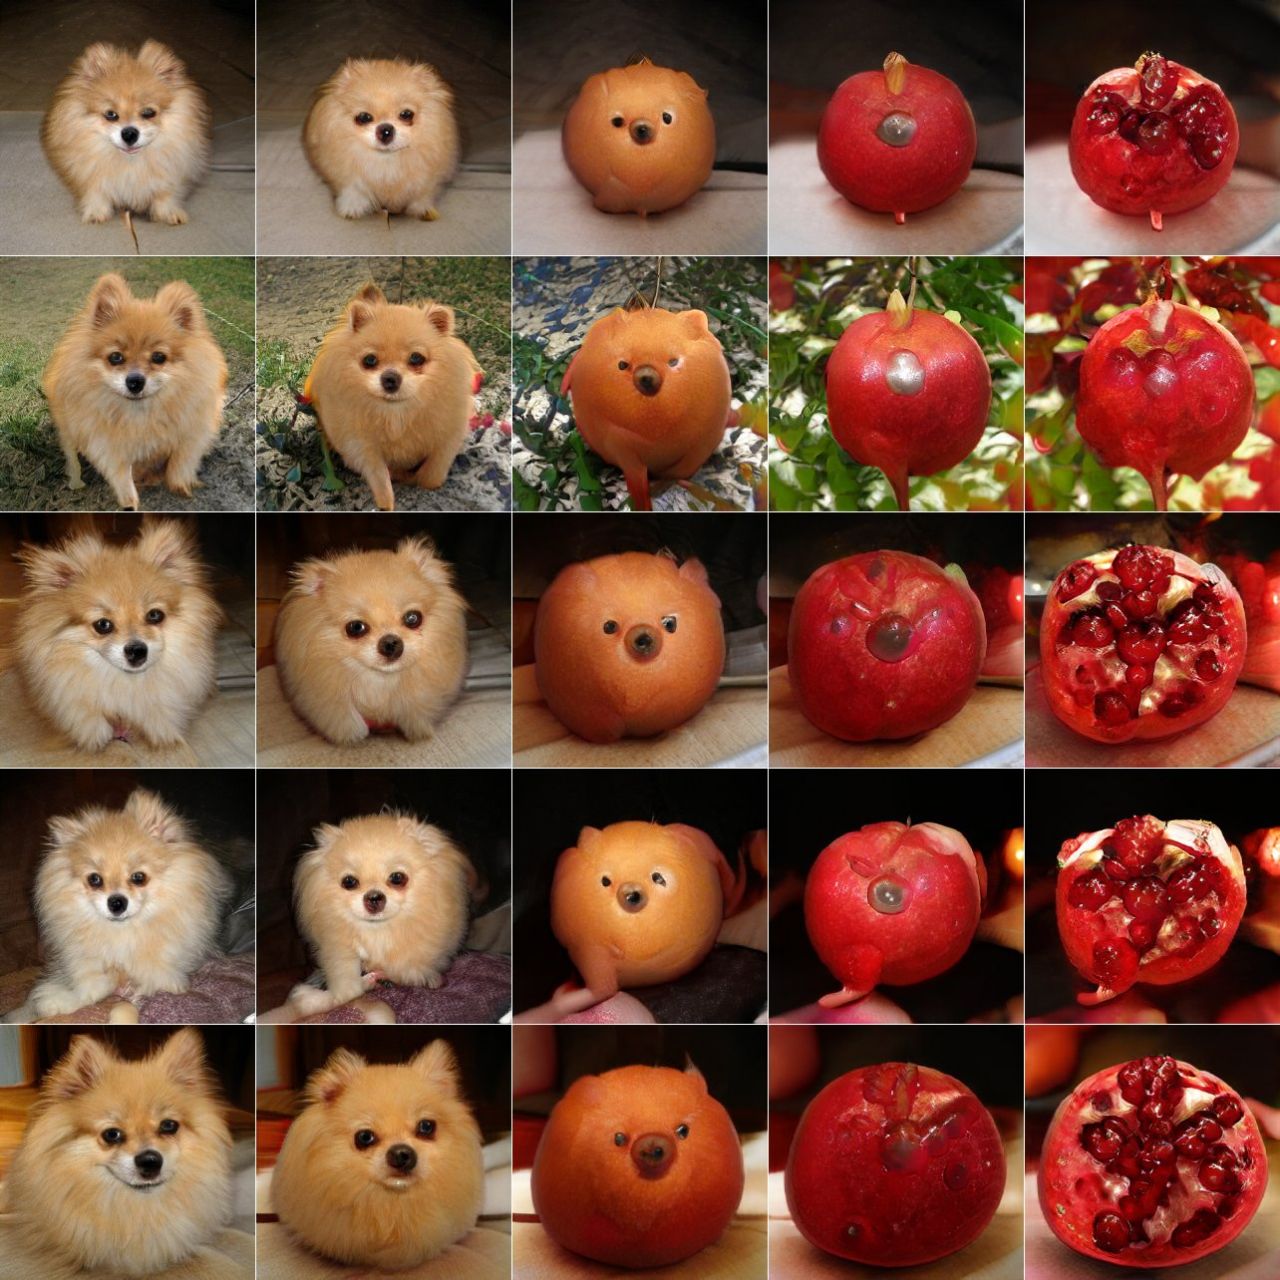
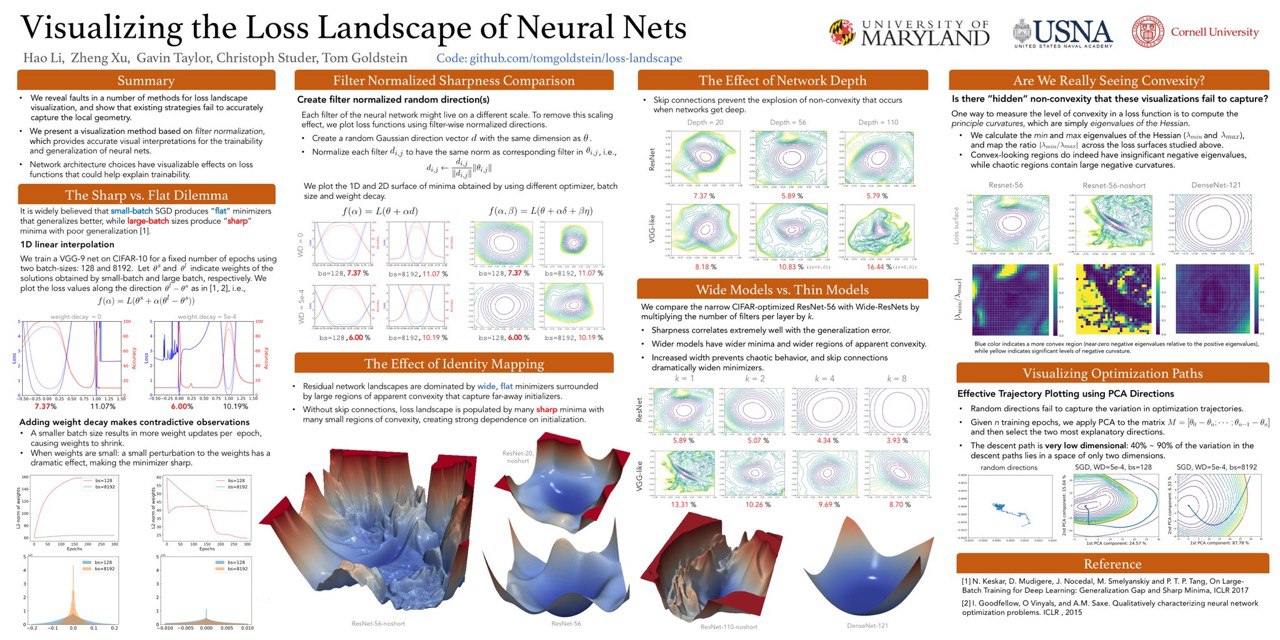
Visualizing the Loss Landscape of Neural Nets
Github: https://github.com/tomgoldstein/loss-landscape
#NN #loss #vizualization #DL
Github: https://github.com/tomgoldstein/loss-landscape
#NN #loss #vizualization #DL
Panel: A high-level app and dashboarding solution for the PyData ecosystem.
New framework for handling python dashboards.
Link: https://medium.com/@philipp.jfr/panel-announcement-2107c2b15f52
#vizualization #panel #metrics #dashboard #python
New framework for handling python dashboards.
Link: https://medium.com/@philipp.jfr/panel-announcement-2107c2b15f52
#vizualization #panel #metrics #dashboard #python
Medium
Panel
A high-level app and dashboarding solution for the PyData ecosystem.
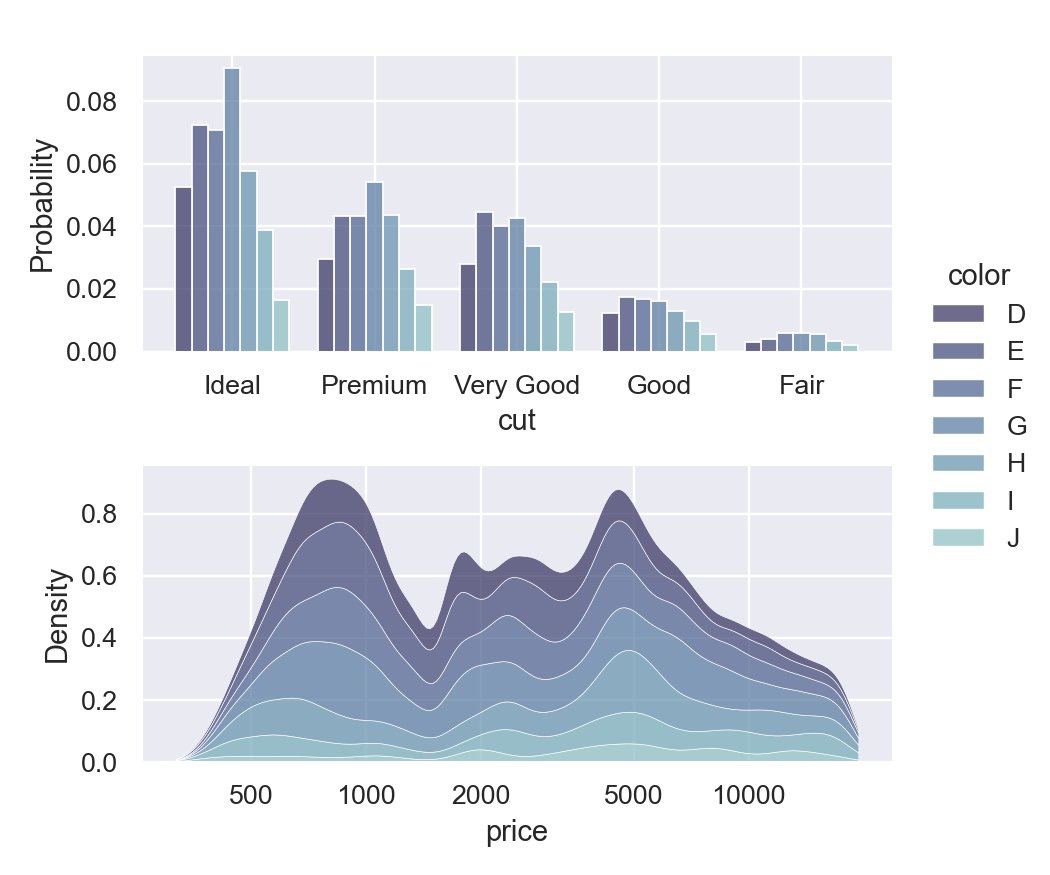
🔥New Seaborn vizaulization library release
- completely new and improved distributions module, with a modern API and many new features, like these histograms and kernel density plots
- support for empirical distribution plots, a better way to compare multiple distributions
- better overall handling of categorical, datetime, and log-scaled data
- new perceptually-uniform colormaps that are optimized for use in scatter or line plots
- an API update that requires keyword arguments in most places, laying the groundwork for smoother integration of planned future enhancements
Medium post: https://medium.com/@michaelwaskom/announcing-the-release-of-seaborn-0-11-3df0341af042
Whats new: https://seaborn.pydata.org/whatsnew.html
#vizualization #seaborn
Left picture is one generated by #Midjourney with a
Right one was generated with a
Looks like Midjourney is not aware of concept of distributions yet.
#AI #AGI #vizualization
bell curve with mu = 18 sigma = 4 request.Right one was generated with a
bell curve with mu = 18 sigma = 1 request.Looks like Midjourney is not aware of concept of distributions yet.
#AI #AGI #vizualization