
Статья об ElasticSearch в стиле "послание себе, когда начинал с ним работать".
В статье есть информация про индексы, шарды, потребление ресурсов и траблшутинг.
#observability #elk #elasticsearch
В статье есть информация про индексы, шарды, потребление ресурсов и траблшутинг.
#observability #elk #elasticsearch
Medium
Starter-kit for Elasticsearch operations
The post tries to answer questions: how to size ES nodes; how to troubleshoot it; where to find deep-dive posts about Elasticseach
A list of awesome Prometheus alerts, divided by the nature. I.e. there are alerts for data bases, proxies and load balancers, storage, etc.
You can just copy-paste these into your monitoring code. Just keep in mind that the thresholds may be different for your particular case!
#observability #monitoring #prometheus
You can just copy-paste these into your monitoring code. Just keep in mind that the thresholds may be different for your particular case!
#observability #monitoring #prometheus
Amazon Managed Service for Grafana now supports Grafana Enterprise upgrade, Grafana version 7.5, Open Distro for Elasticsearch integration, and AWS Billing reports
You can upgrade to Grafana Enterprise with 30 days trial to enable enterprise data sources.
Beginning April 16th, 2021, customers using AMG will receive a 90-day free trial for five free users per account, with additional usage charges.
AMG is currently available in the US East (N. Virginia) and Europe (Ireland) region.
#aws #observability
Amazon
Amazon Managed Service for Grafana now supports Grafana Enterprise upgrade, Grafana version 7.5, Open Distro for Elasticsearch…
Gatus is a health dashboard written in Go.
It has minimalistic configuration and allows you to set multiple conditions to label an endpoint as "healthy".
Also, you can host it on your own inside your private network. So, if you have security requirements of not to allow external health checkers into the perimeter, this could be a good way to go.
#toolz #observability
GitHub
GitHub - TwiN/gatus: ⛑ Automated developer-oriented status page
⛑ Automated developer-oriented status page. Contribute to TwiN/gatus development by creating an account on GitHub.
A small neat write up on learnings about incident responses
Key takeaways:
- Declare incidents on smaller things. Division between SEV1 and SEV3 incidents helps you to track system health better. As well a bunch of smaller problems may lead to a critical failure. Also, such problems are usually easy to fix one by one.
- Decrease the time between the incident and postmortem analysis. Analysis will be much more accurate, when you have a fresh memory of what has happened.
- Alert on symptoms, not causes. Alert only if your users (external or internal) have issues, not when CPU utilization is high
#observability
FireHydrant
Pragmatic Incident Response: 3 Lessons Learned from Failures
Lessons learned from the front line that you actually immediately use in your incident management process.
Recently, I asked my subscribers what topics are interesting to them and a few people mentioned observability.
That’s funny, ‘coz yesterday I accidentally bumped into a great series of articles on setting SLAs for your products by Alex Ewerlöf!
- Calculating composite SLA - truly outstanding read!
- Some practical advice when setting SLA - notice, it says SLA, not SLO. So, there are some business related tips in this article as well. However, the core is technical, ofc.
- Calculating the SLA of a system behind a CDN - I haven’t read this one yet. But given the quality of previous two, I expect this one be great as well!
tl;dr for the first article in the list:
I would personally also add that when you try to set a “full” SLO(A) for your service, that is also a composite SLO(A). You should treat it as a serial. For example, if you have 99.8% error rate SLO and 99.1% latency SLO, an “overall” SLO would be 0.998 0.991 100% = 98.9%
That’s not only good to know, but you may also want to write your marketing materials differently. There is a difference between:
> We guarantee 99.8% SLO on 5th error rate and 99.1% SLO on requests not taking longer than X milliseconds.
And
> We guarantee the 98.9% availability of our systems.
I’m not a marketing person, though. I don’t know what’s better. What I do know is that:”Nines doesn’t matter, if your users are unhappy”.
#observability #slo #sla
That’s funny, ‘coz yesterday I accidentally bumped into a great series of articles on setting SLAs for your products by Alex Ewerlöf!
- Calculating composite SLA - truly outstanding read!
- Some practical advice when setting SLA - notice, it says SLA, not SLO. So, there are some business related tips in this article as well. However, the core is technical, ofc.
- Calculating the SLA of a system behind a CDN - I haven’t read this one yet. But given the quality of previous two, I expect this one be great as well!
tl;dr for the first article in the list:
for serial, multiply availability; For parallels, multiply unavailability
I would personally also add that when you try to set a “full” SLO(A) for your service, that is also a composite SLO(A). You should treat it as a serial. For example, if you have 99.8% error rate SLO and 99.1% latency SLO, an “overall” SLO would be 0.998 0.991 100% = 98.9%
That’s not only good to know, but you may also want to write your marketing materials differently. There is a difference between:
> We guarantee 99.8% SLO on 5th error rate and 99.1% SLO on requests not taking longer than X milliseconds.
And
> We guarantee the 98.9% availability of our systems.
I’m not a marketing person, though. I don’t know what’s better. What I do know is that:”Nines doesn’t matter, if your users are unhappy”.
#observability #slo #sla
Medium
Calculating composite SLA
How to serial and parallel dependencies affect the total SLA
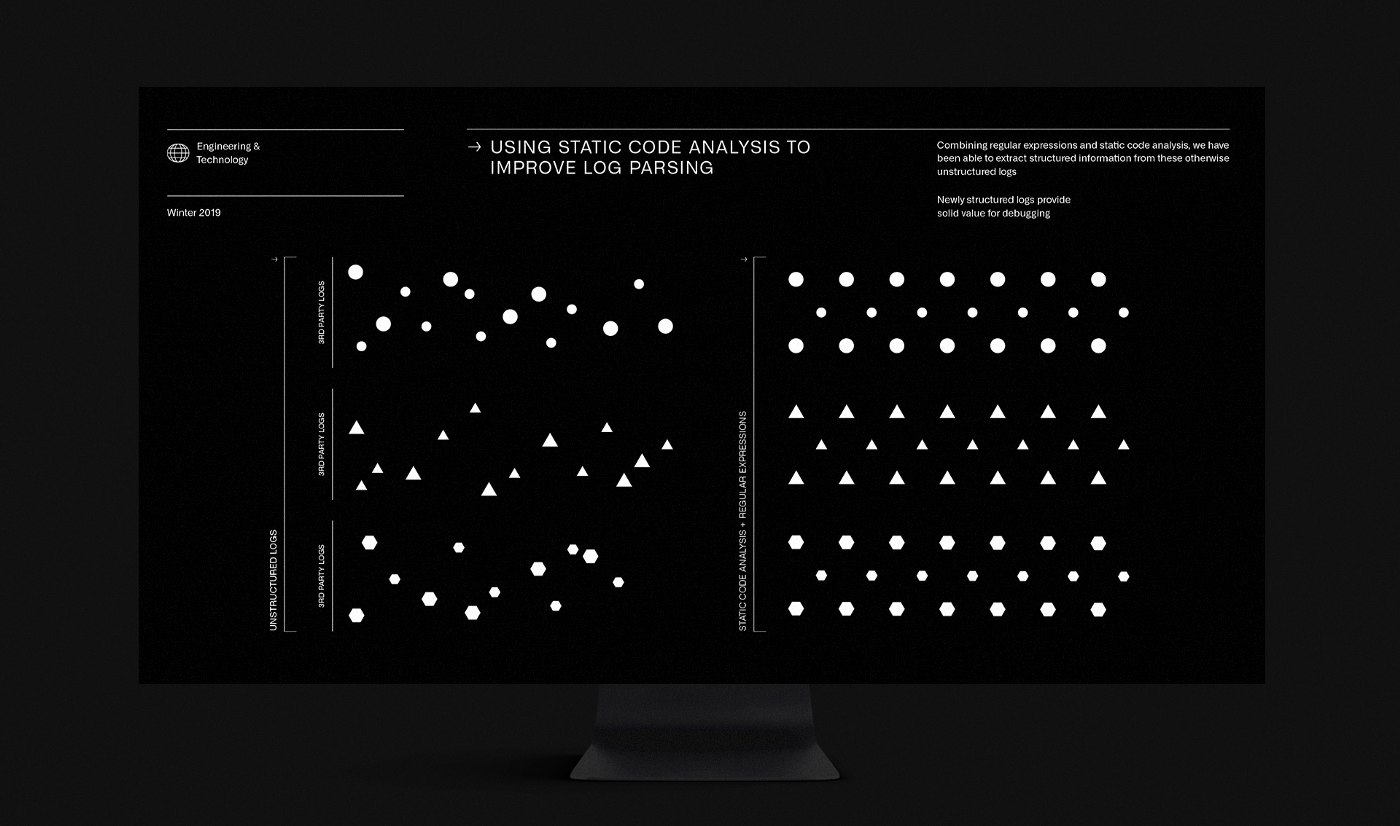
Logging is one of the three pillars of observability. One of the Palantir Blog posts outlines some pretty nice ideas that may help you to build a better observability solution.
Structured logging. Of course, all of us know that logs are easier to analyze if they are structured in commonly across applications. Palantir improved the way "message" field usually looks like:
{
You can read more about it in the blog post itself. I hope these ideas will help you to build a better observability system!
P.S. Thanks Valerii Tatarin for this post. If you'd like to share something with community too, feel free rich @MaxymVlasov or @grem1in.
#logging #observability
Structured logging. Of course, all of us know that logs are easier to analyze if they are structured in commonly across applications. Palantir improved the way "message" field usually looks like:
{
"message": "Processing event from user",te that these structured logs avoid a common logging practice of inserting parameters into the log message via string formatting, creating a variable message ("Proc
"params": {
"event": "foo",
"user": "bar"
},
"level": "DEBUG",
"logger": "com.logger.name",
"time": "2019-07-28T09:31:04.46165-07:00"
}
No
essing event foo from user bar"). Such an approach will prevent you from building complex log queries to filter out variable messages. Instead, you can search for an exact match and add additional filters by other fields (e.g. params.user == "bar")
Logs from 3rd party services. Usually, logs from 3rd-party components do not fit your unified logging structure. To overcome this, Palantir engineers built tooling that analyzes Golang source code and creates regular expressions which convert original messages to the ones with an expected structure.You can read more about it in the blog post itself. I hope these ideas will help you to build a better observability system!
P.S. Thanks Valerii Tatarin for this post. If you'd like to share something with community too, feel free rich @MaxymVlasov or @grem1in.
#logging #observability
An interesting comparison between Grafana Mimir and VictoriaMetrics by VictoriaMetrics team.
This article is particularly interesting, because they also describe the test setup. Therefore, one can try to re-produce the test results.
This benchmark was inspired by the original report from Grafana, when they have scaled Mimir to 1 billion active series
#observability #victoriametrics #grafana #mimir
VictoriaMetrics
Grafana Mimir and VictoriaMetrics: performance tests
Benchmarking VictoriaMetrics and Grafana Mimir on the same hardware
Here the FireHydrant company writes that MTTR (mean time to recovery) metric is overrated.
I tend to agree with their justification: not all incidents are the same. Not all systems are equally critical as well as not always the cause or rather a set of causes is easy to mitigate.
However, it’s still important to measure the quality of your incident response somehow. The propose two metrics instead:
- Mean time to detection - basically, how long it takes for you to spot a problem. I would also ask an additional question here: was a problem reported by your observability systems, or by your colleagues or customers?
- Mean time to retrospective - or mean time to postmortem if you wish. I think this is a good one. It’s true that some details may fade away from memory, so sooner you do a retrospective - the better! Also, it’s f you actually measure this time, it can help you to prioritize meetings and put postmortems as a higher priority comparing to, for example, a team standup.
#observability
FireHydrant
The MTTR that matters
A metric you should be tracking is Mean Time to Retrospective.
An “Awesome SLOs” list.
Books, articles, videos, and more.
Also, it’s open source, so feel free to contribute!
#slo #observability
Books, articles, videos, and more.
Also, it’s open source, so feel free to contribute!
#slo #observability
GitHub
GitHub - stevexuereb/awesome-slo: Curated list of resources on SLOs
Curated list of resources on SLOs. Contribute to stevexuereb/awesome-slo development by creating an account on GitHub.
Fluent Bit 2.0.0 with support for traces is released!
It means that now Fluent Bit fully integrates with systems like Prometheus and OpenTelemetry natively.
#observability
It means that now Fluent Bit fully integrates with systems like Prometheus and OpenTelemetry natively.
#observability
GitHub
Release Fluent Bit 2.0.0 · fluent/fluent-bit
News
Fluent Bit v2.0.0 is the stable release!, new changes on this version:
Logs, Metrics, and Traces
Fluent Bit has always been agnostic of the data that its processes and moves around; one of the...
Fluent Bit v2.0.0 is the stable release!, new changes on this version:
Logs, Metrics, and Traces
Fluent Bit has always been agnostic of the data that its processes and moves around; one of the...
A new episode of our voice chat is here (in Ukrainian)!
This time we talked a little bit about observability and deploy of AWS Lambdas. You can find it on:
- YouTube
- Spotify
- Apple Podcasts
- Google Podcasts
Enjoy!
Also, I used AI-based voice enhancement by Adobe in this episode. So, let me know if it's better this way in the chat. Also, if you want to participate in the upcoming voice chats, do not hesitate to join! We usually do those each other Thursday at 20:00 Kyiv time. The next one will probably be next week.
P.S. If you want even more than that, DOU is currently looking for hosts for their own DevOps-themed podcast! If you want to be one, make sure to fill out that form!
#voice_chat #говорилка #observability #serverless
YouTube
Observability & AWS Lambda
Цього разу встигли зачепити дві теми:
- Observability
- Деплой AWS Lambda за допомогою Terraform і не тільки
Посилання на матеріали, що ми згадуємо в цьому епізоді:
- Practical introduction to OpenTelemetry tracing - talk by Nicolas Frankel at FOSDEM…
- Observability
- Деплой AWS Lambda за допомогою Terraform і не тільки
Посилання на матеріали, що ми згадуємо в цьому епізоді:
- Practical introduction to OpenTelemetry tracing - talk by Nicolas Frankel at FOSDEM…
VictoriaMetrics have released their first iteration of the log platform!
Here’s the info:
The first release of VictoriaLogs!
Release page on GitHub
Documentation
Docker demos
Helm Chart
Here you can find a Benchmark for VictoriaLogs
Since I’m not a user, it’s hard for me to provide feedback right away. Yet, if you use it or want to try and want to provide any feedback to the maintainers, do not hesitate to submit bug reports and feature requests on GitHub.
#victoriametrics #logs #observability
GitHub
Release v0.1.0-victorialogs · VictoriaMetrics/VictoriaMetrics
This is VictoriaLogs Preview release
It provides the following key features:
VictoriaLogs can accept logs from popular log collectors. See these docs.
VictoriaLogs is much easier to setup and oper...
It provides the following key features:
VictoriaLogs can accept logs from popular log collectors. See these docs.
VictoriaLogs is much easier to setup and oper...
A brief overview of the modern Observability architectures, as well as some ideas on how to consolidate and optimize your Observability stack.
via Sysadmin Tools
#observability
via Sysadmin Tools
#observability
Kevinslin
The Architecture of Modern Observability Platforms
An observability platform is an end-to-end system that helps organizations understand the health of their applications and services. This understanding comes from the three pillars of modern observability: metrics (time series data), logs (text-based data)…
Yet another observability post: Datadog Alternative: When to Move Out? .
This article describes a fairly simple experiment: what would it cost to run Datadog compared to Prometheus & Thanos on different scales.
Although, the scope of the experiment was somewhat limited (no logs, no APM), it provides some numbers that you can use while evaluating different observability solutions.
The bottom line is: with the growth of your technological footprint, Datadog price grows faster compared to the Prometheus stack. Which is true for any SaaS solution compared to self-hosted, I believe.
However, another important considerations is that free software is not "free". You cannot just replace a vendor with an open-source tool and call it a day. You require engineering time to support and maintain those platforms. Therefore, on a smaller scale it might much more effective to use SaaS (especially, if you don't have experts in a given domain in your company yet).
#observability
InfraCloud
Datadog Alternative: When to Move Out?
In this blog post, we compared the cost of setting/maintaining OSS Prometheus and Datadog SaaS to find which option provides better TCO for the organization.
A new episode of our voice chat (in Ukrainian) is here!
This time we spoke about observability: what vendors and solutions do people use as well as what problems they have encountered. We also briefly touched topics of SLI/SLO/SLA and synthetic monitoring in this episode.
The episode is available on:
- YouTube
- Substack
- Spotify
- Apple Podcasts
- Google Podcasts
Enjoy!
#voice #observability
YouTube
Говорилка CatOps: Observability
Важливо! Триває збір моєї дружини на 18 укомплектованих аптечок для 27 батальйону 67 бригади, що виконує бойові завдання на сході.
Монобанка: https://send.monobank.ua/jar/5zCptYx1sb
Номер картки: 5375 4112 0823 3556
Ціль: 150 000 UAH (~3700 EUR)
------…
Монобанка: https://send.monobank.ua/jar/5zCptYx1sb
Номер картки: 5375 4112 0823 3556
Ціль: 150 000 UAH (~3700 EUR)
------…
Kubernetes: tracing requests with AWS X-Ray, and Grafana data source is a step-by-step guide on how to setup tracing in your EKS cluster using AWS X-Ray by Arseniy Zinchenko - a member of the Ukrainian DevOps community.
Also, make sure to subscribe to his Substack! He posts new things quite often and I have no idea where does he find time and willpower to do so 😅
#aws #kubernetes #observability
Also, make sure to subscribe to his Substack! He posts new things quite often and I have no idea where does he find time and willpower to do so 😅
#aws #kubernetes #observability
RTFM! DevOps[at]UA
Kubernetes: tracing requests with AWS X-Ray, and Grafana data source
Launching AWS X-Ray on AWS Elastic Kubernetes Service, creating a Python Flask with the AWS X-Ray SDK, and connecting a Grafana data source for X-Ray
People often say that Observability is a Data problem. Although, it sounds correct intuitively, I cannot say that I fully understood how Data engineering approaches could be applied to the Observability systems.
This article about Wide Events clarified things for me a bit. Indeed, if any event that happened in the system is just an object with some value and useful metadata, things like metrics, logs, and traces become less relevant - it's all events now!
Apparently, this is how Observability is done in Meta, according to the author, and apparently people in Meta like it. I never worked for Meta, I don't know what they really use there and if it's better than the tools available to us mere mortals.
However, this is an interesting concept, and it would be wonderful to see similar projects that are not internal to the Big Tech companies.
#observability
A Song Of Bugs And Patches
All you need is Wide Events, not “Metrics, Logs and Traces”
This quote from Charity Majors is probably the best summary of the current state of observability in the tech industry - a total, mass confusion. Everyone is confused. What is a trace? What is a span? Is log line a span? Do I need traces if I have logs? Why…
I had a whole talk about testing of the Helm charts, but it's not the only (almost) YAML that you could test!
This blog post describes how one could test their Prometheus alerts. Which is more productive than waiting till something happens.
#observability#testing
This blog post describes how one could test their Prometheus alerts. Which is more productive than waiting till something happens.
#observability#testing
Aviator Blog - Automate tedious developer workflows
A Guide to Unit Testing Prometheus Alerts - Aviator Blog
Although Prometheus alerts are widely used alerting system, unit testing these alerts is uncommon. Learn about best practices of testing these alerts.
A case study from Grammarly on their migration from Graphite to VictoriaMetrics, which helped them to improve DevEx as well as save money.
Unfortunately, there are not many technical details in this article, but I still want to share it, ‘coz I’ve rarely seen posts about VictoriaMetrics in production. So, maybe you are the one who can write something on the matter?
P.S. Do you, folks, even remember Graphite?
#observability
Unfortunately, there are not many technical details in this article, but I still want to share it, ‘coz I’ve rarely seen posts about VictoriaMetrics in production. So, maybe you are the one who can write something on the matter?
P.S. Do you, folks, even remember Graphite?
#observability
grammarly blog
Better, Faster, Cheaper: How Grammarly Improved Monitoring by Over 10x with VictoriaMetrics
By late 2019 it was clear we had outgrown our existing monitoring and observability system. It was time to shop around for a new solution…