
Вышла Grafana 4.6
В числе изменений:
- новый Postgre датасорс
- аннотации. Можно оставлять комментарии к фрагментам графика
- алерты по Cloudwatch метрикам 🎉
- улучшили запросы в Prometheus
Ссылка на полный чейнджлог
Скачать версию 4.6 можно тут
#monitoring #grafana
В числе изменений:
- новый Postgre датасорс
- аннотации. Можно оставлять комментарии к фрагментам графика
- алерты по Cloudwatch метрикам 🎉
- улучшили запросы в Prometheus
Ссылка на полный чейнджлог
Скачать версию 4.6 можно тут
#monitoring #grafana
Grafana Labs
Grafana 4.6 Released
Release Highlights The Grafana 4.6 release contains some exciting and much anticipated new additions:
The new Postgres Data Source Create your own Annotations for the Graph panel Cloudwatch Alerting Support Prometheus query editor enhancements This is a…
The new Postgres Data Source Create your own Annotations for the Graph panel Cloudwatch Alerting Support Prometheus query editor enhancements This is a…
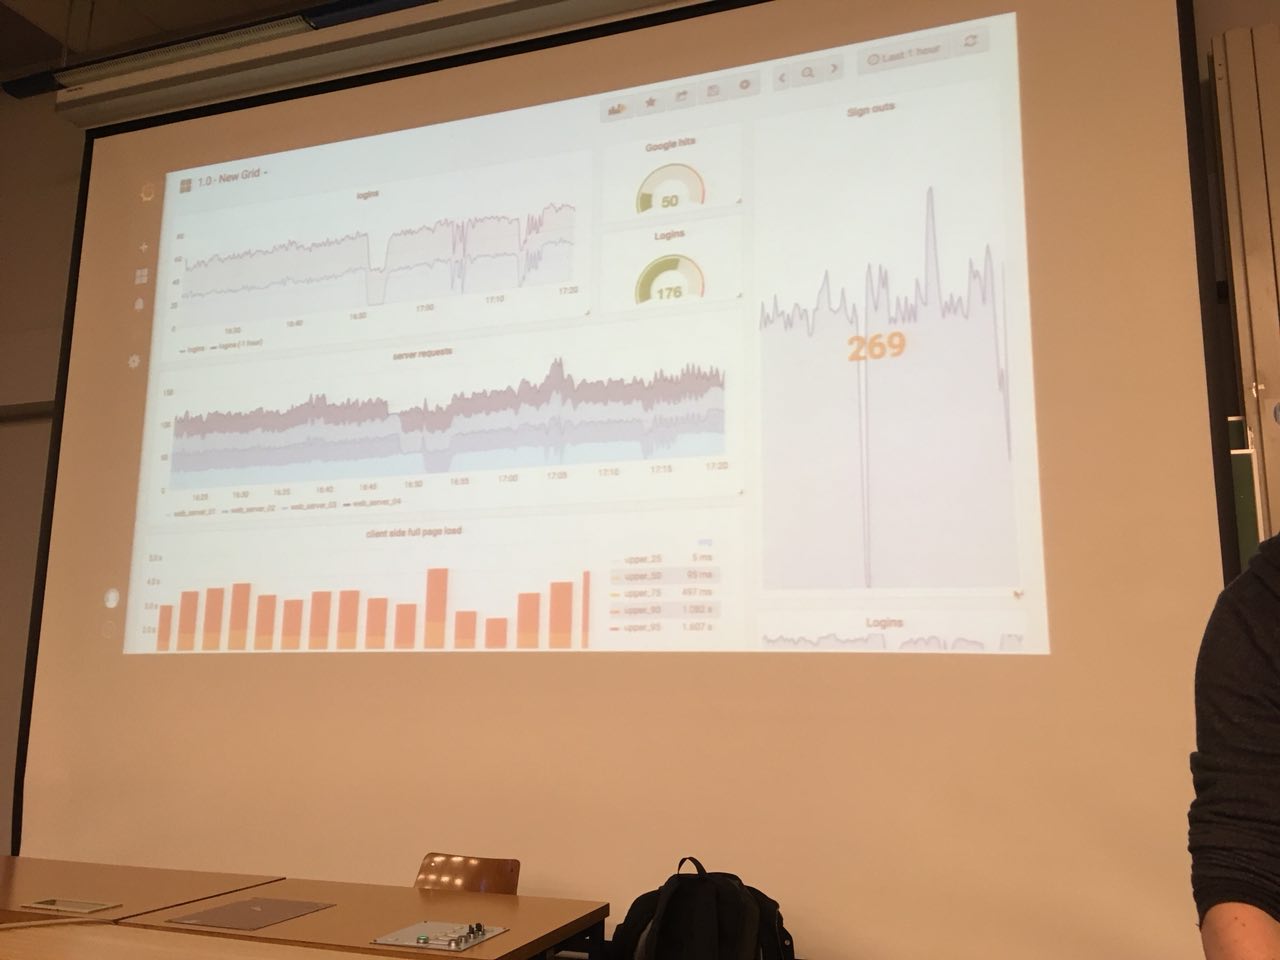
В Grafana v5 панели получили независимые layouts. Никаких больше rows. Захотели здоровую вертикальную панель -- сделали!
А ещё директории для дашбордов. На каждую директорию можно нарезать отдельно права!
#Grafana #monitoring
А ещё директории для дашбордов. На каждую директорию можно нарезать отдельно права!
#Grafana #monitoring
So cool monitoring solution in Grafana for Prom users, but we still using Zabbix ¯\_(ツ)_/¯
https://grafana.com/blog/2018/09/21/grafanas-explore-ui-taking-a-deeper-dive-into-data-with-prometheus-queries/
#monitoring #grafana #prometheus
https://grafana.com/blog/2018/09/21/grafanas-explore-ui-taking-a-deeper-dive-into-data-with-prometheus-queries/
#monitoring #grafana #prometheus
Grafana Labs
Grafana’s Explore UI: Taking a Deeper Dive into Data with Prometheus Queries | Grafana Labs
Grafana Labs has created the Explore UI, which allows you to iterate quickly through Prometheus queries, while leaving your dashboards intact. This post will walk you through a demo and show you how to try it out yourself.
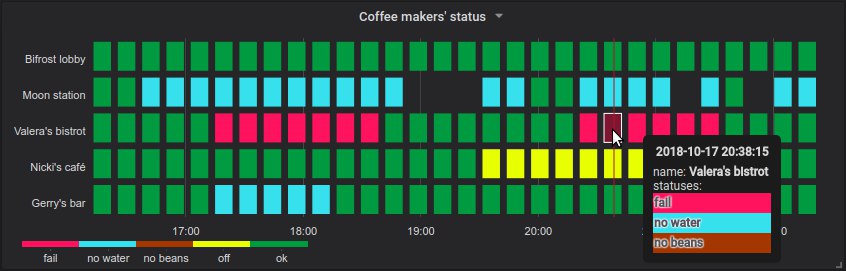
Cool grafana panel plugin to visualize status of multiple objects over time
https://github.com/flant/grafana-statusmap
Can be used as Status page or for investigation problems and their root case etc. Works with Prometheus and Grafana 5.
#monitoring #grafana #prometheus
https://github.com/flant/grafana-statusmap
Can be used as Status page or for investigation problems and their root case etc. Works with Prometheus and Grafana 5.
#monitoring #grafana #prometheus
Вчера зарелизили Grafana 6
Из нововведений:
- Explore: новый способ запросов, который позволяет делать запросы на лету для траблшутинга в реальном времени
- Grafana Loki: интеграция с Loki — который как Prometheus, но для логов
- Gauge Panel: отдельная панель для круговых показателей (gauges). Планируется цифровые показатели тоже привести к виду gauges
- New Panel Editor UX: новый редактор панелей
- Google Stackdriver Datasource: новый датасорс для догадайтесь чего
- Azure Monitor Datasource: перенесён из плагина в core датасорс
- React Plugin: Графана переезжает на React, React plugin позволяет проще создавать плагины
- Named Colors: цвета по названиям, а не кодам 😁
- Removal of user session storage: теперь проще сетапить Графану без стайтфул хранилища. Вместо хранения сессий выдаются короткоживущие токены
Больше инфы тут
#monitoring #grafana
GitHub
Release v6.0.0 · grafana/grafana
Grafana v6.0 introduces a new way of exploring your data, support for log data and tons of other features.
What’s new in Grafana v6.0
Download
New major features:
Explore A new query focused w...
What’s new in Grafana v6.0
Download
New major features:
Explore A new query focused w...
Each time when I see good Grafana annotation for each event, I think "wow, such great thing, but how it implement fast and do on yesterday?"
Well, recently folks from ContentSquare releases simple tool which post graphite annotations to grafana. And described step by step how they works with Grafana Annotation API in 3 min article that natively complements fairly dry filing official documentation
#monitoring #grafana
Well, recently folks from ContentSquare releases simple tool which post graphite annotations to grafana. And described step by step how they works with Grafana Annotation API in 3 min article that natively complements fairly dry filing official documentation
#monitoring #grafana
GitHub
ContentSquare/grafana-annotation
Tool to post graphite annotations to grafana. Contribute to ContentSquare/grafana-annotation development by creating an account on GitHub.
An interesting comparison between Grafana Mimir and VictoriaMetrics by VictoriaMetrics team.
This article is particularly interesting, because they also describe the test setup. Therefore, one can try to re-produce the test results.
This benchmark was inspired by the original report from Grafana, when they have scaled Mimir to 1 billion active series
#observability #victoriametrics #grafana #mimir
VictoriaMetrics
Grafana Mimir and VictoriaMetrics: performance tests
Benchmarking VictoriaMetrics and Grafana Mimir on the same hardware