
#TradingPlan #NZDCAD
NZDCAD: Great Buying Opportunity
⚠️NZDCAD is currently testing strong daily structure support .
On that, the price is currently forming a double bottom formation.
To catch a bullish move, wait for a breakout of 0.8778 local structure resistance (1H candle close above)
Then buy aggressively or on a retest.
Goal - 0.8832
❗️In case if the price sets a new low hourly, the setup will be invalid.
#TradingPlan #USDJPY
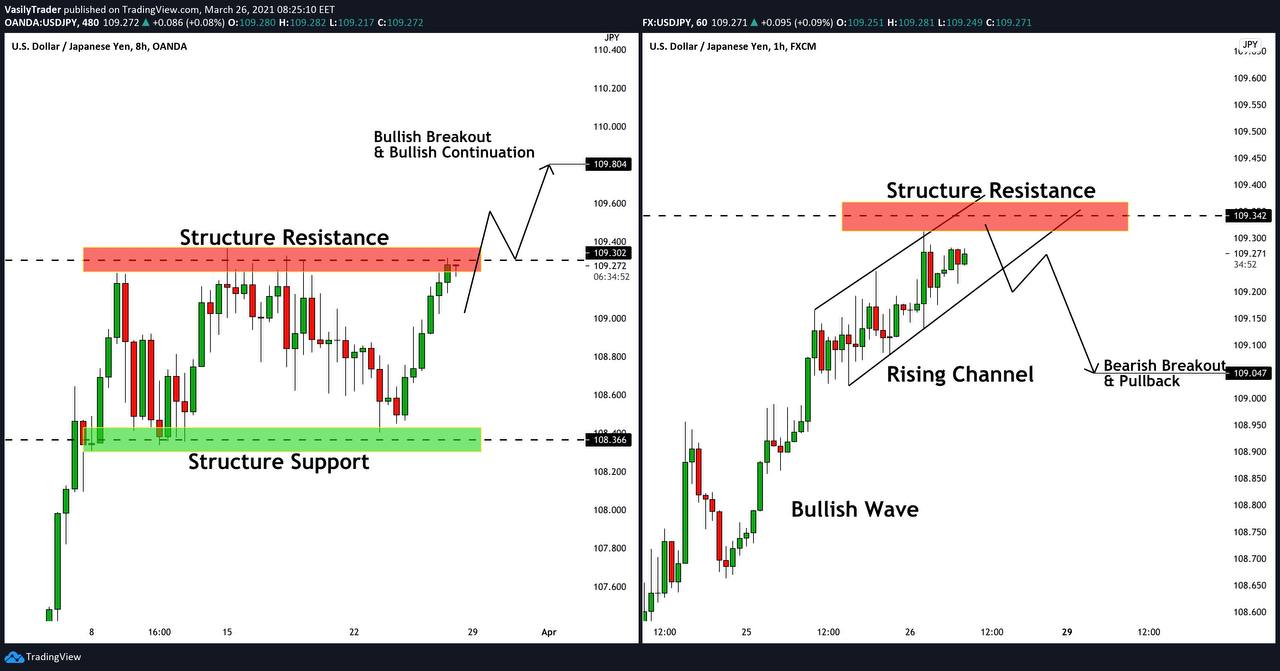
USDJPY: Scenarios & Trading Opportunities
hey traders,
A local decisional moment for ⚠️USDJPY:
the price is retesting a resistance of a horizontal trading range.
From a current perspective there are two potential scenarios:
🟢Bullish - in case of a bullish breakout of resistance of a range
I will expect bullish trend continuation to 109.8
🔻Bearish - on hourly chart the market is slowing down.
After a strong growth from range's support, the market looks exhausted at the moment.
To catch a pullback, wait and sell bearish breakout of a rising parallel channel.
Goal - 109.05
Wait for a breakout & follow the market.
#TradingPlan #USDCAD
USDCAD: Next Swing Move & How to Catch It
⚠️USDCAD is trading within a major falling parallel channel.
The market is closer and closer to its resistance.
To catch the next bearish wave, watch a rising channel on 4H.
Its bearish violation will be a perfect confirmation to short the pair.
First goal will be 1.25
❗️In case of a bullish breakout of a resistance line of a daily channel,
the market may go to higher structure levels
#TradingPlan #GBPCHF
GBPCHF: Be Prepared For The Next Swing Move
⚠️GBPCHF is currently consolidating in a local horizontal trading range.
Taking into consideration that the pair is trading in a long term bullish trend ,
chances are high that at some moment the market will start growing again.
To catch the next wave, wait for a breakout of the underlined horizontal resistance.
It will be your trigger to catch a trend following trade.
Next goal will be 1.315
#TradingPlan #Gold
GOLD (XAUUSD): Watch Carefully!
⚠️Gold set a peculiar equal low retesting a 1678 horizontal support.
Taking into consideration that the market is trading a bearish trend, it can be an important reversal clue.
To catch a bullish move, wait for a bullish breakout of a falling parallel channel on a daily.
It will be a perfect confirmation for initiation of a new swing move.
❗️Remember that in case if a resistance of the channel is respected and a price sets a new lower low, we will expect a further decline.
#TradingPlan #AUDNZD
AUDNZD: How to Catch a Swing Move
⚠️AUDNZD is trading in a strong bullish trend .
After the price reached 1.095 resistance we see a retracement.
Now the price is approaching a strong demand zone:
we see a confluence between a daily horizontal structure & trend line .
❗️To catch a bullish move with a confirmation,
wait for a bullish breakout of a bullish flag pattern on 1H chart.
It will be a perfect trigger to buy.
In case of a major rising trend line breakout, setup will be invalid.
#TradingPlan #EURUSD
EURUSD: Major Structure Ahead! Your Trading Plan
hey traders,
bears keep pushing ⚠️EURUSD .
next week pay attention to 1.16 major support.
chances are high to see a pullback from that structure.
to catch it with a confirmation, wait for a bullish breakout
of a resistance line of a falling wedge pattern.
that is the trigger that I will be waiting for.
In case of a bearish breakout of the underlined support,
further decline will be expected.
#TradingPlan
Breakouts Ӏ CHFJPY
1️⃣Daily
⚠️ CADCHF is trading within a wide trading range on a daily.
115.9 - 116.15 is its support
118.0 - 118.2 is its resistance
2️⃣4H
The price is trading in a local bullish trend.
The higher lows respect a rising trend line.
❗️To catch a bearish move from a daily range's resistance, wait for a trend line breakout.
It will be a strong bearish signal.
Your first goal will be 117.0 level
❗️To catch a bullish swing move, wait for a breakout of the range's resistance on a daily.
It will signify a bullish continuation on a pair.
Your first goal will be 118.75 level
➖➖➖➖➖➖➖➖➖
Learn technical analysis & price action in my premium educational group.
More info - https://www.vasilytrader.com/privategroup
#TradingPlan #NZDJPY
NZDJPY: Potential Pullback Trade
⚠️NZDJPY is trading within a wide horizontal trading range on 4h/1h charts.
This night the price reached its support.
To catch a pullback from the underlined structure with a confirmation,
wait for a bullish breakout of a resistance line of a falling wedge pattern.
Then buy on a retest of the last lower high.
First goal - 77.35
❗️In case of a bearish breakout of the yellow zone, the setup will be invalid.
➖➖➖➖➖➖➖➖➖
СHECK New Educational Video in the Post ABOVE👆👆👆
#TradingPlan #GBPAUD
GBPAUD: The Next Bullish Wave! How to Catch It
Hey traders,
As we earlier discussed, ⚠️GBPAUD is following a major rising trend line and trades in a bullish trend .
Yesterday bears tested that and we saw a positive bullish reaction.
To catch the next bullish wave, follow a small falling wedge on 4H.
Its bullish breakout will be a nice confirmation to catch a swing move.
The first goal will be 1.81
❗️Remember, in case of a bearish breakout of a major rising trend line , setup will be invalid.
#TradingPlan #SILVER
SILVER (XAGUSD) Be Prepared to Buy
Based on my yesterday's analysis, ⚠️SILVER is retesting a major daily trend line .
On that, the price formed a local horizontal range.
❗️I am waiting for hourly candle close above that to buy the market.
Intraday goals:
25.25
25.47
In case if the price sets a new lower low lower close, setup will be invalid.
#TradingPlan #USDJPY
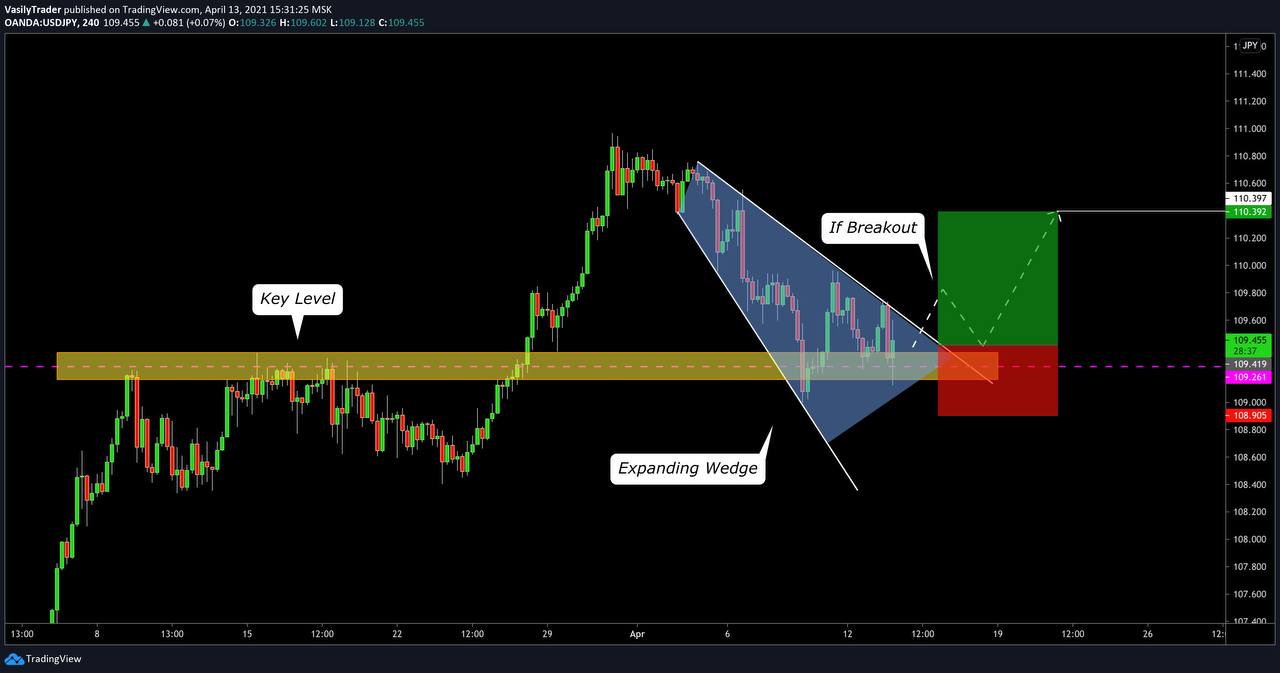
USDJPY: Potential Key Level Trade
⚠️USDJPY is trading in a strong bullish trend .
After the price reached 111.0 level, we see a retracement leg.
Currently, the price is retesting strong daily support (previous structure high).
❗️To catch a trend following move, wait for a breakout of a resistance line of a falling wedge pattern on 4H.
It will be a perfect confirmation.
First goal will be 110.4
In case of a new lower low formation on 4H, the setup will be invalid.
#TradingPlan #NZDCHF
NZDCHF: Waiting for Breakout
⚠️NZDCHF is trading in a correction cycle since February.
However, in a long run, the market still remains sharply bullish .
To catch the trend following move,
wait for a bullish breakout of a resistance line of a bullish flag pattern (1D candle close above).
After a breakout, a strong bullish wave will most likely follow.
Goals:
0.669
0.6745
#TradingPlan #BITCOIN
BITCOIN (BTCUSD) To The MOON Trade
Hey traders,
⚠️Bitcoin has recently set a new higher high higher close.
Now the price is retesting a previous high.
On 4H the price has formed a double bottom formation with a higher low.
❗️I will wait for its neckline breakout (4H candle close above) to buy on a retest.
1️⃣The first goal will be a retest of a current high.
2️⃣For the second goal, I will apply trailing stop and will try to catch a pump.
Let's see how it will play out.
#TradingPlan #OIL
CRUDE OIL (WTI) My Plan to Buy (Trend Following)
⚠️WTI is retesting strong daily structure support .
Because the trend is globally bullish ,
it may give us a perfect spot to buy.
Our confirmation will be a range breakout on 1H.
62.8 is its resistance.
❗️I want to see 1H candle close above that first.
Targets will be:
64.2 / 65.8
Remember, while the price is within the range, the indecision remains.
Wait for a breakout first.
#TradingPlan #OIL
CRUDE OIL (WTI) Update & New Potential Opportunity
Hey traders,
I keep monitoring ⚠️oil chart.
Based on my recent analysis, the price is currently retesting a strong daily structure cluster.
It looks like the market maker decided to push the price lower, invalidating my previous trading plan.
Now I am watching carefully a strong rising trend line on 1H chart.
Currently, we see a test of that trend line and local consolidation in a horizontal trading range.
61.2 is the last lower high.
I want to see a bullish breakout of that level (1H candle close above)
to buy the market.
Goals will be:
62.3
63.6
In case of a bearish breakout of a trend line ,
I will look for shorting opportunities.
#TradingPlan #LTCUSD
Litecoin (LTCUSD): Last Hope on Bulls! My Plan to Buy:
Spring sale on cryptos continues.
⚠️Ltcusd is approaching a support line of a major rising daily channel.
It matches perfectly with a strong horizontal structure and formes a narrow confluence zone.
Within that the price is trading in a narrow trading range on 4h.
242.0 - 254.0 is its resistance.
To buy wisely, wait for its bullish breakout (4H candle close above),
then buy on a retest.
Your goals will be:
285.0
325.0
In case of a bearish breakout of the range,
the market can drop much lower.
#TradingPlan #GBPCAD
GBPCAD: Classic Key Level Trade 🇬🇧 🇨🇦
⚠️GBPCAD is trading on a key daily stucture support.
To catch a pullback from that structure,
focus on a falling wedge pattern on 4H.
Its bullish breakout will be a perfect confirmation to buy.
Goals will be:
1.7265
1.734
❗️In case of a bearish breakout of a yellow structure,
setup will be invalid and bias will change to bearish .
#TradingPlan #EURUSD
EURUSD: Your Detailed Trading Plan For This Week
Hey traders,
Last Friday was very bearish for ⚠️EURUSD .
We see a high momentum bearish candle on a daily time frame and -0.9% net decline.
Ahead is a strong daily structure support .
Depending on the reaction of the market to that structure,
we have two completely opposite plans to trade:
🟢In case of a reversal formation ( bullish one ) on that structure,
we will buy, expecting a bullish trend continuation.
🔻In case of a breakout of that structure and a consequent retest
with a reversal pattern ( bearish one ),
we will sell expecting a further decline.
Be patient and let the market decide.
➖➖➖➖➖➖➖➖➖
📹 Watch detailed market analysis for this week (GOLD, EURUSD, GBPUSD)
in the post ABOVE!👆👆👆
#TradingPlan #EURAUD
EURAUD: Bullish Accumulation & Your Plan
Perfect example of a bullish accumulation on ⚠️EURAUD .
The pair is setting the sequence of higher lows,
respecting the same highs and forming an ascending triangle .
To catch the next swing move, wait for its 1.568 - 1.57 resistance breakout.
Then a bullish continuation will most likely follow.
Your goal will be - 1.59
❗️Remember, in case of a bearish violation of a trend line ,
setup will be invalid.