
PostgreSQL Monitoring for Application Developers: The Vitals
My professional background has been in application development with a strong affinity for developing with PostgreSQL (which I hope comes through in previous articles). However, in many of my roles, I found myself as the "accidental" systems administrator, where I would troubleshoot issues in production and do my best to keep things running and safe. Читать дальше.
My professional background has been in application development with a strong affinity for developing with PostgreSQL (which I hope comes through in previous articles). However, in many of my roles, I found myself as the "accidental" systems administrator, where I would troubleshoot issues in production and do my best to keep things running and safe. Читать дальше.
Crunchy Data
PostgreSQL Monitoring for Application Developers: The Vitals
What are some of the key stats to look at to ensure your PostgreSQL cluster is healthy? How can you use this stats to diagnose the problem?
New in Grafana Tanka: Customize Helm charts without modifying them
Helm charts are great. They combine high quality, ready-made runtime configurations for a huge number of applications with an incredible getting-started experience. Читать дальше.
Helm charts are great. They combine high quality, ready-made runtime configurations for a huge number of applications with an incredible getting-started experience. Читать дальше.
Grafana Labs
New in Grafana Tanka: Customize Helm charts without modifying them | Grafana Labs
Grafana Tanka now enables you to load Helm charts into Jsonnet and treat them as regular JSON objects.
sysmon
Graphical system monitor for linux, including information about CPU, GPU, Memory, HDD/SDD and your network connections. Similar to windows task manager. Репозиторий.
Graphical system monitor for linux, including information about CPU, GPU, Memory, HDD/SDD and your network connections. Similar to windows task manager. Репозиторий.
GitHub
GitHub - MatthiasSchinzel/sysmon: Graphical system monitor for linux, including information about CPU, GPU, Memory, HDD/SDD and…
Graphical system monitor for linux, including information about CPU, GPU, Memory, HDD/SDD and your network connections. Similar to windows task manager. - MatthiasSchinzel/sysmon
PostgreSQL Monitoring for App Developers: Alerts & Troubleshooting
If you choose only one thing to alert on in your PostgreSQL cluster (and as I hope this article makes clear, you should alert on multiple things), it should be availability. If your application is unable to connect or transaction with your database, you're probably in for a bad day. Читать дальше.
If you choose only one thing to alert on in your PostgreSQL cluster (and as I hope this article makes clear, you should alert on multiple things), it should be availability. If your application is unable to connect or transaction with your database, you're probably in for a bad day. Читать дальше.
Crunchy Data
PostgreSQL Monitoring for App Developers: Alerts & Troubleshooting
When should you be alerted about issues in your PostgreSQL clusters? How do you troubleshoot them? What are some typical solutions?
5 Prometheus Exporter Best Practices
20 октября Sysdig проведёт вебинар. Регистрация.
⚡ Find the right Prometheus exporter
⚡ Understand your exporter metrics
⚡ Set alerts that matter and are actionable
⚡️ Enable your team to use your data (or not)
⚡️ Have a plan for scale
20 октября Sysdig проведёт вебинар. Регистрация.
⚡ Find the right Prometheus exporter
⚡ Understand your exporter metrics
⚡ Set alerts that matter and are actionable
⚡️ Enable your team to use your data (or not)
⚡️ Have a plan for scale
We’re making Prometheus use less memory and restart faster
A few months ago, I blogged about memory-mapping of full chunks of the head block from disk. The feature, which was introduced in Prometheus v2.19.0, brings down memory usage and restart time.
Additionally, there’s another Prometheus feature in progress that snapshots in-memory data during shutdown for faster restarts; it’s expected to cut down the restart times by a big factor. Интересно, как это.
Grafana Labs
We’re making Prometheus use less memory and restart faster | Grafana Labs
Here's a recap of the new Prometheus features that are bringing down memory usage and restart time.
How we improved our Kubernetes monitoring at Smarkets, and how you could too
Monitoring Kubernetes internal endpoints and APIs can be tricky, especially when you want automated infrastructure as a service to be used in your company. At Smarkets, we are not fully there yet, but thankfully we are close. I’m hoping that our journey through the process will help you if you wish to do something similar. Читать дальше.
Monitoring Kubernetes internal endpoints and APIs can be tricky, especially when you want automated infrastructure as a service to be used in your company. At Smarkets, we are not fully there yet, but thankfully we are close. I’m hoping that our journey through the process will help you if you wish to do something similar. Читать дальше.
Medium
How we improved our Kubernetes monitoring at Smarkets, and how you could too
Monitoring Kubernetes internal endpoints and APIs can be tricky when you want automated infrastructure as a service to be used company…
Зонтичная система мониторинга, ресурсно-сервисные модели ML, AI и вот это всё в DX OI от Broadcom (бывший CA).
На Хабр!
На Хабр!
Хабр
Зонтичная система мониторинга и ресурсно-сервисные модели в обновленном DX Operations Intelligence от Broadcom (ex. CA)
В этом сентябре Broadcom (бывшая CA) выпустила новую версию 20.2 своего решения DX Operations Intelligence (DX OI). На рынке этот продукт позиционируется как зонтичная система мониторинга. Система...
Мониторинг СХД IBM Storwize при помощи Zabbix
В данной статье мы немного поговорим о мониторинге СХД IBM Storwize и других СХД, поддерживающих протоколы CIM/WBEM. Необходимость такого мониторинга оставлена за скобками, будем считать это аксиомой. В качестве системы мониторинга будем использовать Zabbix. На Хабр!
В данной статье мы немного поговорим о мониторинге СХД IBM Storwize и других СХД, поддерживающих протоколы CIM/WBEM. Необходимость такого мониторинга оставлена за скобками, будем считать это аксиомой. В качестве системы мониторинга будем использовать Zabbix. На Хабр!
Добавляем CMDB и географическую карту к Zabbix
В этой статье расскажем о паре инструментов для расширения функционала Zabbix: CMDB на базе бесплатного решения iTop и карте объектов на базе OpenStreetMap (OSM). А в конце статьи ваш ждет ссылка на репозиторий с кодом фронтовой части для OSM. Читать дальше.
В этой статье расскажем о паре инструментов для расширения функционала Zabbix: CMDB на базе бесплатного решения iTop и карте объектов на базе OpenStreetMap (OSM). А в конце статьи ваш ждет ссылка на репозиторий с кодом фронтовой части для OSM. Читать дальше.
A guide to setting up Kubernetes Service Level Objectives (SLOs) with Prometheus and Linkerd
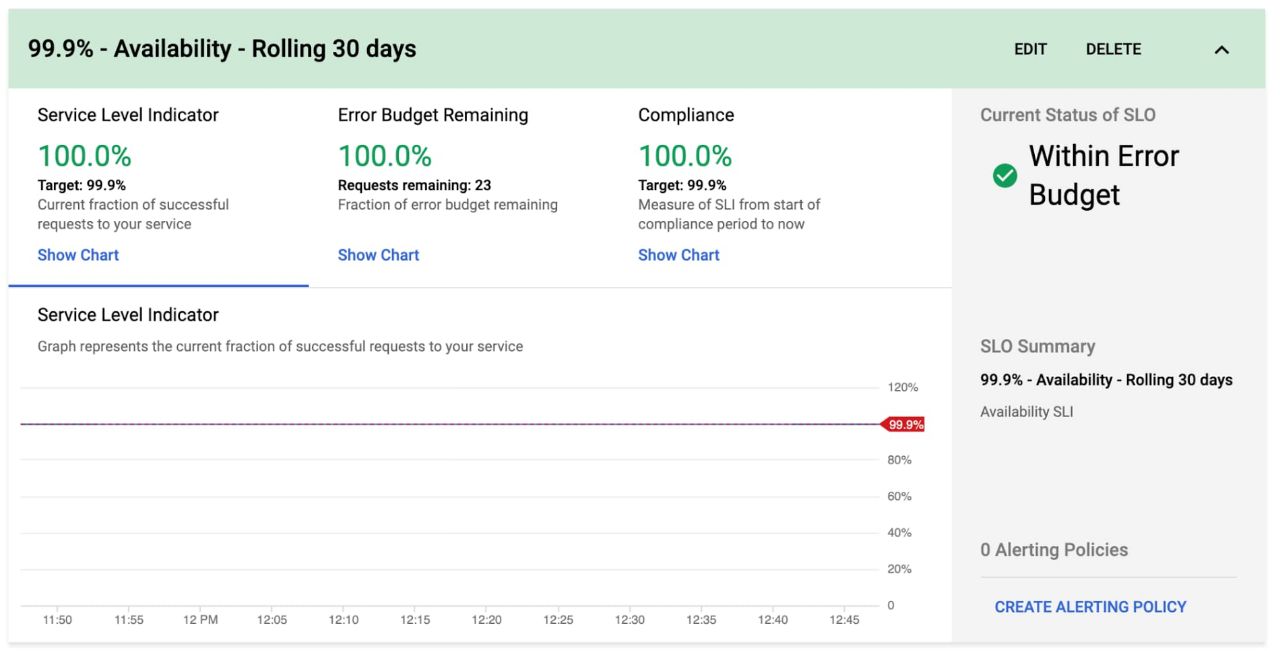
In this tutorial, we’re going to see how to set up a basic success rate SLO with a rolling window for a gRPC service running on Kubernetes. Of course, the techniques we use here are just as applicable to different types of metrics and SLOs. Читать дальше.
In this tutorial, we’re going to see how to set up a basic success rate SLO with a rolling window for a gRPC service running on Kubernetes. Of course, the techniques we use here are just as applicable to different types of metrics and SLOs. Читать дальше.
Announcing Grafana Tempo, a massively scalable distributed tracing system
И целого Jaeger мало! В семействе Grafana пополнение. Перейти на распределенный трейсинг.
И целого Jaeger мало! В семействе Grafana пополнение. Перейти на распределенный трейсинг.
Pktvisor: Open source tool for network visibility
NS1 announced that pktvisor, a lightweight, open source tool for real-time network visibility, is available on Github. Читать дальше.
Репыч на Гитхабе.
NS1 announced that pktvisor, a lightweight, open source tool for real-time network visibility, is available on Github. Читать дальше.
Репыч на Гитхабе.
Zabbix под замком: включаем опции безопасности компонентов Zabbix для доступа изнутри и снаружи
А не пришло ли время разобраться и навести наконец-то порядок с безопасностью в мониторинге? Тем более, в одной из популярных систем мониторинга и встроенная возможность такая имеется. Читать дальше.
А не пришло ли время разобраться и навести наконец-то порядок с безопасностью в мониторинге? Тем более, в одной из популярных систем мониторинга и встроенная возможность такая имеется. Читать дальше.
@devopslibrary - Канал с актуальными книгами, новостями и гайдами по теме DevOps и Site Reliability Engineering.
Выбор SLO: пошаговая инструкция в блоге Гугл на примере интернет-магазина.
Forwarded from DevOps Tricks | Десять лет в IT
Нужен базовый мониторинг сетевых устройств, но zabbix или nagios избыточны?
Решение есть: Thola!
Thola проверет доступность и базовые показатели мониторинга сетевых устройств. Решение развивается, ждем дополнительную функциональность в следующих версиях.
https://github.com/inexio/thola
https://app.swaggerhub.com/apis-docs/TheFireMike/thola/1.0.0#/
#monitoring #свежак
Решение есть: Thola!
Thola проверет доступность и базовые показатели мониторинга сетевых устройств. Решение развивается, ждем дополнительную функциональность в следующих версиях.
https://github.com/inexio/thola
https://app.swaggerhub.com/apis-docs/TheFireMike/thola/1.0.0#/
#monitoring #свежак
GitHub
GitHub - inexio/thola: Tool for monitoring network devices (mainly using SNMP) - monitoring check plugin
Tool for monitoring network devices (mainly using SNMP) - monitoring check plugin - inexio/thola
How to use relabeling in Prometheus and VictoriaMetrics
Prometheus supports relabeling, which allows performing the following tasks:
⚡️ Adding new label
⚡️ Updating existing label
⚡️ Rewriting existing label
⚡️ Updating metric name
⚡️ Removing unneeded labels
⚡️ Removing unneeded metrics
⚡️ Dropping metrics on certain condition
⚡️ Modifying label names
⚡️ Chaining relabeling rules
Lets’ looks at how to perform each of these tasks. Читать дальше.
Medium
How to use relabeling in Prometheus and VictoriaMetrics
Prometheus supports relabeling, which allows performing the following tasks: