
#TradingEducation
Good Saturday, everyone! Hope you are having a wonderful time 😉 While the market is closed, let's recall the most famous candlestick patterns that signal the reversal of a trend!
Hammer. For sure, Thor’s favorite reversal pattern is the Hammer. Indeed, it looks like a hammer! The candle has a long lower shadow, which should be at least twice the length of the real body. Hammers show that although bears were able to pull the price to a new low, they failed to hold it there and by the end of a trading period lost a battle with buyers.
Inverted Hammer. This is the hammer pattern turned upside down. However, apart from the hammer, this setup requires the bearish candlestick before the inverted hammer itself. Its signal is more reliable when the second candlestick is bullish. The pattern needs confirmation in the form of a breakout of the nearest resistance zone or a trend line.
Morning Star. This is the nickname for the planet Mercury. If you look at the sky and see it, the sunrise will start soon. With prices, it is the same: when the morning star appears, the price will go up. The first candlestick of the pattern should be bearish, with a big real body. The second candlestick should open with a gap down (below the body of the first candlestick) and has a small real body. It shows that sellers get weaker. The color of this candlestick doesn't matter. The third candlestick should fill in the last bearish gap. It should be bullish and close above the middle of the first candlestick.
Did you know these patterns? What other candlestick patterns do you know? Share in the comments!
#TradingEducation
It's Saturday, my dudes! 😎 And do you know what that means?
Time to learn some new information! Last week we shared with you the most popular candlestick patterns. You already know about a hammer, a shooting, and a morning star. What can make the "hammer" pattern even stronger?
A good confirmation, of course!
Look at the picture and learn when a reversal can be legit, and when you should avoid entering the market 😉
Share in the comments which patterns you've seen recently!
To learn more about candlestick patterns, visit the FBS website: https://bit.ly/34uiPH5
#TradingEducation
🤓Good Saturday, everyone! Are you ready to learn something new about trading?
Today, we want to talk about correlation. Correlation in Forex is a connection between currency pairs. The stronger the correlation is – the more related their price charts are. There are two types of correlation: positive and negative.
🟢 Positive correlation is extremely high between AUD/USD and NZD/SD, EUR/USD and GBP/USD, USD/JPY and GBP/JPY.
🔴 Negative correlation can be seen between such pairs as EUR/USD and USD/CHF, GBP/USD and USD/CAD, USD/CAD and EUR/JPY.
It is significant for every trader to monitor correlations in the Forex market. For example, traders could accidentally go long on (buy) USD/CAD and go short on (sell) EUR/JPY thinking they have opened two different trades. But, instead, these pairs tend to move in opposite directions since these currency pairs have a strong negative correlation.
Which Forex correlation trading strategies exist?
◽️Coping strategy - When one positively correlated pair is rising and the other is lagging, you can predict with a great possibility its future movement simply by looking at its twin.
◽️Double-check strategy - If you open orders with correlated pairs, be cautious as you can increase the level of risk you take. Use signals from both correlated pairs.
◽️Hedging strategy - If a trader place a buy order for two pairs that are negatively correlated, one of the trades will cover the losses.
Let's chat! Do you use Forex correlations in trading?
For more insights on correlations in trading, visit the FBS website: https://bit.ly/3BxutwN
#tradingeducation
🧐Saturday is the best day to learn a new strategy. Today, we will show you how to trade the opening range breakout.
☑️The opening range is the space between the high and the low of the price for a given period after the market opens. Usually, this period is less than an hour-long, and the opening range breakout (ORB) strategy uses these levels as entry points.
🤓The most important part of the opening range trading is the breakout. You can use an opening range breakout calculator, that calculates the high and the low of the opening range.
Let's look at the easy algorithm of this strategy:
1️⃣ On the first step, look for gaps in stock prices. Gap scanners are available online for free, so this part shouldn’t be hard.
2️⃣ After you found a suitable gap, open the chart of a stock and wait for the start of the trading session. For the US stocks, the action begins at 16:30 GMT+2 from September to March, and at 16:30 GMT+3 from March to September.
3️⃣Depending on the timeframe you have chosen, wait for the first 4-6 candles to close. Usually, traders choose five-minute candles. Then, you should define the high and the low of the range, as we did earlier in this tutorial.
4️⃣On the breakout of the range, you enter the trade in the direction of the movement. Your stop loss should be in the range (below the range high for long trades and above the range low for short trades). To maintain the risk-management, take profit is usually placed twice as far as stop loss.
If you are eager to learn more about this strategy, go to the FBS website: https://bit.ly/3JqxBwG
#TradingEducation
🔥 Guide to plan your trade
The first thing you need to do before your trading session is to look at the chart. Is it bullish or bearish?
When it’s bullish, ask yourself the next question- is the price at the support? Yes – open the buy trade! No- wait for some time.
When it’s bearish, you look if the price is at the resistance. Yes- don’t trade now; no- it’s time to make a sell order!
If the price is neither bullish nor bearish, catch the moment of trend breakout. After that, do the following steps above!
Read our Guidebook to learn more!
🟩https://bit.ly/3wGVwUe🟩
Save this flowchart for future orders!
#TradingEducation
🐊𝐒𝐞𝐞 𝐲𝐨𝐮 𝐥𝐚𝐭𝐞𝐫, 𝐚𝐥𝐥𝐢𝐠𝐚𝐭𝐨𝐫!
The alligator a great forex indicator for scalpers, especially when it comes to finding stable trend conditions. Its purpose is to determine the trend and its direction, and filter good signals from bad ones, thus avoiding a range-bound market that can lead to losses.
The indicator consists of 3 moving averages shifted towards the future:
🟦The alligator's jaw (blue line) is a smoothed moving average with a period of 13, shifted 8 bars into the future.
🟥Alligator teeth (red line) is a smoothed 8-period moving average moved 5 bars into the future.
🟩Alligator's lips (green line) is a 5-period smoothed moving average moved 3 bars into the future.
As long as the alligator line remains tangled and straight, trend conditions can be considered confirmed. The RSI indicator with a high frequency (short calculation period) is used to find as many trading opportunities as possible within a trend.
𝐇𝐨𝐰 𝐭𝐨 𝐭𝐫𝐚𝐝𝐞 𝐰𝐢𝐭𝐡 𝐀𝐥𝐥𝐢𝐠𝐚𝐭𝐨𝐫 𝐢𝐧𝐝𝐢𝐜𝐚𝐭𝐨𝐫?🤔
1️⃣Check that the alligator is trading above 200-SMA.
2️⃣Look at the RSI, it should move below the 30 level.
3️⃣Open the long trade on the first bullish candlestick after RSI falls below 30.
4️⃣Close the trade at the closing price of the first bearish candle.
Now you’re a pro! Use this indicator to improve your trade!
🐊 LEARN ABOUT THE ALLIGATOR TRADING STRATEGY
#TradingEducation
🧐Do you know the best ways to work with trends?
If a trader understands how to define trends, they will most likely have few problems opening a position. A trader needs to have a clear strategy for riding trends to increase the chances of successful trading. FBS analysts prepared for you an ultimate guide how to follow and trade trends! Check it out ➡️
📈https://bit.ly/39Ug0BN 📈
#TradingEducation
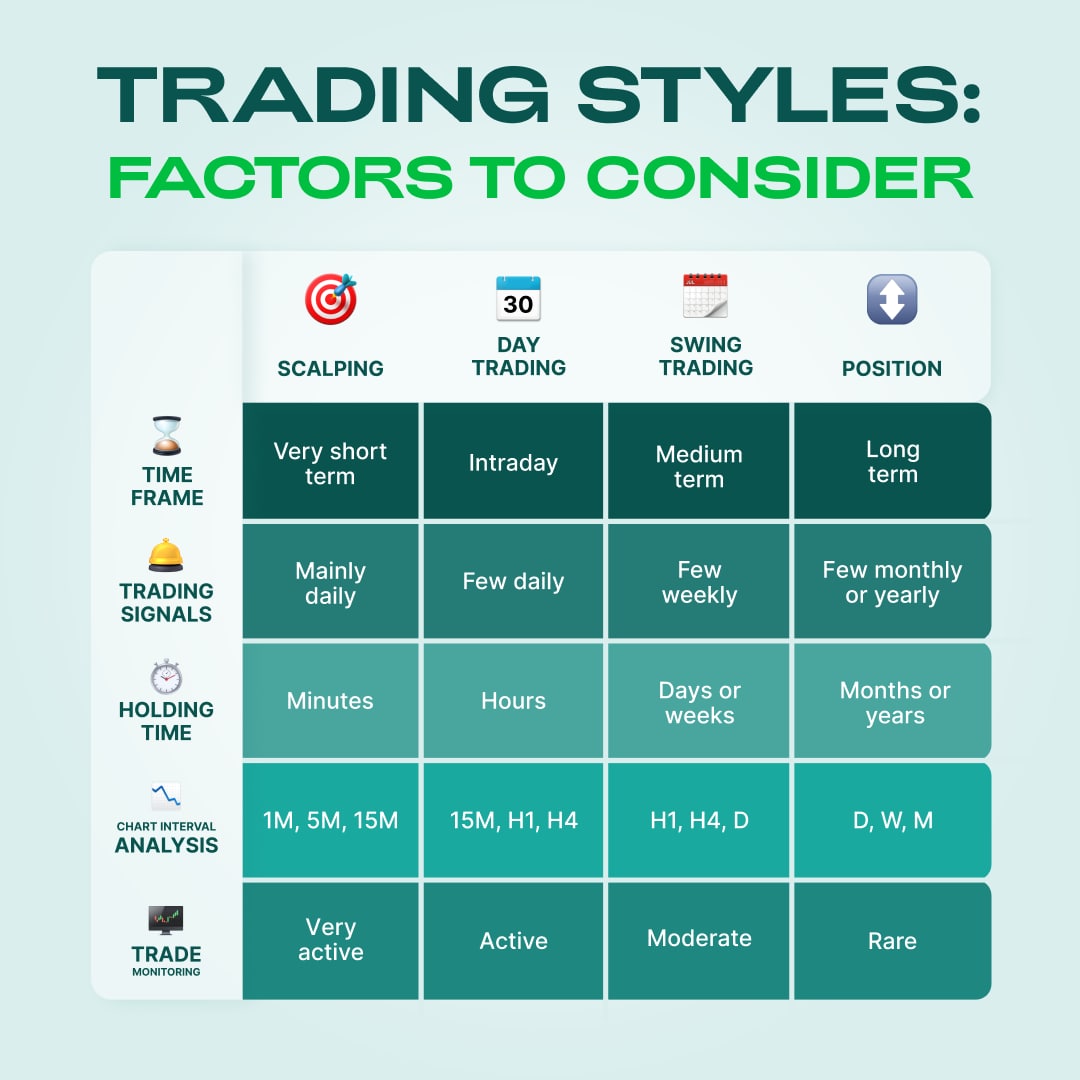
🧐 Trading styles: factors to consider
Still can’t choose the trading style, or maybe you don’t know the difference between them? Don’t worry, let’s look at them:
◻️ Scalping
Scalpers are really active traders. They hold their order open only within several minutes, so they analyze charts every 1, 5, or 15 minutes. The duration of one order is also measured in minutes. Scalpers should use a very short timeframe and check signals mainly daily.
◼️ Day Trading
Day traders trade actively within one day. They hold positions open for hours and check the chart every 15 minutes, 1 hour or 4 hours. Intraday traders look at the same day’s timeframe and follow a few signals daily.
◻️ Swing Trading
Swing traders are moderately active, and they hold positions for some days or even weeks. They usually monitor markets every 1 hour, 4 hours, or daily. They use a medium timeframe and check signals a few times a week.
◼️ Position
These traders are extremely patient. They are rarely active and hold the position for a long time: months or even a year. They use long-term timeframes and can check the chart for daily, weekly or even monthly analysis. They follow a few signals in a month or a year.
Choosing the trading style depends on your personality and how patient you are. If you are a beginner, try trading differently, and you’ll see what is best!
To learn strategies for each trading style, visit the FBS website: https://bit.ly/3AdIpdL
#TradingEducation
☁️The Sky-High Profits with Ichimoku Cloud
😎Hey guys! Here's yet another indicator of the week. Let’s talk about the Ichimoku Cloud. Ichimoku Cloud (also known as Ichimoku Kinko Hyo) is a popular technical indicator developed in Japan. Translated into English, the indicator's name is "One glance equilibrium chart," as traders can derive a variety of information from it.
While this indicator may seem challenging to understand, it can tell a lot, and there is no need for additional indicators.
🤔What are the elements of the Ichimoku Cloud?
The Ichimoku Cloud consists of four elements, which you can see below. All of them have alternative Japanese names that we mentioned in brackets.
🔹Cloud (Kumo) – a space between the 2 MAs that is usually shaded on the chart;
🔹Base line (Kijun-sen) – long-term MA (usually 26 periods);
🔹Turning line (Tenkan-sen) – short-term MA (usually nine periods);
🔹Lagging line (Chinkou Span) – closing price of the current candle, which has been moved 26 periods back.
However, there is no need to learn them by heart. You can read about the details on the FBS website. A crossover of different elements can generate good trade signals.
🔈Let's look at the strategy you can use with the Ichimoku Cloud. We will consider a “Sell” scenario and a daily timeframe.
1️⃣ After the price breaks below the cloud, you can consider opening a sell order.
2️⃣ You enter the market on the next bearish candlestick.
3️⃣ You can place a Stop Loss above the recent high.
4️⃣ You can close the trade after a crossover of the Baseline and the Turning line.
💚Now you know one easy trading strategy with the Ichimoku Cloud! See, this indicator is not that complicated!
Leave a reaction if you like to use it in trading!
#TradingEducation
✨ If you want to transform your trading career from this year, the new article by the FBS team is for you!
Find out what suits you best: part-time or full-time trading in 2023!🤍
➡️ https://bit.ly/3VOkpI9
Find out what suits you best: part-time or full-time trading in 2023!
Please open Telegram to view this post
VIEW IN TELEGRAM
#TradingEducation
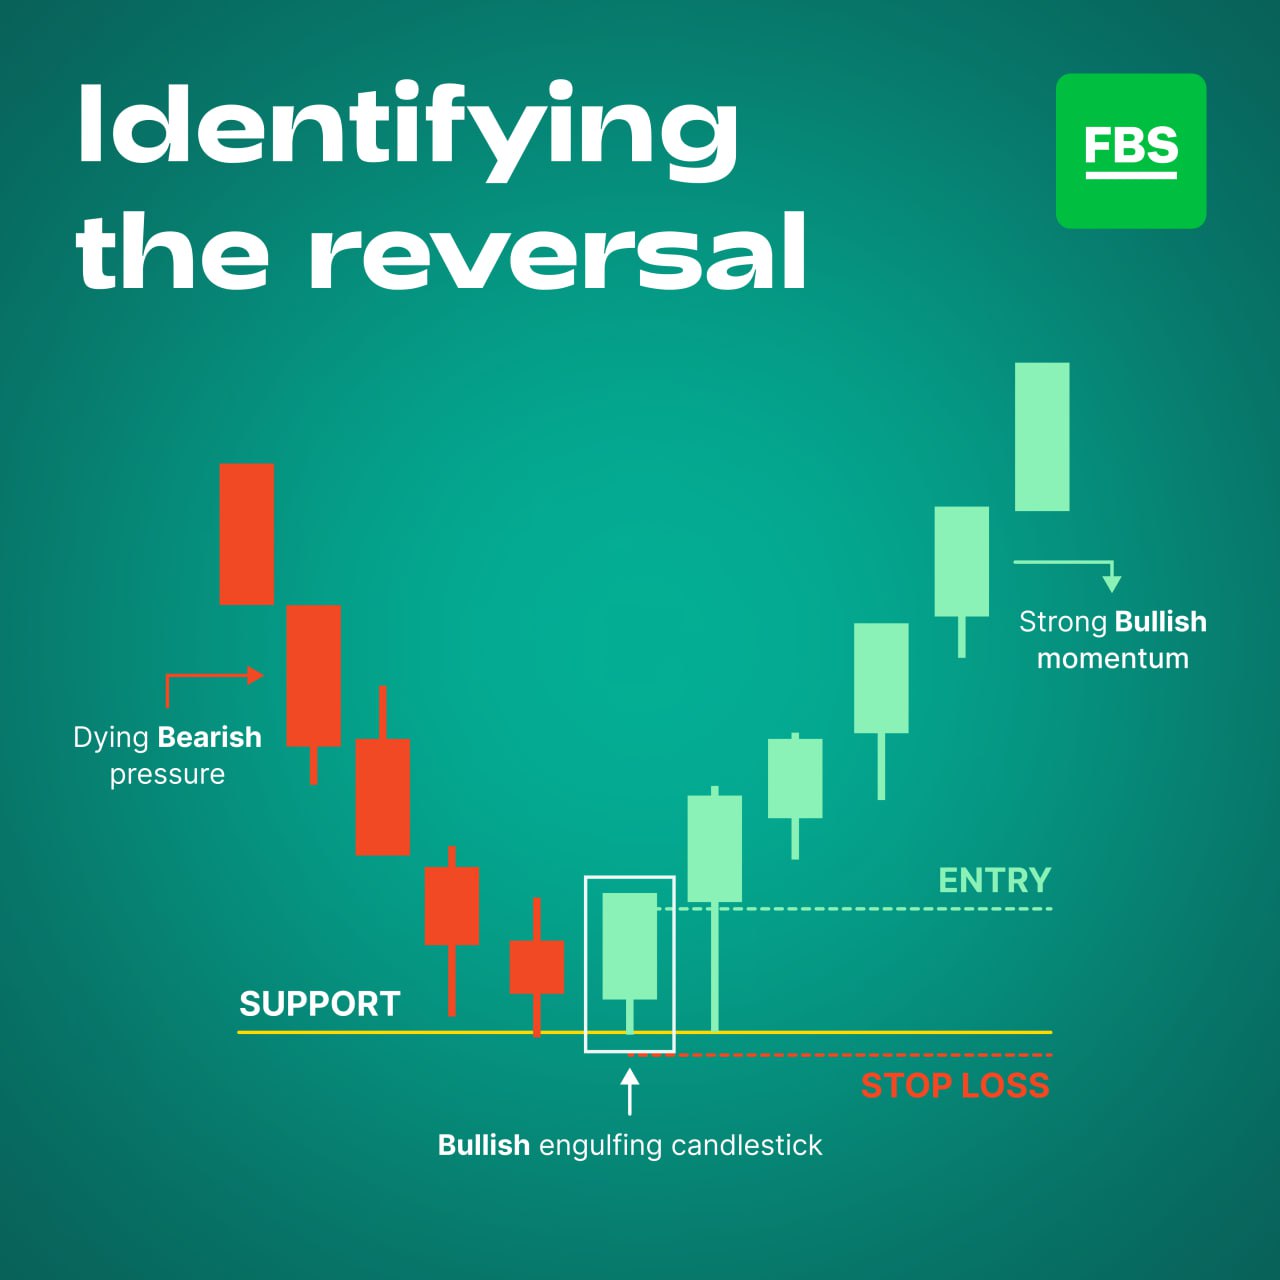
🧐 How to identify the reversal?
It may be hard to spot a reversal when the price moves within a trend. However, there are certain signals that can actually help. Let's consider an example.
In the picture below, the price was moving within a downtrend. The price started forming candlesticks with long lower shadows and small real bodies. That was the first sign of the weakening trend.
After the price reached a strong support and formed a small candlestick, a big green candlestick appeared. The Bullish Engulfing pattern was confirmed by the following bullish candle.
This is a good moment for placing the long entry order near the opening price of the bullish candlestick after the Engulfing pattern.
A protective Stop Loss is recommended to set below the support level, where the reversal happened.
🫵 Do you use candlestick patterns to confirm a reversal?
#TradingEducation
Are you tired of trying to make sense of those chaotic charts and graphs? Well, fear not my friends, because today we're going to learn the ultimate secret of the Forex world: how to draw a trend line!
Now, before we begin, let me just say that drawing a trend line is like trying to tame a wild lion. It may seem intimidating at first, but with a little bit of practice and the right tools, you'll be the king of the chart jungle in no time!
1️⃣ Step 1: Identify the trend. This is where the real magic happens. Look for a series of higher highs and higher lows for an uptrend or lower lows and lower highs for a downtrend.
2️⃣ Step 2: Grab your trusty pen or pencil (or your digital equivalent) and start connecting the dots. A trend line is simply a straight line that connects two or more significant price points.
3️⃣ Step 3: Now, you may be tempted to just draw a straight line through the middle of all the price points, but that's where you'll go wrong. A true trend line should be touching at least two extreme points on the chart.
4️⃣Step 4: Once you have your trend line, it's time to put it to the test. As prices continue to move, use your trend line as a guide and see if the market is following it. If it holds, then congratulations, you've just tamed the lion!
And there you have it, folks! Now go forth and conquer the Forex world with your newfound trend line skills! To find out trend-trading strategies, visit the FBS website: https://bit.ly/3CVz3a9🏆
#TradingEducation
🔮Do you know what candlesticks tell you?
Candlestick charting is a popular technical analysis tool used in finance to represent the price movement of an asset, such as stocks or currency, over a certain period of time. There are several types of candlesticks that can indicate the balance of power between buyers and sellers in the market.
✔️ Candlesticks with buyers in total control: This type of candlestick shows that buyers have completely dominated the market and pushed prices up. The candlestick is typically green or white and its body is long.
✔️ Candlesticks with buyers in control: This type of candlestick shows that buyers have the upper hand, but not as strongly as in the first type. The body of the candlestick is shorter and there may be some upper shadow.
✔️ Candlesticks with active sellers but stronger buyers: This type of candlestick shows that while sellers are trying to push prices down, buyers are able to keep prices up. The candlestick has a long upper shadow and a short lower shadow.
✔️ Candlesticks with buyers winning but showing weakness: This type of candlestick shows that buyers were able to push prices up, but only slightly and with difficulty. The body of the candlestick is short and there may be a long upper shadow.
✔️ Candlesticks with sellers in total control: This type of candlestick shows that sellers have completely dominated the market and pushed prices down. The candlestick is typically red or black and its body is long.
✔️ Candlesticks with sellers in control: This type of candlestick shows that sellers have the upper hand, but not as strongly as in the fifth type. The body of the candlestick is shorter and there may be some lower shadow.
✔️Candlesticks with active buyers but stronger sellers: This type of candlestick shows that while buyers are trying to push prices up, sellers are able to keep prices down. The candlestick has a long lower shadow and a short upper shadow.
✔️ Candlesticks with sellers winning but showing weakness: This type of candlestick shows that sellers were able to push prices down, but only slightly and with difficulty. The body of the candlestick is short and there may be a long lower shadow.
It is important to note that interpreting candlestick charts is not an exact science and should be used in combination with other technical analysis tools and market indicators.
Learn more about candlestick patterns: https://bit.ly/3DDSmVz