
#TradeIdea
👉 💡 ▶️ ⏩ XAGUSD Analysis!
👀 XAGUSD has formed a descending channel pattern; the price is actively testing the lower trend line, creating two possible scenarios.
🔼 If the price bounces off the lower trend line, we can expect a rise to the upper trend line, reaching the resistance at 22.650
🔽 However, if the price falls below the 22.300 support, silver will rally sharply to the 22.000 level
🧐 Are you bullish or bearish on XAGUSD? Share in the comments👇
➡️ TRADE WITH FBS
@fbsanalytics
@fbsanalytics
Please open Telegram to view this post
VIEW IN TELEGRAM
👍48❤14🔥6✍5💩2🆒2❤🔥1🌭1💯1🏆1
#TradeIdea
👉 🇻🇦 🇯🇵 👈 USDJPY Outlook!
💸 USDJPY is currently testing the critical support zone at the 150.800 level. Here are the possible scenarios for the asset's next move:
🔼 If USDJPY breaks through the 150.800 resistance, we will see an ascent to the 151.300 resistance level.
🔽 The asset's price might retreat to the 150.000 level if a corrective move occurs.
🤔 Are you on the bullish or bearish side? Share your opinion in the comments.👇
➡️ TRADE WITH FBS
@fbsanalytics
@fbsanalytics
Please open Telegram to view this post
VIEW IN TELEGRAM
👍49❤15🔥7✍4❤🔥2
Link: https://t.me/fbsanalytics?livestream
❗️Link will be active at 15:00 GMT+2
@fbsanalytics
Please open Telegram to view this post
VIEW IN TELEGRAM
❤🔥34👍30❤15🔥6⚡2👏2🎉2🙏1🐳1🍾1🆒1
#TradeIdea
👉 🇦🇺 🇨🇦 👈 AUDCAD Outlook!
👁 On the H1 timeframe, AUDCAD exhibits a bullish flag pattern, currently testing the pattern's lower border and the 0.8820 support level. The forthcoming movement could follow one of two paths:
🔼 A rebound from the 0.8820 support could propel the asset towards 0.8850.
🔽 A break below the support and the pattern's lower border could lead to a decline to 0.8800.
Smash ❤️ if you agree!
➡️ TRADE WITH FBS
@fbsanalytics
Smash ❤️ if you agree!
@fbsanalytics
Please open Telegram to view this post
VIEW IN TELEGRAM
❤44👍22🔥5🆒5🏆2✍1❤🔥1🤩1
FBS Analytics
Ask your questions in the comments
Please open Telegram to view this post
VIEW IN TELEGRAM
Telegram
FBS Analytics
Market news & trade ideas & Live streams and more by FBS team!🚀
🤝FBS Support: @fbs_official_bot
🌐FBS website: https://fbs.com
📲FBS Mobile app: https://fbspa.onelink.me/00Zt/8w2366it
❗️Channel rules: https://telegra.ph/FBS-analytics-chat-rules-11-22
🤝FBS Support: @fbs_official_bot
🌐FBS website: https://fbs.com
📲FBS Mobile app: https://fbspa.onelink.me/00Zt/8w2366it
❗️Channel rules: https://telegra.ph/FBS-analytics-chat-rules-11-22
👍57❤14🍾5🔥4👏2🏆2❤🔥1🎉1🤩1👀1
FBS Analytics
#AIvsAnalyst 🚀 AI vs Analyst 🚀 👏 Finally! We will compare our artificial intelligence forecasts with our lead analyst's analysis. Who will be more accurate❓ 🔍 Signal from AI: Asset: AUDUSD Entry Point: 0.6590 Take Profit: 0.6635 Chart Pattern: Symmetrical…
#AIvsAnalyst
👋 Good evening, dear traders!
🎉 The last round saw a triumph for the Analyst, who accurately predicted the rise in USDCAD, hitting the target of 1.3580! Unfortunately, the signal from Artificial Intelligence did not fare well, proving incorrect 😨
🚀 Next Round 🚀
🔍 Signal from AI:
Asset: EURAUD
Entry Point: 1.6567
Take Profit: 1.6475
Chart Pattern: Bearish wedge
🔍 Signal from Analyst:
Asset: USDJPY
Entry Point: 150.900
Take Profit: 151.500
Analysis: Ascending triangle
🤖 vs 🧠 SCORE: [0:1]
❓ Who will you bet on this time? Share your thoughts in the comments 👇
➡️ TRADE WITH FBS
@fbsanalytics
🚀 Next Round 🚀
Asset: EURAUD
Entry Point: 1.6567
Take Profit: 1.6475
Chart Pattern: Bearish wedge
Asset: USDJPY
Entry Point: 150.900
Take Profit: 151.500
Analysis: Ascending triangle
🤖 vs 🧠 SCORE: [0:1]
@fbsanalytics
Please open Telegram to view this post
VIEW IN TELEGRAM
❤47👍35🔥14❤🔥5🗿5⚡3🎉3🤩3👎2🤣1
👍72❤23🔥11❤🔥7😢5⚡3🍾3🆒3🎉2✍1🙈1
#MarketNews
👋 Hello, dear traders! Today is Thursday, February 29, 2024. It is time to explore what is happening in today's financial world:
⚡️ In the U.S. Congress, an agreement has been reached on the budget to prevent a government shutdown, announced by the Speaker of the House of Representatives, Mike Johnson.
🇯🇵 Members of the Bank of Japan are gradually beginning to prepare markets for an exit from the policy of negative interest rates, with an increasing number of speakers discussing rate hikes to varying degrees.
📊 Coinbase has surpassed the Hong Kong Stock Exchange (HKEX) to become the fourth largest exchange in the world by market capitalization. Shares of Coinbase (COIN) are trading at $200.73.
🔥 China will increase its natural gas imports by 8.2% in 2024, according to CNPC. The price of natural gas (XNGUSD) is $1.912.
🛍 Alibaba announces a record 20% price reduction on its cloud services, marking the company's most significant price cut in history, with its shares trading at $74.59.
🌐 The daily trading volume of spot BTC-ETFs surged to a record $7.7 billion. BTCUSD is at $63,400.
🇹🇷 Turkey's $1.1 trillion economy likely grew, avoiding a recession after major central bank rate hikes, with a projected Q4 GDP growth of 0.3%.
📉 Snowflake shares fell more than a fifth after the cloud computing group announced its CEO's immediate resignation and issued a weak forecast in its latest results. #SNOW is at $229.95.
✂️ Three Federal Reserve officials stated that the pace of interest rate cuts will depend on incoming economic data, suggesting that the path to lower borrowing costs may differ from previous rate-cutting cycles.
That's it for today, guys! Click on ❤️if you liked our review, and see you soon!
➡️ TRADE WITH FBS
@fbsanalytics
That's it for today, guys! Click on ❤️if you liked our review, and see you soon!
@fbsanalytics
Please open Telegram to view this post
VIEW IN TELEGRAM
👍44❤24🔥7❤🔥4🤩2🌭1🍾1
#TradeIdea
👉 🥇 🇻🇦 🚀 👈 XAUUSD is bullish!
☄️ XAUUSD has successfully breached the upper boundary of the bullish flag and is now targeting the key resistance level at 2038.00.
🔼 Trade: Buy XAUUSD upon a breakout and consolidation above 2038.00;
🎯Targets: 2048.00.
Smash ❤️ if you are bullish on XAUUSD!
➡️ TRADE WITH FBS
@fbsanalytics
🎯Targets: 2048.00.
Smash ❤️ if you are bullish on XAUUSD!
@fbsanalytics
Please open Telegram to view this post
VIEW IN TELEGRAM
❤94👍42🔥22❤🔥12👎11🍌8✍3🌚3🍾3⚡2
#TradeIdea
👉 🇨🇦 🇯🇵 🌠 👈 CADJPY goes down!
⚡️ On the H4, the CADJPY formed a rising wedge pattern and the price broke the trend line, overcoming the level of 110,600, corresponding to 100 Fibonacci.
🔽 Trade: Sell CADJPY
🎯 TP: 109.00
Hit 👍 if you agree with the analysis!
➡️ TRADE WITH FBS
@fbsanalytics
🎯 TP: 109.00
Hit 👍 if you agree with the analysis!
@fbsanalytics
Please open Telegram to view this post
VIEW IN TELEGRAM
👍60❤20🔥10✍6👎5🆒4❤🔥3🏆3🍾2💯1🦄1
FBS Analytics
🎉 Happy Birthday to FBS! Celebrate 15 years of trust with us – Join a Giveaway🎉 🔔 The FBS birthday giveaway!!! 📅 From February 14 till February 29 📌How to join: 1. Open an FBS account and subscribe to FBS Instagram page 2. Publish a post about your trading…
Tune in to our special anniversary stream and get invaluable insights from top trading experts. Click here to watch:
YouTube Stream - and don't forget to hit the bell icon to receive notifications and not miss out!
We're giving away 15 iPhones 15 Pro Max to celebrate our 15 years! Want to be one of the lucky winners? Visit our anniversary landing page:
Get Your iPhone and find out how you can enter the raffle
@fbsanalytics
Please open Telegram to view this post
VIEW IN TELEGRAM
❤63👍33🎉16🍾6⚡5✍4❤🔥4🐳3💘3🌭2🙏1
#TradeIdea
👉 🇻🇦 🇯🇵 👈 USDJPY Technical Analysis!
💸 USDJPY rebounded from the 38.2 Fibonacci and 149.600 levels now faced a 150.000 resistance level. Here are the possible scenarios for the asset's next move:
🔼 If USDJPY breaks through the 150.000 resistance, we will see an ascent to the 150.800 resistance level.
🔽 If a corrective move occurs, the asset's price might retreat to 149.600 or even 149.000.
❓ Do you expect a bullish or bearish move? Share in the comments.👇
➡️ TRADE WITH FBS
@fbsanalytics
@fbsanalytics
Please open Telegram to view this post
VIEW IN TELEGRAM
👍48❤19✍8🔥8🆒4❤🔥3😁2🍾2⚡1🌭1
#TradeIdea
👉 💡 ▶️ ⏩ GBPNZD Update!
👀 GBPNZD rose to the resistance area for the third time after a gradual downtrend, creating two possible scenarios.
🔼 If the price breaks and holds above the 2.0800 resistance this time, 2.0940 will be the target level
🔽 However, if GBPNZD bounces off the resistance, it will again fall to 2.0640 and 2.0510
❓ What do you think the GBPNZD is bullish or bearish today?
➡️ TRADE WITH FBS
@fbsanalytics
@fbsanalytics
Please open Telegram to view this post
VIEW IN TELEGRAM
👍32❤🔥22❤11🔥9⚡3🆒2🤣1
#Education
🔝Looking for a powerful strategy to boost your trading? Look no further! Introducing the Triple Top Strategy combined with Fibonacci retracement, a winning combination for identifying trend reversals and maximizing profits!
🏔The Triple Top pattern is a technical chart pattern that signals a potential trend reversal from bullish to bearish. It occurs when an asset's price reaches a resistance level three times, forming three consecutive peaks at nearly the same level. This pattern suggests buyers are struggling to increase prices, and sellers may take control soon.
📈But that's not all! By combining the Triple Top pattern with Fibonacci retracement, you can enhance your trading strategy even further. Fibonacci retracement is a powerful tool that helps identify potential support and resistance levels based on the Fibonacci sequence, a mathematical pattern in nature and financial markets.
⚠️Here's how you can use this powerful combination:
1️⃣ Identify an uptrend on the chart and notice a Triple Top pattern's formation.
2️⃣ Use Fibonacci retracement to draw retracement levels from the highest point.
3️⃣ Wait for the third peak to be confirmed after the price crosses 0.78 Fibo level.
4️⃣ Enter the market when the price breaks below the neckline of the Triple Top pattern and retests it.
5️⃣ Close your position when the price reaches the 1.61 Fibo level.
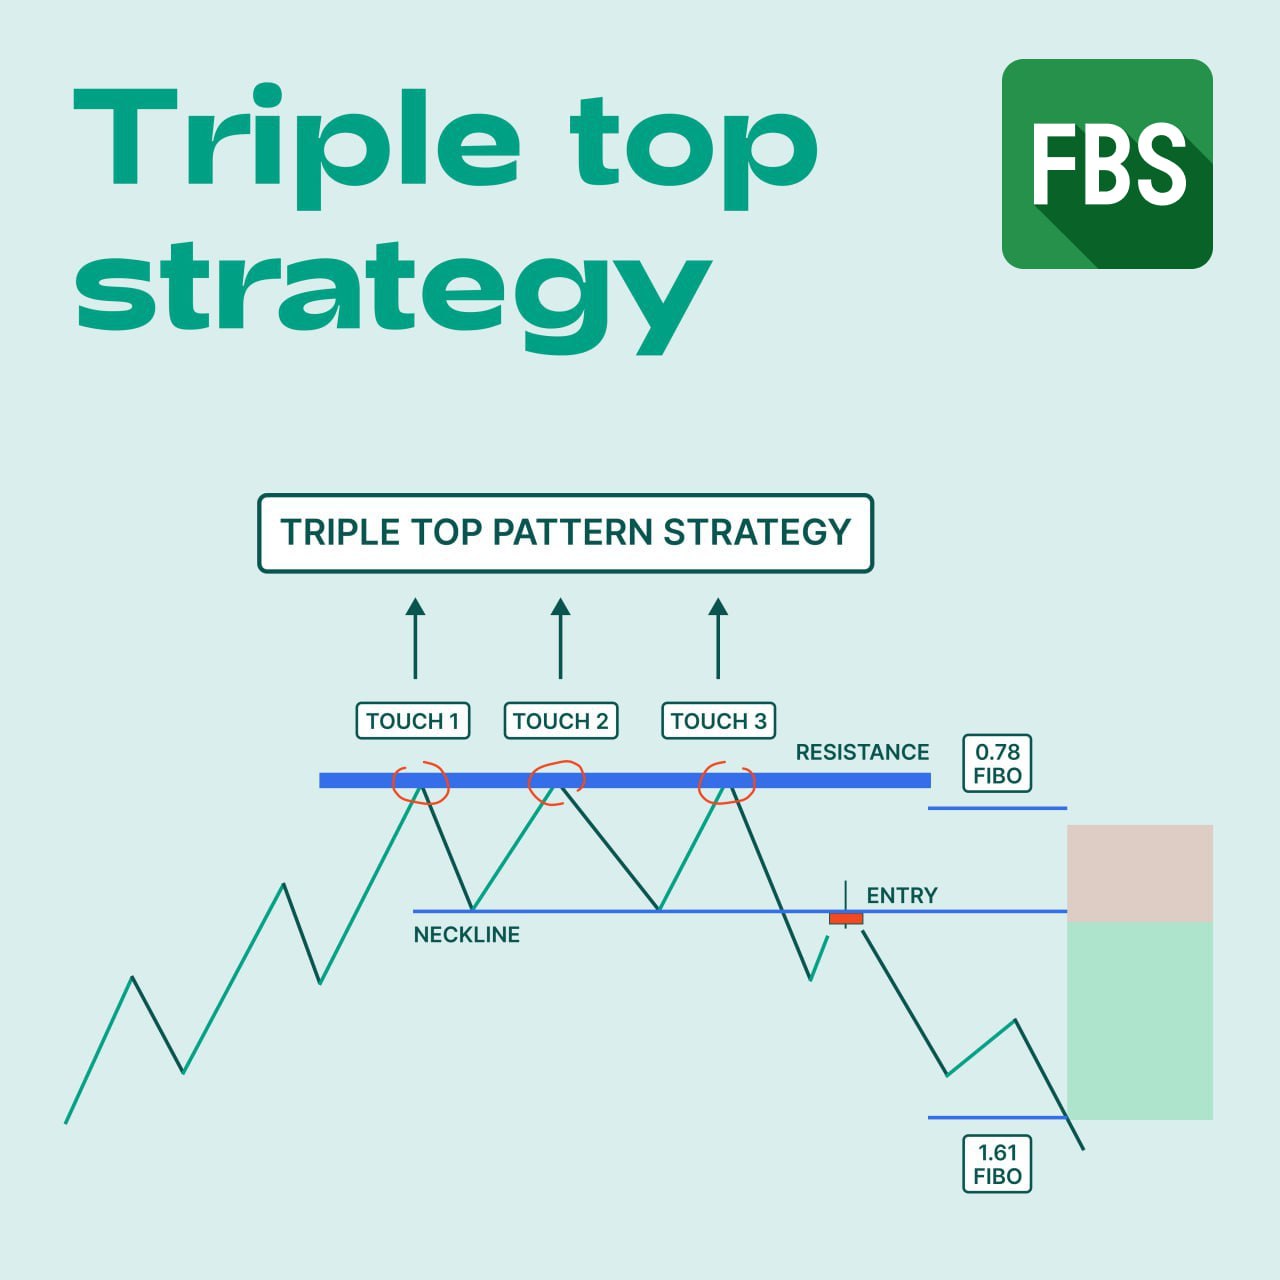
👍96❤21🔥19❤🔥11✍7💩4🎉3🌭2⚡1🌚1
#MarketNews
☀️ Happy Friday, dear traders! Look at the major news on this week's last trading session!
🇺🇸 Congress has approved temporary funding to prevent a partial US government shutdown, with measures extending funds for specific departments until March 8 and others until March 22 while longer-term funding agreements are negotiated.
🇨🇳 Industrial activity in China slows down as weak demand hinders growth, with the manufacturing PMI contracting for the fifth consecutive month in February and mixed data indicating an uneven recovery.
💬 UBS analysts predict a 20% increase in the S&P 500 index in 2024, partially due to the impact of generative artificial intelligence technology.
🔥 Microsoft (#MICROSOFT) introduced an AI chatbot designed for financial professionals capable of working with Excel spreadsheets and the Outlook email manager. The stock is up 1.45%.
🥇 Gold is set for its highest close in a month, trading above $2,046 an ounce, following the Federal Reserve's inflation report that aligns with expectations, suggesting the possibility of interest rate cuts later this year.
⚡️ Deutsche Bank (#DBK) intends to file a lawsuit in Hong Kong to liquidate Chinese real estate developer Shimao Group over unacceptable debt restructuring terms. The bank shares are down 0.27% today.
📌 OpenAI, the creator of ChatGPT, plans to appoint new board members in March, ending a stalemate since the brief firing of CEO Sam Altman, as it seeks experts in technology, safety, and policy.
🇯🇵 Japan's tight labor market, with the unemployment rate dropping to its lowest in four years at 2.4%, continues to exert intense upward pressure on wages as companies negotiate annually with labor unions.
🇸🇪 Swedish bankruptcies surged by 62% in February, marking the worst month in three decades since the early 1990s financial crisis, impacting sectors like hotels, restaurants, and construction most severely.
❓ What trades are you eyeing today? Share in the comments 👇
➡️ TRADE WITH FBS
@fbsanalytics
@fbsanalytics
Please open Telegram to view this post
VIEW IN TELEGRAM
👍51❤17🔥12✍3❤🔥3🆒2🤩1
#TradeIdea
👉 🇪🇺 🇻🇦 👈 EURUSD Opportunity!
👀 EURUSD is currently testing the golden Fibonacci ratio and 1.0810 support level. Let's explore potential price move:
🔼 A rebound from the 1.0810 level will push the price to 1.0860.
🔽 Conversely, a breach below the support will drop the asset to 1.0770.
❓ Are you bullish or bearish on EURUSD? Share in the comments 👇
➡️ TRADE WITH FBS
@fbsanalytics
@fbsanalytics
Please open Telegram to view this post
VIEW IN TELEGRAM
👍59🔥12❤10❤🔥4💯2🌚1🌭1
#TradeIdea
👉 🇪🇺 🇨🇦 👈 EURCAD Outlook!
⚡️ EURCAD has formed an ascending channel pattern, and price tests the resistance area corresponding to 38.2 Fibonacci. Two scenarios are possible since the price has already failed to overcome this level several times.
🔼 If the bulls push the price above the resistance area of 1.4700, we can expect the price to rise to 1.4830
🔽 Otherwise, if the price breaks the lower trendline and falls below the support at 1.4660, the target will be the 1.4570 level
❓ What do you think the EURCAD is bullish or bearish today? Share your opinion in the comments👇
➡️ TRADE WITH FBS
@fbsanalytics
@fbsanalytics
Please open Telegram to view this post
VIEW IN TELEGRAM
👍54❤🔥10✍6❤6🔥6💯2🆒2👏1🌭1
#TradeIdea
👉 💵 🇻🇦 👈 XBRUSD Technical Analysis!
🕯 On the H1, Brent has been in a sideways trend for a long time, and now the price has reached the upper boundary.
🔼 If XBRUSD overcomes the resistance at 83.00, the Target profit will be 84.30
🔽 A rebound from the resistance will bring the price back to the lower level of the sidewall at 80.80
🧐 Are you on the bullish or bearish side?
➡️ TRADE WITH FBS
@fbsanalytics
@fbsanalytics
Please open Telegram to view this post
VIEW IN TELEGRAM
👍44❤12⚡6🔥4✍3👏3❤🔥2🎉2