As the market remains mostly calm due to the US holiday and the absence of significant releases, we recommend you to take a look at the trade idea for EUR/NZD.
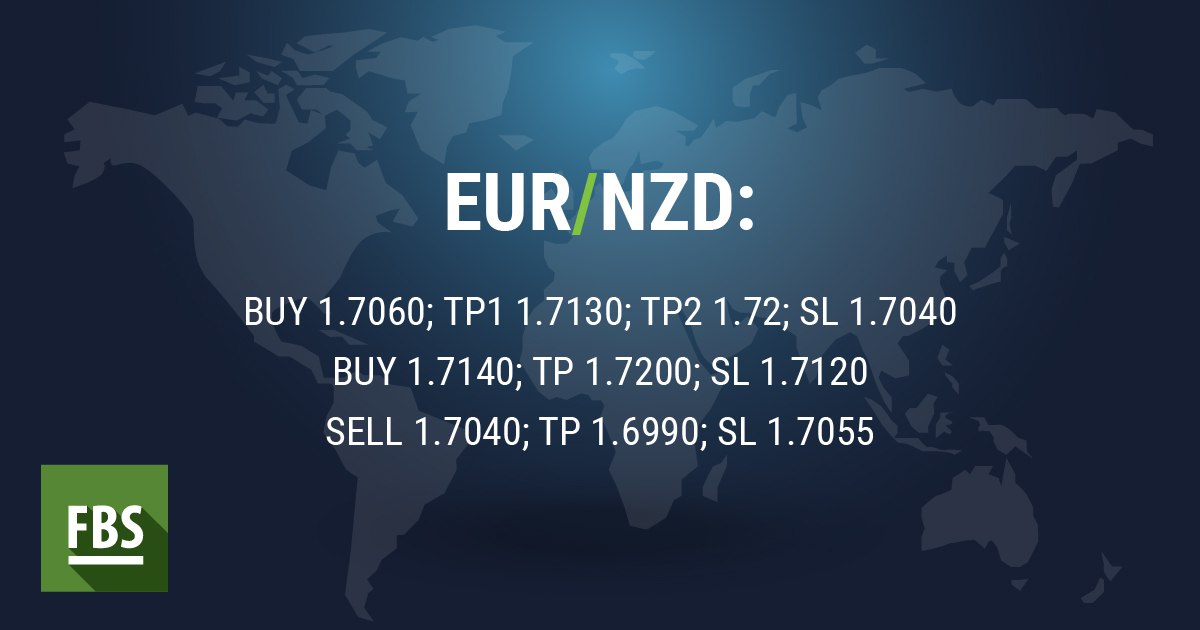
⚪ The pair’s been in an uptrend since the end of March. Last week, it reached resistance around 1.72 (January high) and then turned down forming a doji with a longer upper wick on W1.
⚪ It means that the air will likely test the uptrend support line at 1.7065/50 in the short-term. If the pair manages to rebound from this level, it will get a chance to revisit 1.7200. Conservative buyers may enter above 1.7140. However, the ADX indicator shows that the uptrend is losing strength. Still, as long as the trend is intact there are bigger odds that it will continue. A decline below 1.7050 will open the way down to 1.6990 (50-week MA) and probably 1.6925 (200-day MA).
⚪ The pair’s been in an uptrend since the end of March. Last week, it reached resistance around 1.72 (January high) and then turned down forming a doji with a longer upper wick on W1.
⚪ It means that the air will likely test the uptrend support line at 1.7065/50 in the short-term. If the pair manages to rebound from this level, it will get a chance to revisit 1.7200. Conservative buyers may enter above 1.7140. However, the ADX indicator shows that the uptrend is losing strength. Still, as long as the trend is intact there are bigger odds that it will continue. A decline below 1.7050 will open the way down to 1.6990 (50-week MA) and probably 1.6925 (200-day MA).
The EU faces many problems nowadays. While others keep criticizing the ineffective policy of Theresa May or Jean-Claude Juncker, we suggest you take a look at the game by Bloomberg and make your decisions as a leader of the EU country.
Will you make Europe great again? 😏
Will you make Europe great again? 😏

Crypto goes up
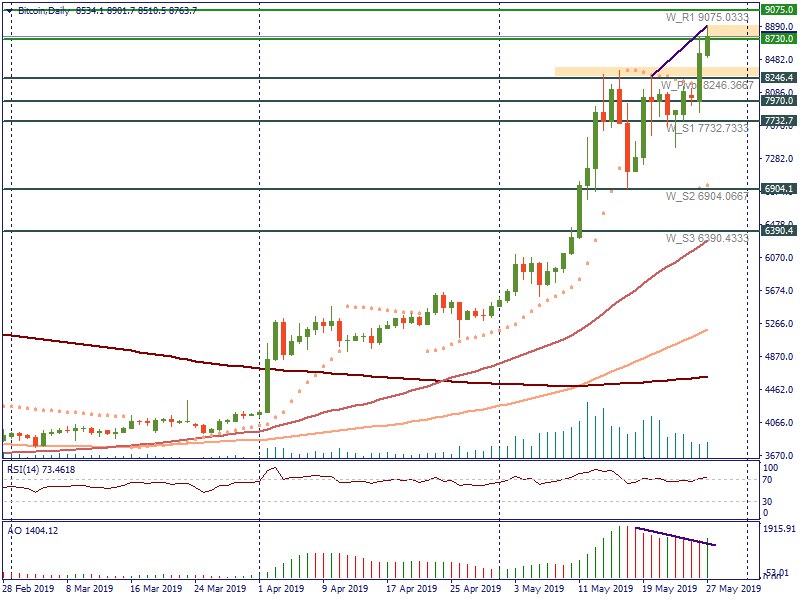
🙌 The bullish optimism in the crypto market continues. At the moment, Bitcoin is testing the resistance at $8,730. A successful break of this level will help bulls to test the next resistance at $9,075.
〰 However, according to oscillators,the bullish pressure is at risk. RSI has entered the overbought zone. At the same time, there is a bearish divergence with the Awesome oscillator and volumes. It may signal a possible reversal. The return of the bearish pressure will pull the digital asset back to the support at $8,246.
🙌 The bullish optimism in the crypto market continues. At the moment, Bitcoin is testing the resistance at $8,730. A successful break of this level will help bulls to test the next resistance at $9,075.
〰 However, according to oscillators,the bullish pressure is at risk. RSI has entered the overbought zone. At the same time, there is a bearish divergence with the Awesome oscillator and volumes. It may signal a possible reversal. The return of the bearish pressure will pull the digital asset back to the support at $8,246.
Tuesday feels better when you know what to trade 💥
FBS Analytical Department shares with you some great ideas on trading this week!
This week's outlook will bring you:
🔸 The important releases for the AUD, the NZD, and the USD;
🔸 The date of the BOC monetary policy decision;
🔸 Key levels of the AUD/USD, NZD/USD and USD/CAD pairs;
...and even more!
Click below to watch the video!▶
FBS Analytical Department shares with you some great ideas on trading this week!
This week's outlook will bring you:
🔸 The important releases for the AUD, the NZD, and the USD;
🔸 The date of the BOC monetary policy decision;
🔸 Key levels of the AUD/USD, NZD/USD and USD/CAD pairs;
...and even more!
Click below to watch the video!▶
YouTube
Weekly Market Outlook: May 27-31, 2019
Let’s consider the events in the market for this week. On Monday, the bank of Japan governor will make his speech. On Tuesday, you need to pay attention to t...
❗ One of the main things Forex trading has taught us is to never underestimate the risks.
Let's face it: Forex trading is risky and requires a lot of practice.
Would you like to know how to avoid these risks? Click below and watch the video!
Let's face it: Forex trading is risky and requires a lot of practice.
Would you like to know how to avoid these risks? Click below and watch the video!
🐘 The South African currency has weakened on Tuesday. As a result, the USD/ZAR pair has tested its March’s highs near the 14.63 level. Let's find out the reasons ▶
Telegraph
What weakens the South African Rand?
The South African currency has weakened on Tuesday. As a result, the USD/ZAR pair has tested its March’s highs near the 14.63 level. What are the reasons? · One of the main reason has political roots. Cyril Ramaphosa, the recently chosen president…
We haven’t heard a lot about the Singapore dollar. Until today.
⛔ The US Treasury added Singapore to a watchlist for currency manipulation. The reasons behind this decision lie in the larger account surplus and net foreign currency purchases of around $17 billion in 2018, which equals to 4.6% of GDP. At the same time, the US Treasury avoided calling China a currency manipulator thus did not allow the further escalation of the US-China trade war.
✖ After that, the Monetary Authority of Singapore commented that it does not engage in currency manipulation.
📈 The USD/SGD pair has tested the resistance at 1.3819 since the beginning of the trading day. The next resistance lies at 1.3858. If the MAS takes measures to support its currency, the pair may fall back below the 1.38 level to the support at the central pivot at 1.3772. If we look at indicators, RSI entered the overbought zone and we can see its bearish divergence with the price. It may signal a possible reversal soon.
⛔ The US Treasury added Singapore to a watchlist for currency manipulation. The reasons behind this decision lie in the larger account surplus and net foreign currency purchases of around $17 billion in 2018, which equals to 4.6% of GDP. At the same time, the US Treasury avoided calling China a currency manipulator thus did not allow the further escalation of the US-China trade war.
✖ After that, the Monetary Authority of Singapore commented that it does not engage in currency manipulation.
📈 The USD/SGD pair has tested the resistance at 1.3819 since the beginning of the trading day. The next resistance lies at 1.3858. If the MAS takes measures to support its currency, the pair may fall back below the 1.38 level to the support at the central pivot at 1.3772. If we look at indicators, RSI entered the overbought zone and we can see its bearish divergence with the price. It may signal a possible reversal soon.

Let's consider the trading of Apple stocks.
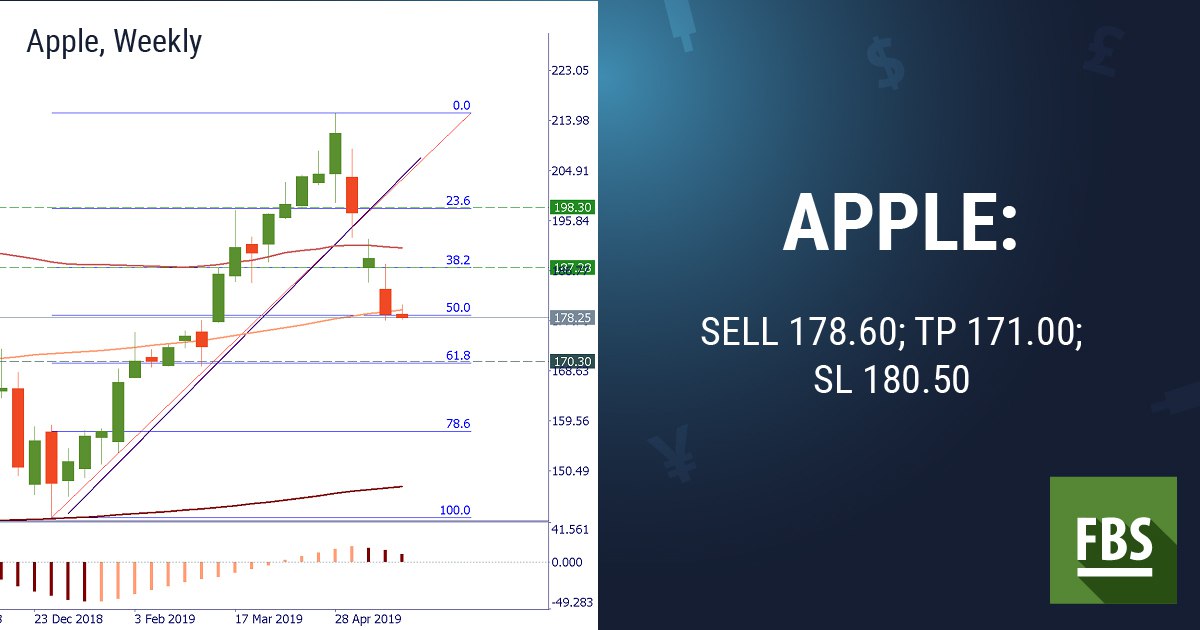
🍏 There’s a way to bet on the increase in trade tensions between the United States and China that goes beyond the currency market. This way is to sell the stock of Apple Inc. as China is a big market for Apple, and the firm may be one of the main victims if China retaliates against American companies.
📉 As you can see from the chart, its price is in a downfall since the end of April. The decline has erased 50% of gains made earlier this year.
🍏 There’s a way to bet on the increase in trade tensions between the United States and China that goes beyond the currency market. This way is to sell the stock of Apple Inc. as China is a big market for Apple, and the firm may be one of the main victims if China retaliates against American companies.
📉 As you can see from the chart, its price is in a downfall since the end of April. The decline has erased 50% of gains made earlier this year.
#DIDYOUKNOWTHAT
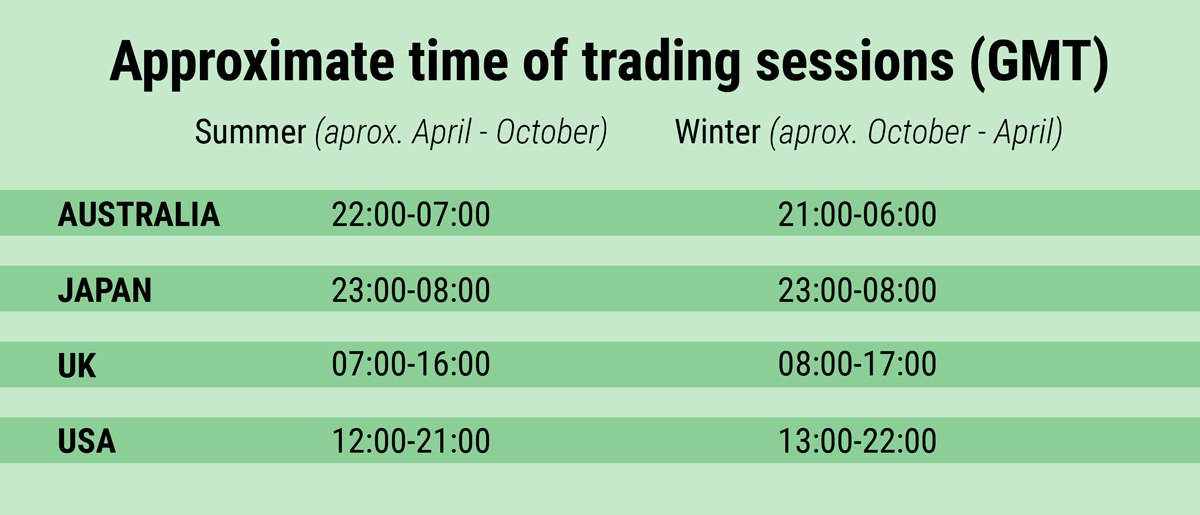
🕜🕑🕝 The FX market is open 24 hours a day, 5 days a week. There are trading sessions which correspond to the time during which stock markets are open in a particular region of the world. Usually, trade volume is higher at the intersection of the sessions.
🕜🕑🕝 The FX market is open 24 hours a day, 5 days a week. There are trading sessions which correspond to the time during which stock markets are open in a particular region of the world. Usually, trade volume is higher at the intersection of the sessions.
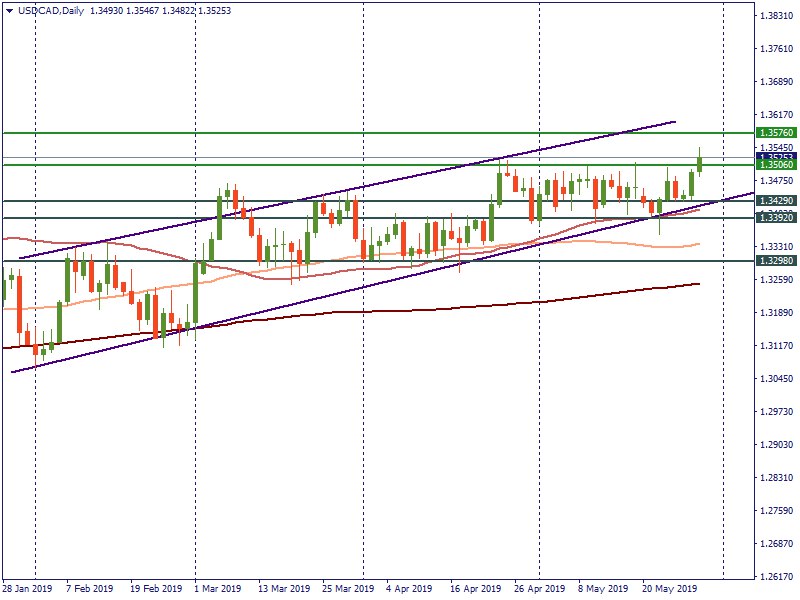
The Bank of Canada announces no changes to its interest rate, USD/CAD rises.
🔴 During today's meeting, the Bank of Canada kept its interest rate unchanged at 1.75%. At the same time, the bank commented that economic data came in line with the projections. However, the market anticipated more hawkish tone. As a result, the Canadian dollar weakened. USD/CAD has tested last January's levels above the resistance zone at 1.3506. The next resistance lies at 1.3576. Bears need to pull the price below the 1.3506 level to the support at 1.3429 to confirm their strength.
🔴 During today's meeting, the Bank of Canada kept its interest rate unchanged at 1.75%. At the same time, the bank commented that economic data came in line with the projections. However, the market anticipated more hawkish tone. As a result, the Canadian dollar weakened. USD/CAD has tested last January's levels above the resistance zone at 1.3506. The next resistance lies at 1.3576. Bears need to pull the price below the 1.3506 level to the support at 1.3429 to confirm their strength.
❗ Last week the European elections kept the euro traders very cautious. The risks that Eurosceptics would gain more votes than other parties weakened the European currency and the European stocks.
🔹 Despite the prevalence of the pro-European parties, the situation did not become any brighter after the elections as a lot of factors put additional pressure on the Eurozone. As a result, the EUR retested the 1.1136 level on Wednesday and the DAX tested the levels below its April’s lows at 11,850.
Continue to read: ➡
🔹 Despite the prevalence of the pro-European parties, the situation did not become any brighter after the elections as a lot of factors put additional pressure on the Eurozone. As a result, the EUR retested the 1.1136 level on Wednesday and the DAX tested the levels below its April’s lows at 11,850.
Continue to read: ➡
Telegraph
Europe is under pressure
Last week the European elections kept the euro traders very cautious. The risks that Eurosceptics would gain more votes than other parties weakened the European currency and the European stocks. Despite the prevalence of the pro-European parties, the situation…
The market is cautiously awaiting the release of Chinese Manufacturing PMI 🇨🇳
👉 As China is one of the biggest economies in the world, its data tends to affect the global markets. As a result, higher figures of the indicator affect positively not only the Chinese yuan but also the risk sentiment in the market. Riskier environment increases the demand on the risk-weighted currencies, such as the AUD, the NZD, and the emerging market currencies.
👉 As China is one of the biggest economies in the world, its data tends to affect the global markets. As a result, higher figures of the indicator affect positively not only the Chinese yuan but also the risk sentiment in the market. Riskier environment increases the demand on the risk-weighted currencies, such as the AUD, the NZD, and the emerging market currencies.

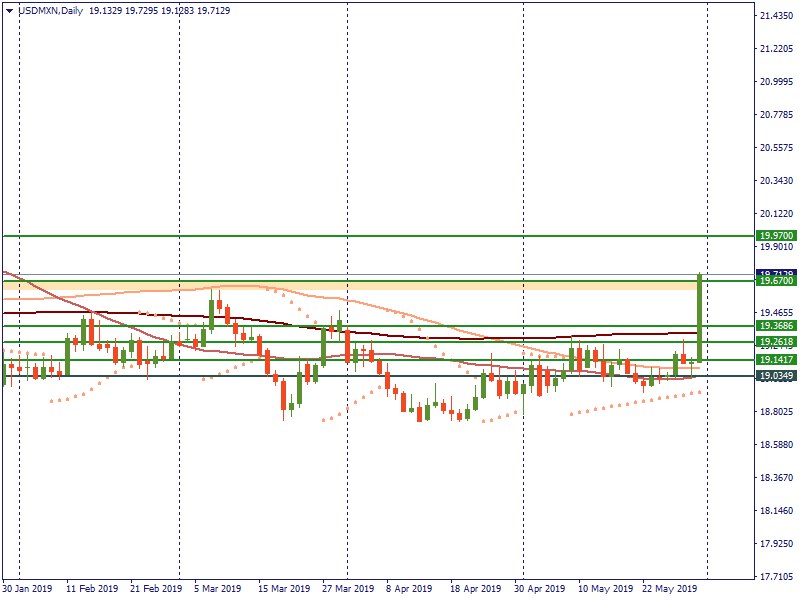
❗ Tariff man has done it again. The USD/MXN breaks above the 19.67 level on tariff threats
🔻 President Donald Trump announced the 5% tariffs on Mexican goods until the country stops immigrants from entering the US. The tariffs will be applied on June 10. The tariffs could rise to 25% on October 1.
🔻 The USD/MXN has risen above the resistance at 19.67. The next resistance lies at 19.97. On the flipside, bears need to pull the pair below the 19.3686, 19.2618 and 19.1417 pivot levels to take back their strength. The support lies at 19.0349.
🔻 President Donald Trump announced the 5% tariffs on Mexican goods until the country stops immigrants from entering the US. The tariffs will be applied on June 10. The tariffs could rise to 25% on October 1.
🔻 The USD/MXN has risen above the resistance at 19.67. The next resistance lies at 19.97. On the flipside, bears need to pull the pair below the 19.3686, 19.2618 and 19.1417 pivot levels to take back their strength. The support lies at 19.0349.
❗ Risk aversion persists and so far there are no signs that the situation will improve.
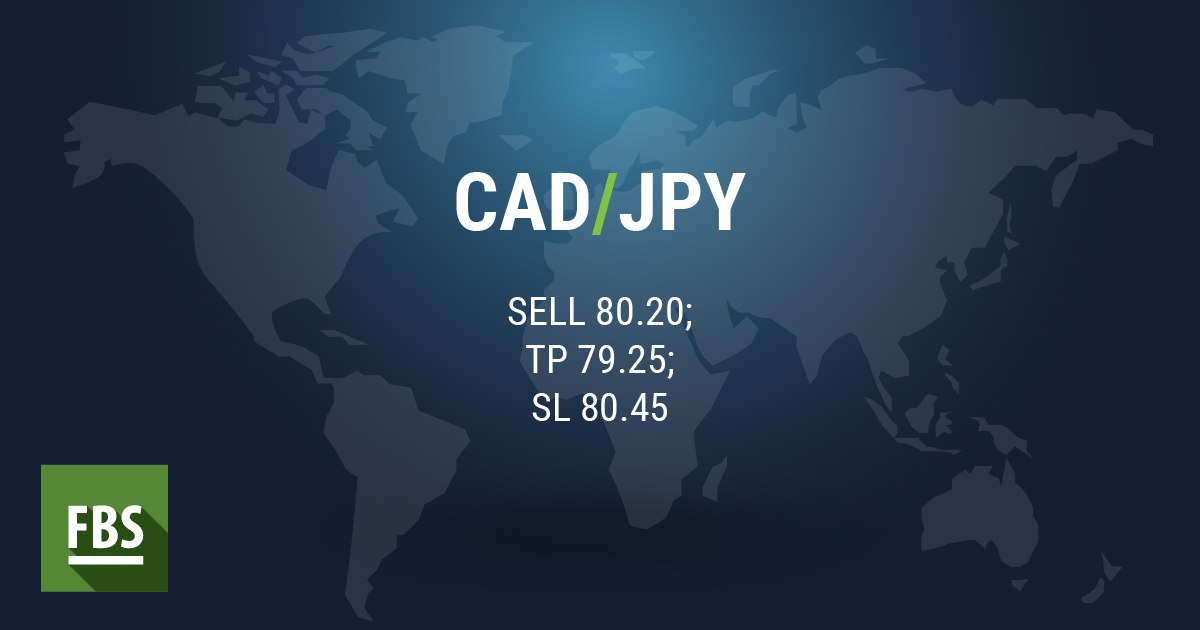
〰 CAD/JPY is a natural pick for trading in this kind of environment.
🔻 The pair is testing levels below 80.50 - the area that limited the decline in 2017 and 2018. The downtrend continues as we witness the series of lower highs on the chart.
〰 CAD/JPY is a natural pick for trading in this kind of environment.
🔻 The pair is testing levels below 80.50 - the area that limited the decline in 2017 and 2018. The downtrend continues as we witness the series of lower highs on the chart.
👉 Not only is Alexander Elder known for his triple screen trading system, but he also gave traders some really good advice on psychology, risk and money management. In the article, we gathered the most useful recommendations from Elder’s renowned book “Trading for a living”.
Do you agree with his words ❓
Do you agree with his words ❓

Oil prices gap down on the negative economic concerns. ⬇
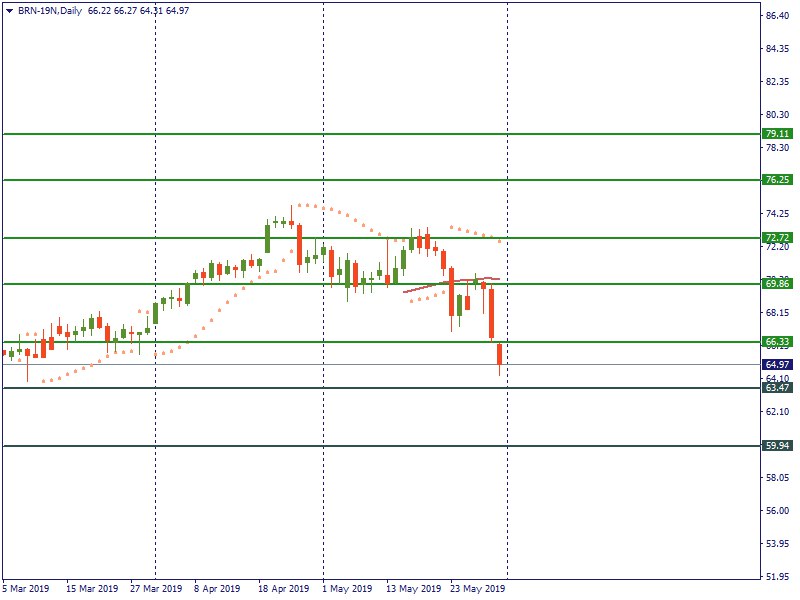
The global risk aversion drove the prices for WTI and Brent down.
⛽ The price for WTI has fallen below the weekly pivot at $56.23. The next key level lies at $53.47. If bulls take over the market, the price for WTI will rise above the $56.23 level to the next resistance at $60.08.
⛽ As for the price for Brent, it jumped below the $66.33 level. The first support for bears is placed at 63.47. On the flipside, if buyers are strong enough to break the $66.33 level, the next resistance will be placed at $69.86.
The global risk aversion drove the prices for WTI and Brent down.
⛽ The price for WTI has fallen below the weekly pivot at $56.23. The next key level lies at $53.47. If bulls take over the market, the price for WTI will rise above the $56.23 level to the next resistance at $60.08.
⛽ As for the price for Brent, it jumped below the $66.33 level. The first support for bears is placed at 63.47. On the flipside, if buyers are strong enough to break the $66.33 level, the next resistance will be placed at $69.86.
👀 Haven't heard about crypto for the last couple of days? Let's find out why! ↘
Telegraph
Cryptonews on May 27-31, 2019
Michael Novogratz, the founder of Galaxy Digital: "We have gone from, you know, crypto as an experiment, is it real? Is it tulips? Crypto is going to be a substantial part of the financial and consumer infrastructure of the world." Bulls finally gave up their…
Good trade idea for the start of your trading week, check it out! 🙌
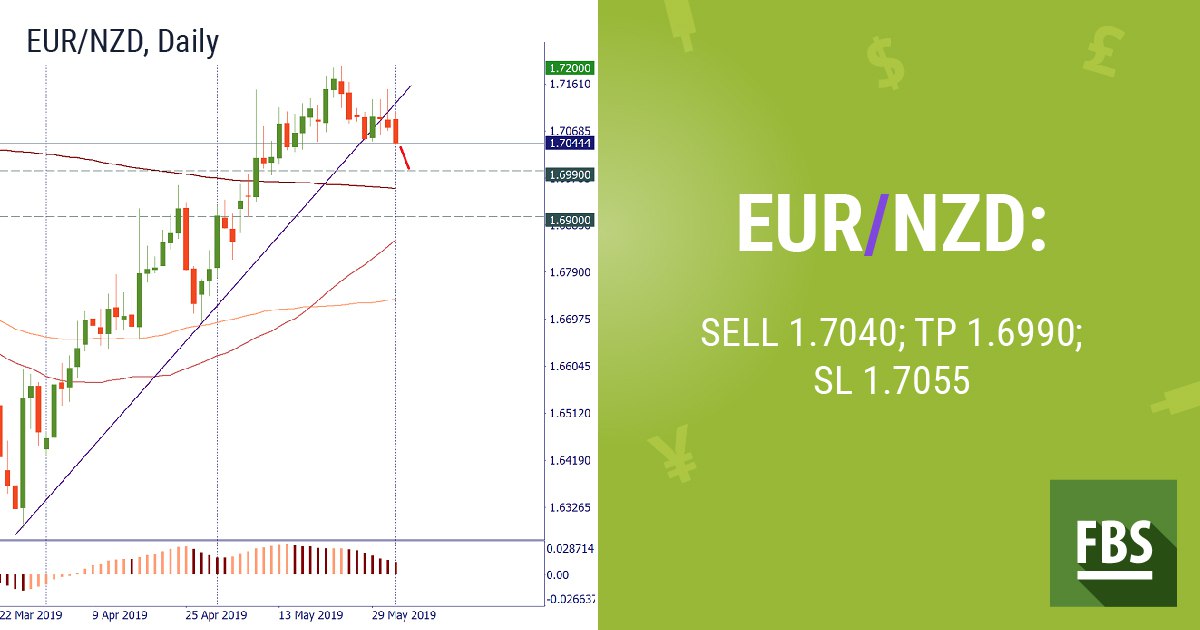
📉Last week it looked like EUR/NZD may test the uptrend which still remains strong. Now we are much more certain that the pair will test lower levels.
➡ Have a look at the bearish candlestick with a long upper wick formed on D1 - it’s sending a clear negative signal. Add the fact that on H4 we clearly see a lower high and a potential “Head and Shoulders” pattern.
📉Last week it looked like EUR/NZD may test the uptrend which still remains strong. Now we are much more certain that the pair will test lower levels.
➡ Have a look at the bearish candlestick with a long upper wick formed on D1 - it’s sending a clear negative signal. Add the fact that on H4 we clearly see a lower high and a potential “Head and Shoulders” pattern.
What are the main market movers for this week?
💵 Rate statement by the Reserve bank of Australia (Tue, 7:30 MT (4:30 GMT)) – We anticipate a rate cut from 1.5% to 1.25%. The main reasons behind this decision lie in the intensifying trade tensions between the US and China and the slowdown of inflation. The rate cut is already priced in, that is why it is important to pay attention to the hints on the further decision by the RBA governor Philip Lowe.
💵 The monetary policy statement by the European central bank (Thu, 14:45 MT (11:45 GMT)) – During this meeting, the rate cut is not expected, but we will focus on the speech by the ECB president Mario Draghi. If he provides positive comments on the outlook of the Eurozone, despite the global pressure, the EUR will rise.
💵 Canadian trade balance (Thu, 15:30 MT (12:30 GMT)) - Higher-than-expected figures will be positive for the CAD.
💵 NFP (Fri, 15:30 MT (12:30 GMT)) – According to the forecasts, the level of non-farm payrolls will advance by 180 thousand jobs. Higher figures will be good for the USD.
💵 Canadian jobs data (15:30 MT (12:30 GMT)) – If the actual level of employment change is higher and the unemployment rate is lower than the forecasts, the CAD will go up.
💵 Rate statement by the Reserve bank of Australia (Tue, 7:30 MT (4:30 GMT)) – We anticipate a rate cut from 1.5% to 1.25%. The main reasons behind this decision lie in the intensifying trade tensions between the US and China and the slowdown of inflation. The rate cut is already priced in, that is why it is important to pay attention to the hints on the further decision by the RBA governor Philip Lowe.
💵 The monetary policy statement by the European central bank (Thu, 14:45 MT (11:45 GMT)) – During this meeting, the rate cut is not expected, but we will focus on the speech by the ECB president Mario Draghi. If he provides positive comments on the outlook of the Eurozone, despite the global pressure, the EUR will rise.
💵 Canadian trade balance (Thu, 15:30 MT (12:30 GMT)) - Higher-than-expected figures will be positive for the CAD.
💵 NFP (Fri, 15:30 MT (12:30 GMT)) – According to the forecasts, the level of non-farm payrolls will advance by 180 thousand jobs. Higher figures will be good for the USD.
💵 Canadian jobs data (15:30 MT (12:30 GMT)) – If the actual level of employment change is higher and the unemployment rate is lower than the forecasts, the CAD will go up.
📢 Gold rallies further
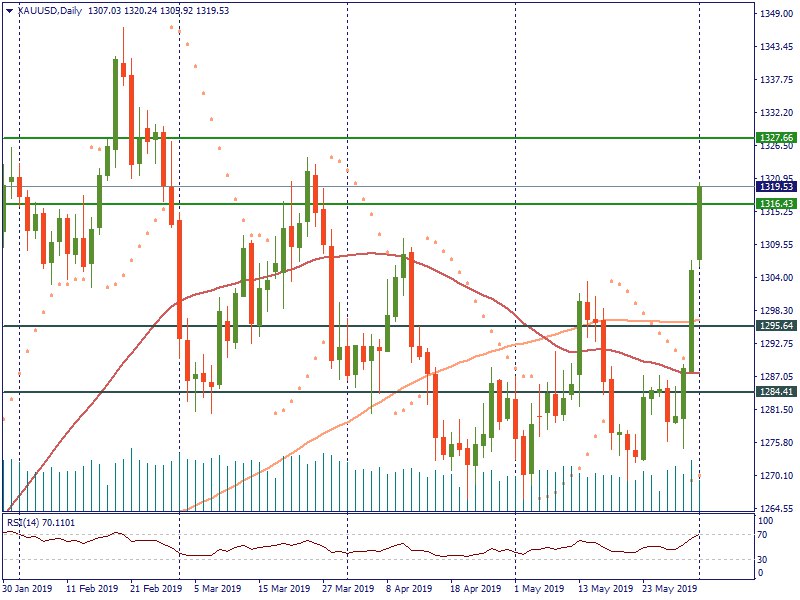
The risk aversion in the market does not become any softer. As a result, the positive momentum for gold continues. At the moment the price for the yellow metal is trying to stick above the weekly pivot resistance at $1,316. The next key level lies at $1,328. Bears need to pull the price to the support at $1,295 to confirm their strength.
The risk aversion in the market does not become any softer. As a result, the positive momentum for gold continues. At the moment the price for the yellow metal is trying to stick above the weekly pivot resistance at $1,316. The next key level lies at $1,328. Bears need to pull the price to the support at $1,295 to confirm their strength.