👨🦳👵 🇬🇧The United Kingdom in much worse demographic shape than the US or Australia. There’s a massive cohort born from 1960-1971 that is starting to enter retirement. The cohort replacing them is much smaller. UK is trying to remedy this with immigration. Canada scenario awaits them.
😭10👍3🥰1
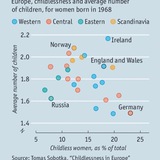
Demographics Now and Then
👨🦳👵 🇬🇧The United Kingdom in much worse demographic shape than the US or Australia. There’s a massive cohort born from 1960-1971 that is starting to enter retirement. The cohort replacing them is much smaller. UK is trying to remedy this with immigration.…
The “Canada Scenario” is one under which massive levels of immigration are used to make up for falling births. All this accomplishes is kicking the can down the road and causing even more pension problems when said immigrants retire.
👍9🥰1😁1
Between 1963-1983 Thailand had more than 1 million births per year every year. Since then births have plummeted & have been below 600K annually since 2020. Not as bad a demographic situation as Korea or Taiwan but it’s getting there(& Thailand is far less wealthy than either).
🔥6😁2🥰1
🇦🇷💰👶Many forget that a century ago Argentina had a higher per capita GDP than most European countries (including Germany, France or Italy). The post 1945 period has not been kind to Argentina & now its demographics (formerly a bright spot) have also taken a turn for the worse with TFR⬇️1.5.
🔥12😁1
Forwarded from /CIG/ Telegram | Counter Intelligence Global (Fren Bobbie)
🇺🇸🇲🇽✝️ The secularization of American Latinos has been incredibly swift. In 2010 67% of US Latinos identified as Catholic & at least 84% as Christian. By 2022 only 43% identified as Catholics & only around 2/3rds identified as Christian.
⚫️ Among young American Latinos/Hispanics irreligiously is even more pronounced. Half (49%) of Latinos aged 18-29 are religiously unaffiliated. English dominant Latinos are also far more likely to be unaffiliated than those who are Spanish dominant. Not huge partisan difference though.
⚫️ This will have an obvious & continuing impact on American Hispanic fertility in the decades to come. US born Hispanics will see TFR fall to current Non Hispanic White levels of around 1.5-1.57. Foreign born Hispanic TFR will move to between 1.8-2.2
📎 Aaronal16
😢8😁4🤯4👏1
Forwarded from /CIG/ Telegram | Counter Intelligence Global (FRANCISCVS)
✝️ 🇺🇸 🐣 The impact of religion on fertility is amazing | Louise Perry
⬛️ Something I learnt today:
🔶️ American Catholics in general have a total fertility rate of 2.3.
🔶️ But American Catholics who attend Latin Mass have a TFR of 3.6! More than TWICE the national average!
📎 Louise Perry
⬛️ Something I learnt today:
🔶️ American Catholics in general have a total fertility rate of 2.3.
🔶️ But American Catholics who attend Latin Mass have a TFR of 3.6! More than TWICE the national average!
📎 Louise Perry
❤20🔥3😁2😱2👍1
Demographics Now and Then
High rates of childlessness does not necessarily equal lower fertility rates. Eastern Europe had much lower rates of childlessness than Western Europe yet places like Ireland (with one of the highest rates of childlessness in Europe)have some of Europe’s…
In East Asia the link between high childlessness and lower TFR is much more direct. As you can see childlessness in Hong Kong, Japan & Singapore are higher than anywhere in Europe and the graphs on the right show South Korea & Taiwan will probably overtake them.
🔥10
Unlike most of Europe (where some countries did not even enjoy any true postwar baby boom at all) the United States was blessed with not 1 but 2 baby boom sized cohorts. The 1st from 1946-1964. The 2nd Gen Z from 1997-2012 (lower TFR but huge # of births). There will almost certainly not be a third. While births may very well rebound to the 3.7-3.9 million range it is highly doubtful that America will have any more near decade long stretches of 4M plus births. If very lucky the US will keep TFR above 1.5. This is said not out of pessimism but rather out of recognition of the data.
👍7
Marriage numbers have crashed across East Asia. This is crucially important as less than 5% of births are outside of wedlock in South Korea,Taiwan & Japan. The % is also low in China. This differs sharply with Europe & North America where ~40% or more of births are outside marriage.
🔥11🤔4❤2
Czechia births: The drop, which started in 2022,continues. Only 69,219 births were recorded from January to September 2023 against the same period last year. A stunning 11% year on year fall. After hitting just 101,299 in 2022, births in 2024 will be ⬇️100K for the 1st time since 2004. TFR is likely to fall below 1.45.
😢12😁2