Liquidity Heatmap
@LiquidityHeatmap
2.74K
subscribers
681
photos
Liquidity/Orderbook Heatmap
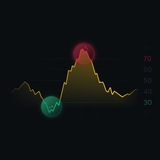
Liquidity Heatmap displays the intensity or density of buy and sell orders at different price levels within a given time frame.
Download Telegram
Join
Liquidity Heatmap
2.74K subscribers
Liquidity Heatmap
🟡
Yellow -> High Liquidity Level
@LiquidityHeatmap
Liquidity Heatmap
🟡
Yellow -> High Liquidity Level
@LiquidityHeatmap
Liquidity Heatmap
🟡
Yellow -> High Liquidity Level
@LiquidityHeatmap
Liquidity Heatmap
🟡
Yellow -> High Liquidity Level
@LiquidityHeatmap
Liquidity Heatmap
🟡
Yellow -> High Liquidity Level
@LiquidityHeatmap
Liquidity Heatmap
🟡
Yellow -> High Liquidity Level
@LiquidityHeatmap
Liquidity Heatmap
🟡
Yellow -> High Liquidity Level
@LiquidityHeatmap
Liquidity Heatmap
🟡
Yellow -> High Liquidity Level
@LiquidityHeatmap
Liquidity Heatmap
🟡
Yellow -> High Liquidity Level
@LiquidityHeatmap
Liquidity Heatmap
🟡
Yellow -> High Liquidity Level
@LiquidityHeatmap
Liquidity Heatmap
🟡
Yellow -> High Liquidity Level
@LiquidityHeatmap
Liquidity Heatmap
🟡
Yellow -> High Liquidity Level
@LiquidityHeatmap
Liquidity Heatmap
🟡
Yellow -> High Liquidity Level
@LiquidityHeatmap
Liquidity Heatmap
🟡
Yellow -> High Liquidity Level
@LiquidityHeatmap
Liquidity Heatmap
🟡
Yellow -> High Liquidity Level
@LiquidityHeatmap
Liquidity Heatmap
🟡
Yellow -> High Liquidity Level
@LiquidityHeatmap
Liquidity Heatmap
🟡
Yellow -> High Liquidity Level
@LiquidityHeatmap
Liquidity Heatmap
🟡
Yellow -> High Liquidity Level
@LiquidityHeatmap
Liquidity Heatmap
🟡
Yellow -> High Liquidity Level
@LiquidityHeatmap
Liquidity Heatmap
🟡
Yellow -> High Liquidity Level
@LiquidityHeatmap