
BCH
ETH
MATIC \ EOS \ ADA \ TRX
BTC \ BNB
LTC \ XRP
SOL
➗ ➗ ➗ ➗ ➗ ➗ ➗ ➗ ➗ ➗ ➗
BCH
ETH
MATIC \ EOS \ ADA \ TRX
BTC \ BNB
.
LTC \ XRP
SOL
під тиском продавця. Очікую ще один імпульс вниз.
ETH
після дводенного даунмуву спробував перейти в корекцію, але є ознаки слабкості покупця. На разі не дуже цікава ціна для продажів, а для покупок немає підтвердження.
MATIC \ EOS \ ADA \ TRX
під контролем продавця, може бути ще продовження руху вниз. Але слідкуємо за пробоєм супротиву, бо буде лонг сетап.
BTC \ BNB
формується цікавий об'єм, але виглядає не завершеним. На разі ситуація не дуже зрозуміла.
LTC \ XRP
Сформувався об'єм здатний розвернути тренд. Але може і продовжити, тому спостерігаємо за розвитком.
SOL
у широкому флеті, тому тут треба чекати хто переможе і після цього діяти.
BCH
is under pressure from the seller. I expect another downward impulse.
ETH
after a two-day downmove, tried to move into correction, but there are signs of buyer weakness. At the moment, the price is not very interesting for sales, and there is no confirmation for purchases.
MATIC \ EOS \ ADA \ TRX
under the control of the seller, there may be a continuation of the downward movement. But we are watching for a breakout of resistance, as there will be a long setup.
BTC \ BNB
an interesting volume is forming, but it does not look complete. The situation is not very clear at the moment
.
LTC \ XRP
The formed volume is capable of reversing the trend. But it can also continue, so we are watching the development.
SOL
is in a wide flat, so we need to wait to see who wins and then act.
Please open Telegram to view this post
VIEW IN TELEGRAM
Please open Telegram to view this post
VIEW IN TELEGRAM
👍4👌2
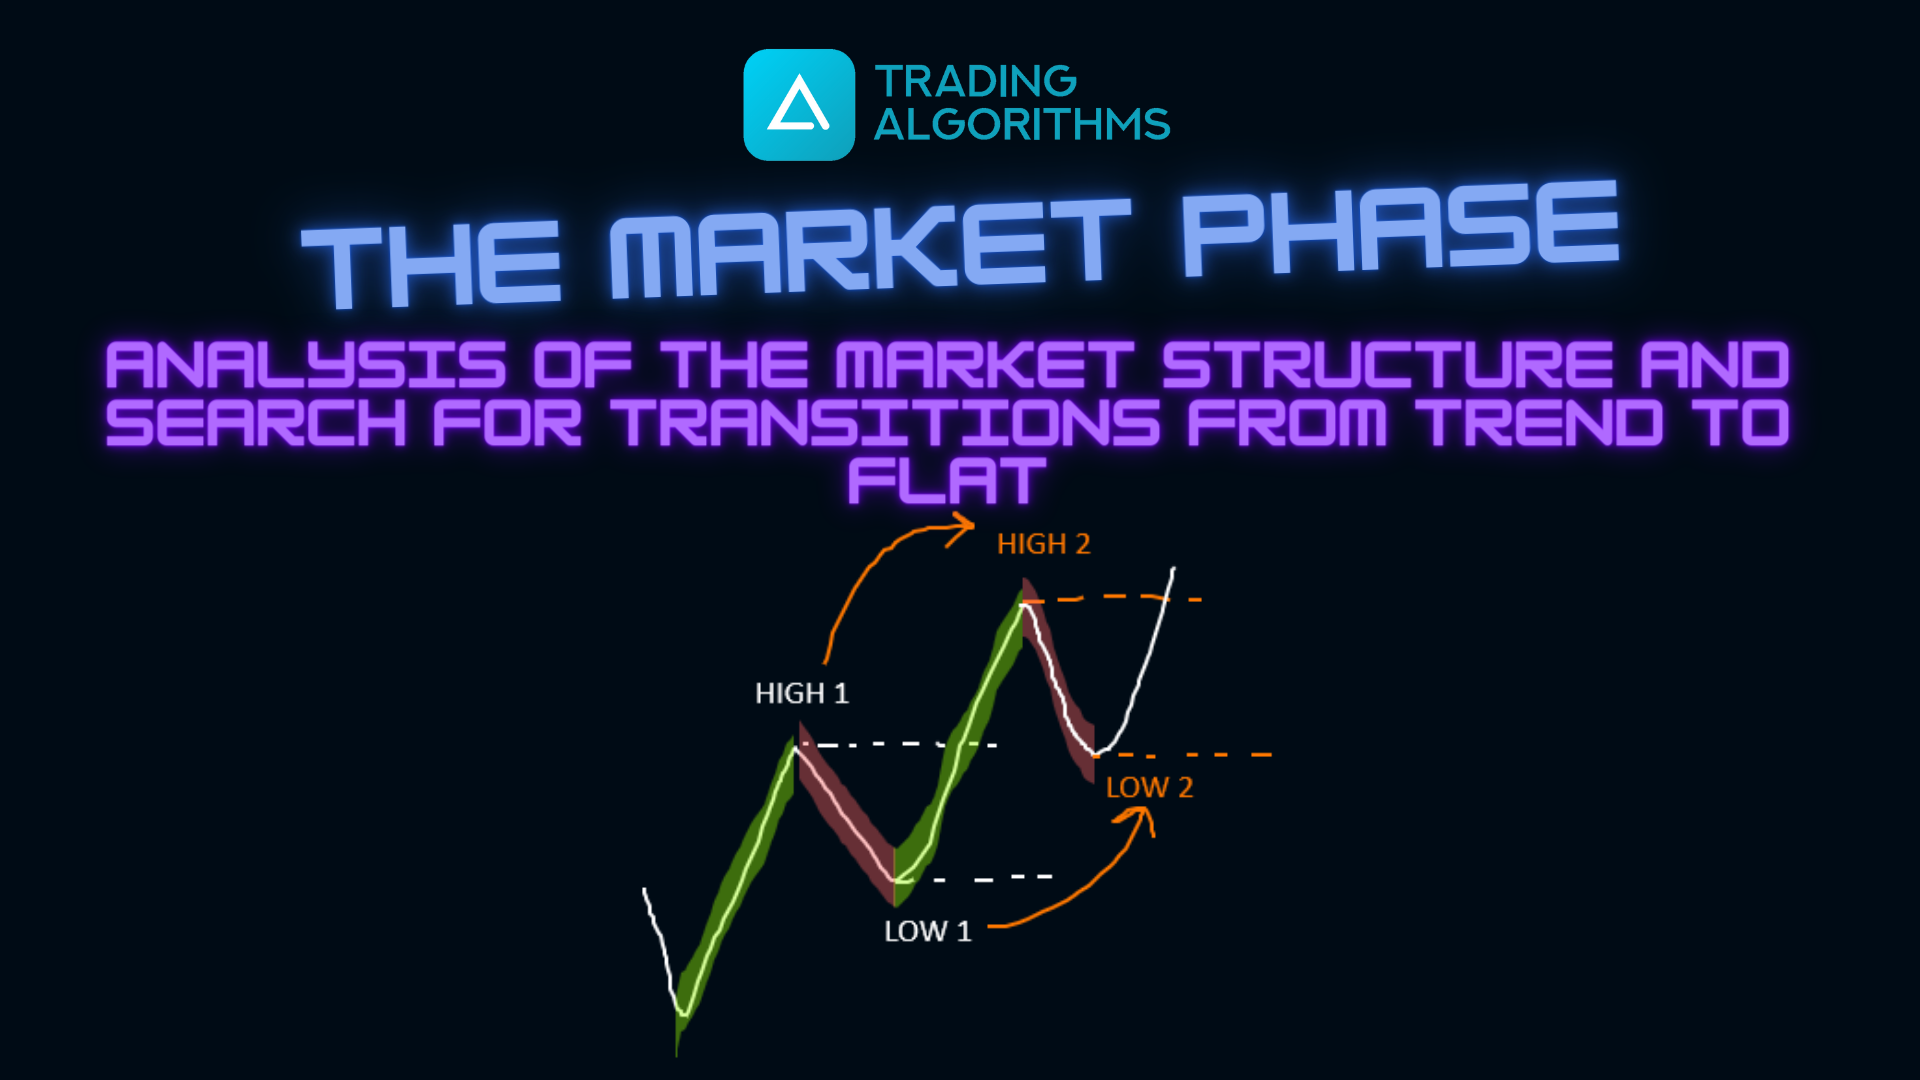
Market phases and cycles. How to find the transition from trend to flat?
This video will focus on analyzing the market structure. This is the first step in analyzing charts to understand the current state of the market.
In the previous videos, we analyzed order summaries and indicators that will help you analyze the print tape. Be sure to watch them if you haven't yet.
Matching. Pricing principles. What drives the price?
Matching. Indicators to help identify Tape Prints patterns
👌5
Ще TRX \ EOS \ BNB \ LINK чекають нового імпульсу.
——————-
TRX \ EOS \ BNB \ LINK are still waiting for a new impulse.
——————-
TRX \ EOS \ BNB \ LINK are still waiting for a new impulse.
👍4
🇺🇦Trading Algorithms | Solution for traders
Ще TRX \ EOS \ BNB \ LINK чекають нового імпульсу. ——————- TRX \ EOS \ BNB \ LINK are still waiting for a new impulse.
Все закрилось, окрім ТРХ. Не зайшов сетап в лонг, але подивимось, може голову дурять ))
👌1
🇺🇦Trading Algorithms | Solution for traders
Все закрилось, окрім ТРХ. Не зайшов сетап в лонг, але подивимось, може голову дурять ))
Дуже уважно спостерігаємо та чекаємо покупця.
==========
We are watching and waiting for the buyer very carefully.
==========
We are watching and waiting for the buyer very carefully.
Профіль обʼєму. Як розвивається ціна в тренді та розворотах ціни?
У цьому відео ми продовжимо розглядати послідовність розвитку ціни та варіанти ваших дій, а також завершемо аналіз на 2 прикладах з попереднього відео про фази ринку використовуючи профіль об'єму.
Перегляньте попередні відео по зведенню ордерів і фазам ринку, якщо ще цього не зробили https://www.youtube.com/playlist?list=PLZKl_RWctwfDaa0xr93jrfG_qOwdy5H29
🔥2
Market phases and cycles. Indicators for analyzing the price structure
I will show you indicators that will help you analyze the market structure. They were developed to simplify the process of analyzing the price structure and identifying trend and flat phases.
https://www.youtube.com/playlist?list=PLAnEfub7Ys8ipntBuqypjCtnqalNxi-tJ
I will show you indicators that will help you analyze the market structure. They were developed to simplify the process of analyzing the price structure and identifying trend and flat phases.
https://www.youtube.com/playlist?list=PLAnEfub7Ys8ipntBuqypjCtnqalNxi-tJ
🔥3