
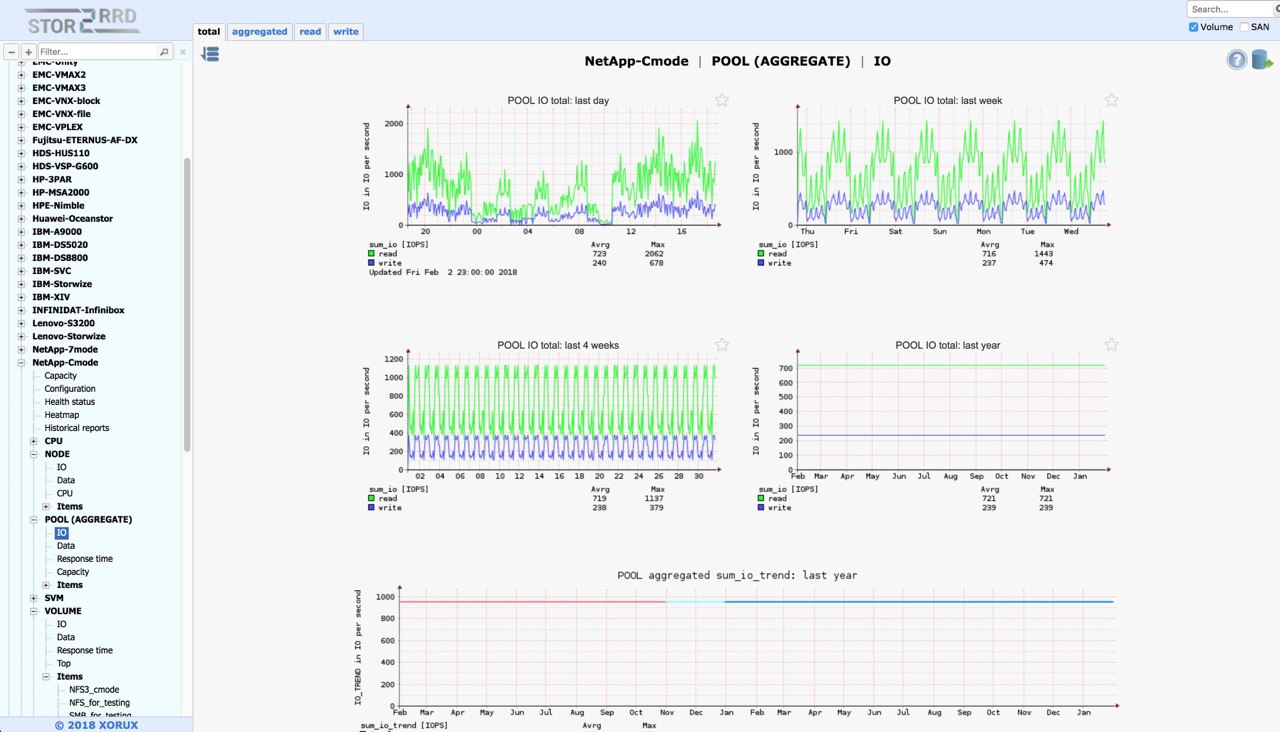
Еще один инструмент для мониторинга производительности и утилизации дискового пространства на СХД. Компания XORUX бесплатно предлагает свой продукт STOR2RRD. Работает с обрудованием множества вендоров, на сайте можно погонять демо и посмотреть как выглядят графики, какая информация доступна. Если есть желание поддержать производителя рублём, то можно купить платную поддержку, например, через Softline.
#monitoring #tools
stor2rrd.com
#monitoring #tools
stor2rrd.com
Шаблон по мониторингу ONTAP в Zabbix. Интересен тем, что тут покрыты Infinite Volume и FlexGroups.
#monitoring #ONTAP #Zabbix
http://www.rejected.io/2017/03/netapp-cluster-trend-reporting-using-zabbix/
#monitoring #ONTAP #Zabbix
http://www.rejected.io/2017/03/netapp-cluster-trend-reporting-using-zabbix/
Как мониторить СХД Dell MD36XX в Zabbix. А как мы знаем внутри Dell MD это NetApp E-series. Так что с минимальными косметическими изменениями это заработает и для NetApp.
#ESeries #Zabbix #monitoring
https://habr.com/company/otus/blog/416787/
#ESeries #Zabbix #monitoring
https://habr.com/company/otus/blog/416787/
Хабр
Zabbix: мониторинг дисковых хранилищ DELL MD36XX
Всем привет! Мы открыли новой набор на обновлённый курс "Администратор Linux": всё те же новые преподаватели, динамичная программа и интересные обсуждения. Ну и...
В продолжение темы мониторинга E-серии. Perl скрипт для сбора метрик по производительности, которые потом возможно отображать в Grafana. Можно отдельно использовать скрипт с текущей инсталяцией Grafana/Graphite или поднять всё сразу в контейнерах. По ссылке найдёте скрипт и docker-compose конфиг для поднятия нужных образов.
#ESeries #Grafana #monitoring
https://github.com/plz/E-Series-Graphite-Grafana
#ESeries #Grafana #monitoring
https://github.com/plz/E-Series-Graphite-Grafana
GitHub
GitHub - plz/E-Series-Graphite-Grafana: Collect Metrics from NetApp E-Series Storage appliances and dispatch them to graphite.
Collect Metrics from NetApp E-Series Storage appliances and dispatch them to graphite. - plz/E-Series-Graphite-Grafana
Пара новых TR.
TR-4711. SAP HANA Backup and Recovery using NetApp Storage Systems and Commvault Software.
Бекапим SAP HANA с помощью Commvault. Напомню, что на тему резервного копирования есть еще TR-4646 и TR-4667.
#SAP #TR
https://www.netapp.com/us/media/tr-4711.pdf
TR-4220. SNMP Support in Data ONTAP.
Описание SNMP MIBов для ONTAP вплоть до версии 9.4.
#ONTAP #SNMP #monitoring
https://www.netapp.com/us/media/tr-4220.pdf
Вышла новая версия NAbox — 2.5. Это pet-project одного из инженеров NetApp. Представляет из себя virtual-appliance для сбора метрик и построения графиков. Построено это всё на Graphite и Graphana. Для получения данных от ONTAP используются Harvest и NMSDK. Всё это добро можно запустить за 15 минут. Видел автора NAbox в Барселоне, передал ему привет из России и сказал, что у нас его детище любят и используют.
Что нового в 2.5:
Important security fixes
Improved parallelism by running 8 carbon collectors
Other performance improvements
Fixed a bug causing VMware tools to stop running
Carbon is now running as its own user
Forced TLS 1.2 protocol
Fixed an issue with carbon causing root partition to fill up
Check SSL certificate validity before installation
SSL chain can be provided as PEM or P7B
Added an option to only add FQDN in CSR
Simplified SSL certificate installation
Minor changes in NAbox CPU dashboards
Fix a bug causing cleanup of old data to fail
#monitoring
https://nabox.org/
NAbox 2.5.1b. Бета-версия с исправлениями багов.
- Fix a bug preventing deletion of configurations through CLI or API
- Fix deployment issue preventing the virtual appliance to boot on pre-6.7 vSphere versions
Что такое NAbox.
#monitoring
https://nabox.org/changelog/v2_5_1b/
- Fix a bug preventing deletion of configurations through CLI or API
- Fix deployment issue preventing the virtual appliance to boot on pre-6.7 vSphere versions
Что такое NAbox.
#monitoring
https://nabox.org/changelog/v2_5_1b/
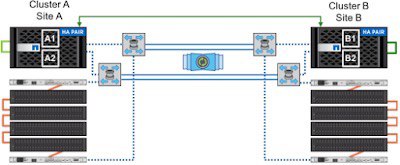
Хорошая подборка ссылок, команд и инструментов для мониторинга NetApp MetroCluster.
#MCC #MetroCluster #monitoring
https://www.cosonok.com/2019/04/notes-metrocluster-monitoring-and.html
#MCC #MetroCluster #monitoring
https://www.cosonok.com/2019/04/notes-metrocluster-monitoring-and.html
Все клиенты NetApp могут бесплатно пользоваться базовой версией Cloud Insights. Это облачный сервис для мониторинга инфраструктуры. Поддерживается очень большое количество оборудования для хранения данных (не только NetApp), виртуальная инфраструктура и приложения. По сути это облачная версия OnCommand Insight (OCI). Но начать пользоваться Cloud Insights намного проще. OCI требует достаточно много ресурсов для установки. С Cloud Insights достаточно скачать Acquisition Unit (AU) и несколько Data Collectors для СХД, приложений, виртуальных машин. AU сделан на базе open source агента InfluxData Telegraf, работает на Linux или Windows и для сбора метрик использует плагины — Data Collectors.
В базовой версии есть ограничения по функциональности и тому, что можно мониторить.
“All NetApp customers, now have free access to Cloud Insights Basic Edition, giving them visibility into their complete NetApp infrastructure. With Cloud Insights, everyone can monitor, troubleshoot and optimize all their resources. All that is required to activate Cloud Insight Basic Edition is start the 14 Day Free Trial. In the Free Trial, there is the opportunity to explore all the enhanced capabilities of the Cloud Insights. At any time during the free trial, people can select the free Basic Edition or subscribe to the Standard or Premium Editions.”
Запрашивайте Trial доступ по ссылке. Необходимо использовать корпоративный email.
#Cloud #monitoring #Insights
https://cloud.netapp.com/cloud-insights
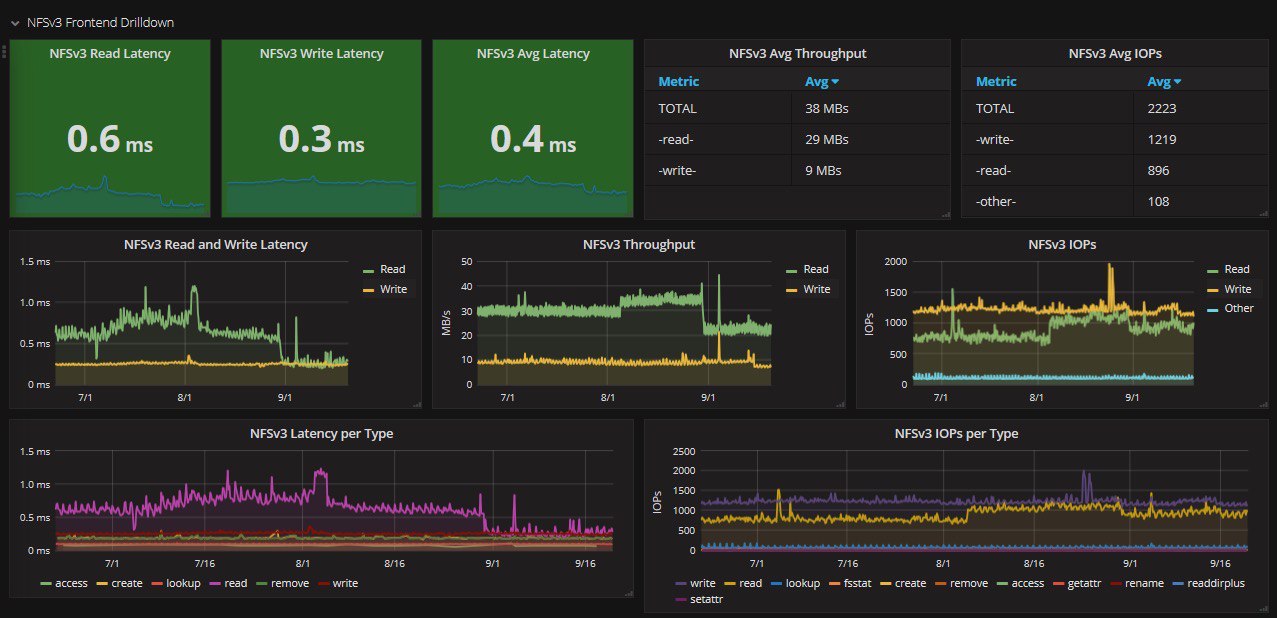
Ещё один вариант мониторинга производительности E-серии.
This project provides an automated installation and deployment of the NetApp E-Series Performance Analyzer, a collection of software and scripts for monitoring the performance of NetApp E-Series storage systems.
This project is intended to allow you to quickly and simply deploy an instance of our performance analyzer for monitoring your E-Series storage systems. We incorporate various open source components and tools in order to do so. While it is primarily intended to serve as a reference implementation for using Grafana to visualize the performance of your E-Series systems, it is also intended to be customizable and extensible based on your individual needs.
#ESeries #monitoring
https://github.com/NetApp/eseries-perf-analyzer
GitHub
GitHub - NetApp/eseries-perf-analyzer: This project provides an automated installation and deployment of Grafana, NetApp E-Series…
This project provides an automated installation and deployment of Grafana, NetApp E-Series Web Services, and supporting software for performance monitoring of NetApp E-Series Storage Systems. - Net...