
Intro to metrics with Grafana: Prometheus, Grafana Mimir, Graphite, and beyond
Вебинар завтра в 19:30 МСК. Регистрация.
Вебинар завтра в 19:30 МСК. Регистрация.
Grafana Labs
Intro to metrics with Grafana: Prometheus, Grafana Mimir, and beyond | Grafana Labs
In this webinar, we’ll go over challenges when scaling metrics systems, with a particular focus on Prometheus and Grafana Mimir.
How to drop and delete metrics in Prometheus
Keeping your Prometheus optimized can be a tedious task over time, but it’s essential in order to maintain the stability of it and also to keep the cardinality under control. Identifying the unnecessary metrics at source, deleting the existing unneeded metrics from your TSDB regularly will keep your Prometheus storage & performance intact.
In this article we’ll look at both identifying, dropping them at source and deleting the already stored metrics from Prometheus.
Читать дальше на Медиуме.
Культура postmortems или как мы учимся на ̶с̶в̶о̶и̶х̶ факапах
Где-то три года назад я выступал на небольшом митапе с темой, которая вынесена в название этой статьи. В том докладе я рассказывал о том, как мы за несколько лет выстроили работу с инцидентами у себя в привлечении Tinkoff. Ну и чтобы доклад был не таким скучным я поделился несколькими postmortems, которые произошли в командах “моего друга”. Читать дальше.
Где-то три года назад я выступал на небольшом митапе с темой, которая вынесена в название этой статьи. В том докладе я рассказывал о том, как мы за несколько лет выстроили работу с инцидентами у себя в привлечении Tinkoff. Ну и чтобы доклад был не таким скучным я поделился несколькими postmortems, которые произошли в командах “моего друга”. Читать дальше.
Calculating composite SLA
How to serial and parallel dependencies affect the total SLA. Читать дальше.
How to serial and parallel dependencies affect the total SLA. Читать дальше.
15 months of 24x7 Primary On-Call — Here’s How I Survived
I just finished 15 months of primary 24x7 on call. Although it is always stressful to be paged in the middle of the night or on a weekend or holiday I was able to lean on my SRE background to ensure that every alert that woke me up faithfully indicated a critical issue with our system and required human intervention. Here’s how I did it. Читать дальше.
I just finished 15 months of primary 24x7 on call. Although it is always stressful to be paged in the middle of the night or on a weekend or holiday I was able to lean on my SRE background to ensure that every alert that woke me up faithfully indicated a critical issue with our system and required human intervention. Here’s how I did it. Читать дальше.
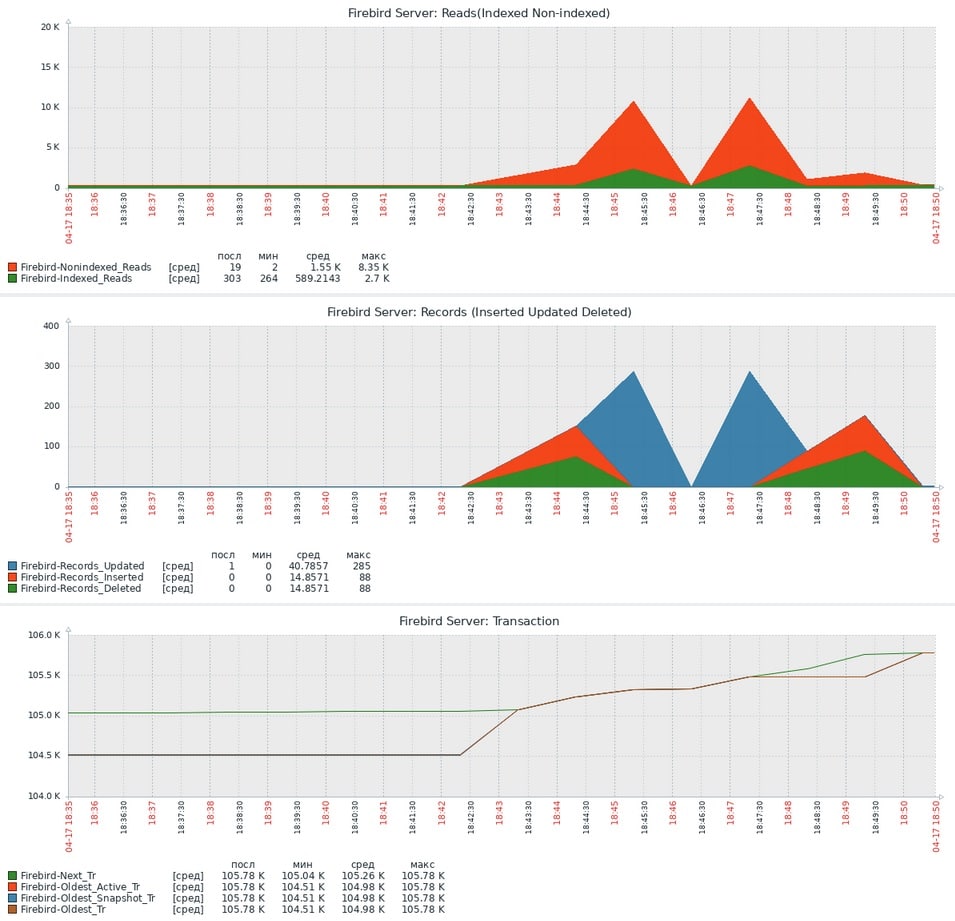
Мониторинг СУБД Firebird с помощью Zabbix
С повсеместным внедрением средств мониторинга захотелось снимать минимальную статистику и определять работоспособность СУБД и самой БД. Для мониторинга использую Zabbix установленный на Ubuntu 20.04 LTS, а сама СУБД находится на виртуальной машине с Windows 2008 Server. Версии на которых был использован метод мониторинга описанный ниже для СУБД Firebird 2.5.9, версия Zabbix 6.0. Но думаю что и с другими версиями проблем быть не должно. Читать дальше.
С повсеместным внедрением средств мониторинга захотелось снимать минимальную статистику и определять работоспособность СУБД и самой БД. Для мониторинга использую Zabbix установленный на Ubuntu 20.04 LTS, а сама СУБД находится на виртуальной машине с Windows 2008 Server. Версии на которых был использован метод мониторинга описанный ниже для СУБД Firebird 2.5.9, версия Zabbix 6.0. Но думаю что и с другими версиями проблем быть не должно. Читать дальше.
A day in the life of an SRE: updating a production-critical Redis cluster
In this article, I share best practices in how to fully capitalise on your migration efforts. I take you through the steps of our Redis cluster update, explain the challenges I faced and highlight potential pitfalls. After all, operating safely comes with experience. Читать дальше.
In this article, I share best practices in how to fully capitalise on your migration efforts. I take you through the steps of our Redis cluster update, explain the challenges I faced and highlight potential pitfalls. After all, operating safely comes with experience. Читать дальше.
На Ютубе есть интересный канал, посвящённый Заббикс. Это канал Дмитрия Ламберта - руководителя группы технической поддержки из Заббикс. Там регулярно выходят видосы с полезными лайфхаками относительно Заббикс.
Ссылка на канал.
Ссылка на канал.
Monitor Nginx Metrics with GrafanaDR: A Step-by-Step Guide
Let’s imagine that you have a small project where not everything (or nothing) is containerized. Therefore orchestration, convenient Loki, and other tools for monitoring and analytics of requests are not used (but if I missed something, you can correct it in the comments). Читать дальше.
Let’s imagine that you have a small project where not everything (or nothing) is containerized. Therefore orchestration, convenient Loki, and other tools for monitoring and analytics of requests are not used (but if I missed something, you can correct it in the comments). Читать дальше.
What makes VictoriaMetrics the next leading choice for open-source monitoring
After researching a few solutions like Thanos, Cortex, Grafana-Mimir, and VictoriaMetrics. It’s clear to say that in my opinion, VictoriaMetrics is the winner and the best fit for my purposes & needs. Читать дальше.
After researching a few solutions like Thanos, Cortex, Grafana-Mimir, and VictoriaMetrics. It’s clear to say that in my opinion, VictoriaMetrics is the winner and the best fit for my purposes & needs. Читать дальше.
6 Metrics to Watch for on Your K8s Cluster
We’ll be covering the most critical metrics based on k8s’s metadata which form a good baseline for monitoring your workloads and making sure they’re in a healthy state. Читать дальше.
We’ll be covering the most critical metrics based on k8s’s metadata which form a good baseline for monitoring your workloads and making sure they’re in a healthy state. Читать дальше.
Medium
6 Metrics To Watch for on Your K8s Cluster
The most critical Kubernetes metrics to monitor
Запуск облачного стека мониторинга с использованием нескольких ЦОДов
Когда я общаюсь с клиентами, они рассказывают мне о том, что их приложения работают в двух центрах обработки данных, но при более детальном изучении оказывается, что их стек наблюдения доступен только в одном из них.
Это знание, как откровение, снизошло на многих в марте 2021 года. Один из крупнейших европейских провайдеров облачных услуг (OVHcloud) пережил масштабный пожар в одном из своих дата-центров, что вызвало серьезные перебои в работе даже таких крупных клиентов, как правительство Франции.
На следующий день после инцидента мой коллега, отвечающий за управление качеством, спросил меня, сможем ли мы выдержать подобную катастрофу. Это побудило меня задуматься о превращении нашего единого стека мониторинга в стек высокой доступности, работающего на базе нескольких центров обработки данных. Читать дальше.
Кастомизируем дашборды в Grafana для инженеров по холодоснабжению ЦОДа
Система мониторинга инженерной инфраструктуры – это нервная система дата-центра. С ее помощью инженеры вовремя видят неприятные симптомы на графиках и предотвращают проблемы в работе кондиционеров, бесперебойников, сетевых устройств и других элементов инженерных систем. В этой статье расскажем, как и для каких задач наши инженеры создают кастомные дашборды с помощью графического плагина FlowCharting для Grafana.Читать дальше.
Система мониторинга инженерной инфраструктуры – это нервная система дата-центра. С ее помощью инженеры вовремя видят неприятные симптомы на графиках и предотвращают проблемы в работе кондиционеров, бесперебойников, сетевых устройств и других элементов инженерных систем. В этой статье расскажем, как и для каких задач наши инженеры создают кастомные дашборды с помощью графического плагина FlowCharting для Grafana.Читать дальше.
Серия постов по траблшутингу производительности Linux
Linux troubleshooting: CPU analysis
Linux troubleshooting: Memory analysis
Linux troubleshooting: Disk analysis
Linux troubleshooting: CPU analysis
Linux troubleshooting: Memory analysis
Linux troubleshooting: Disk analysis
Data Manipulation panel plugin for Grafana
Working on a commercial project, we created a data manipulation panel plugin that can be used to insert, update application data, and modify configuration directly from your Grafana dashboard. Читать дальше.
Working on a commercial project, we created a data manipulation panel plugin that can be used to insert, update application data, and modify configuration directly from your Grafana dashboard. Читать дальше.
Grafana as Code Part ⅠⅠⅠ: Practice Guide
This article is a summary of some of our practical experience. Читать дальше.
This article is a summary of some of our practical experience. Читать дальше.
Medium
Grafana as Code Part ⅠⅠⅠ: Practice Guide
Grafana as Code means that all of Grafana’s configuration — including dashboards — is declared by code. The benefits of declaring by code are as follows. 1. all code can be versioned. This means that…