
This media is not supported in your browser
VIEW IN TELEGRAM
Forex rebates are a portion of the transaction cost that is paid back to the client on each trade, resulting in a lower spread and improved win ratio. For example, if your rebate is 1 pip and the spread is 3 pips, then your net spread is only 2 pips.
Many traders initially believe there must be higher costs elsewhere to compensate, however they soon find there is no catch and Forex rebates truly reduce the costs of the transaction and improve their bottom line.
Two the best rebate services: http://fxcash.ml - accrual of profit the next day after trading
http://cashbackforex.tk -profit accrual once a month on the 12th
Close Orders - script MT4.zip
421.1 KB
Close all multi currency open orders and cancel pending orders according to various scenarios. Slippage for open orders is calculated for each currency.
Choose only one scenario per visit, the script processes the first menu item selected.
Choose only one scenario per visit, the script processes the first menu item selected.
This indicator Draw True Weekly Pivot Line and seven levels Up ( R1,R2,R3 ... ) and seven levels Down ( S1,S2,S3 ...) with back test. This indicator consists of tow indicators Waddah_Attar_Weekly_Pivot_Fibo_First.mq4 and Waddah_Attar_Weekly_Pivot_Fibo_Second.mq4
I can't draw 15 lines in same indicator, so I make tow indicators. Put the tow indicators on the chart to draw all the levels.
I can't draw 15 lines in same indicator, so I make tow indicators. Put the tow indicators on the chart to draw all the levels.
Renko charts were invented in Japan and were introduced to the Western world by Steve Nison, widely known as father of modern candlestick charting.1 Renko charts ignore time and focus solely on price changes. Renko charts plot fixed price brick up or down in 45 degrees with one brick per vertical line. As vertical/horizontal axis cannot be fixed in MQL, Renko charts are recreated on an offline chart via MQL4 program (script/indicator/expert). You may find many of these Renko converters programs by searching on internet.
This media is not supported in your browser
VIEW IN TELEGRAM
Forex rebates are a portion of the transaction cost that is paid back to the client on each trade, resulting in a lower spread and improved win ratio. For example, if your rebate is 1 pip and the spread is 3 pips, then your net spread is only 2 pips.
Many traders initially believe there must be higher costs elsewhere to compensate, however they soon find there is no catch and Forex rebates truly reduce the costs of the transaction and improve their bottom line.
Two the best rebate services: http://fxcash.ml - accrual of profit the next day after trading
http://cashbackforex.tk -profit accrual once a month on the 12th
Many traders initially believe there must be higher costs elsewhere to compensate, however they soon find there is no catch and Forex rebates truly reduce the costs of the transaction and improve their bottom line.
Two the best rebate services: http://fxcash.ml - accrual of profit the next day after trading
http://cashbackforex.tk -profit accrual once a month on the 12th
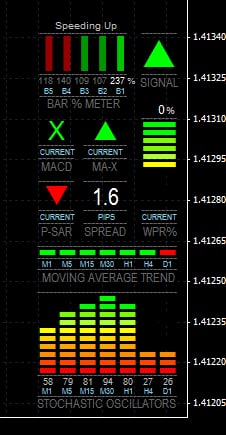
This all-in-one indicator was inspired by !x-meter and used some of its code as a template for the graphic objects (so thanks to Robert Hill who developed it). It is however completely different and provides alot more information that would normally require many charts and indicators and general screen clutter. It was designed to give alot more precision to both trade entries and exits and provide an instant snapshot of a currency pair's movement. Multi-Meter works on any currency or timeframe (or it should) and displays the following in the bottom right corner of the chart..
In his book “Mastering Elliot Wave”, Glenn Neely described a new approach to Elliot wave analysis. This technique is known as Neely Method and it is a more objective approach to market wave analysis.
The basic unit in this theory is called a Monowave and it is simply the movement of the price until it changes direction. Monowaves can be identified by plotting the high and low prices for a chosen period according to the order of appearance on beginning and the center of the time slot.
The basic unit in this theory is called a Monowave and it is simply the movement of the price until it changes direction. Monowaves can be identified by plotting the high and low prices for a chosen period according to the order of appearance on beginning and the center of the time slot.
Like period Separator each new day will gets its line at starting.
Above this line you can read the text what day of the week is starting. The lines can be dotted, solid , dash .... and also the width can be chosen. The text is placed pixels you choose from pricemax.
Everytime you change the chart the lines will correct themselves so the output keeps the same. Choosing the first day of the week different color makes you see easily weekly Separators also.