
#MarketNews #oilprices #inflation #stockmarket #techstocks
Yearly Market Wrap With Gary Thomson: INDICES, OIL, TECH STOCKS, CURRENCIES, BANKS INFLATION
Get the latest scoop on the year's hottest happenings, all in one convenient video. Join Gary Thomson, the COO of FXOpen UK, as he breaks down the most significant news reports and shares his expert insights.📊
🔸Inflation
🔸 Indices market - S&P 500, Nasdaq
🔸Commodities - Oil market
🔸Equities - Tech stocks
🔸Currencies - AUD/USD, GBP/USD, EUR/USD
🔸Bank demises
🔸Monetary policy - Interest rates
Stay in the know and empower yourself with our short, yet power-packed video. Watch it now and stay updated with FXOpen. Don't miss out on this invaluable opportunity to sharpen your trading skills and make informed decisions.📈
https://cutt.ly/3wDXxw5Y
To take advantage of price fluctuations in the foreign exchange markets, consider enlisting the services of a reliable broker like FXOpen.
⚠️
This forecast represents FXOpen Companies opinion only, it should not be construed as an offer, invitation or recommendation in respect to FXOpen Companies products and services or as financial advice
Yearly Market Wrap With Gary Thomson: INDICES, OIL, TECH STOCKS, CURRENCIES, BANKS INFLATION
Get the latest scoop on the year's hottest happenings, all in one convenient video. Join Gary Thomson, the COO of FXOpen UK, as he breaks down the most significant news reports and shares his expert insights.📊
🔸Inflation
🔸 Indices market - S&P 500, Nasdaq
🔸Commodities - Oil market
🔸Equities - Tech stocks
🔸Currencies - AUD/USD, GBP/USD, EUR/USD
🔸Bank demises
🔸Monetary policy - Interest rates
Stay in the know and empower yourself with our short, yet power-packed video. Watch it now and stay updated with FXOpen. Don't miss out on this invaluable opportunity to sharpen your trading skills and make informed decisions.📈
https://cutt.ly/3wDXxw5Y
To take advantage of price fluctuations in the foreign exchange markets, consider enlisting the services of a reliable broker like FXOpen.
⚠️
This forecast represents FXOpen Companies opinion only, it should not be construed as an offer, invitation or recommendation in respect to FXOpen Companies products and services or as financial advice
YouTube
Yearly Market Wrap With Gary Thomson: INDICES, OIL, TECH STOCKS, CURRENCIES, BANKS INFLATION
Trading on leveraged products involves a high level of risk
Get the latest scoop on the year's hottest happenings, all in one convenient video. Join Gary Thomson, the COO of FXOpen UK, as he breaks down the most significant news reports and shares his expert…
Get the latest scoop on the year's hottest happenings, all in one convenient video. Join Gary Thomson, the COO of FXOpen UK, as he breaks down the most significant news reports and shares his expert…
#MarketNews #oilprices #oilindustry
Brent Oil Price Reaches New December High
Financial markets are experiencing a traditional decline in trading activity associated with the holiday period. Notable events:
→ the S&P-500 and NASDAQ-100 stock indices updated their maximum for the year after the holiday Monday, thereby confirming the idea that the decline on Wednesday, September 20, was in the nature of a correction. Santa and his rally do not disappoint.
→ The dollar index drops to six-month lows due to expectations of an interest rate cut in March 2024.
→ The price of oil reached a new high in December.
The rise in oil prices is caused by geopolitical tensions:
→ WSJ: Iran-backed militias fire at US bases in the Middle East.
→ Bloomberg: Continued Houthi attacks on shipping and US strikes on targets in Iraq raise the risk of the war expanding in the Middle East.
→ Reuters: The war in Gaza will last several months. Concerns about the spread of the conflict are growing.
→ Barron's: Dispute between Venezuela and Guyana could threaten oil production and higher prices.
If military action disrupts the production and supply of oil, this could sharply increase its price.
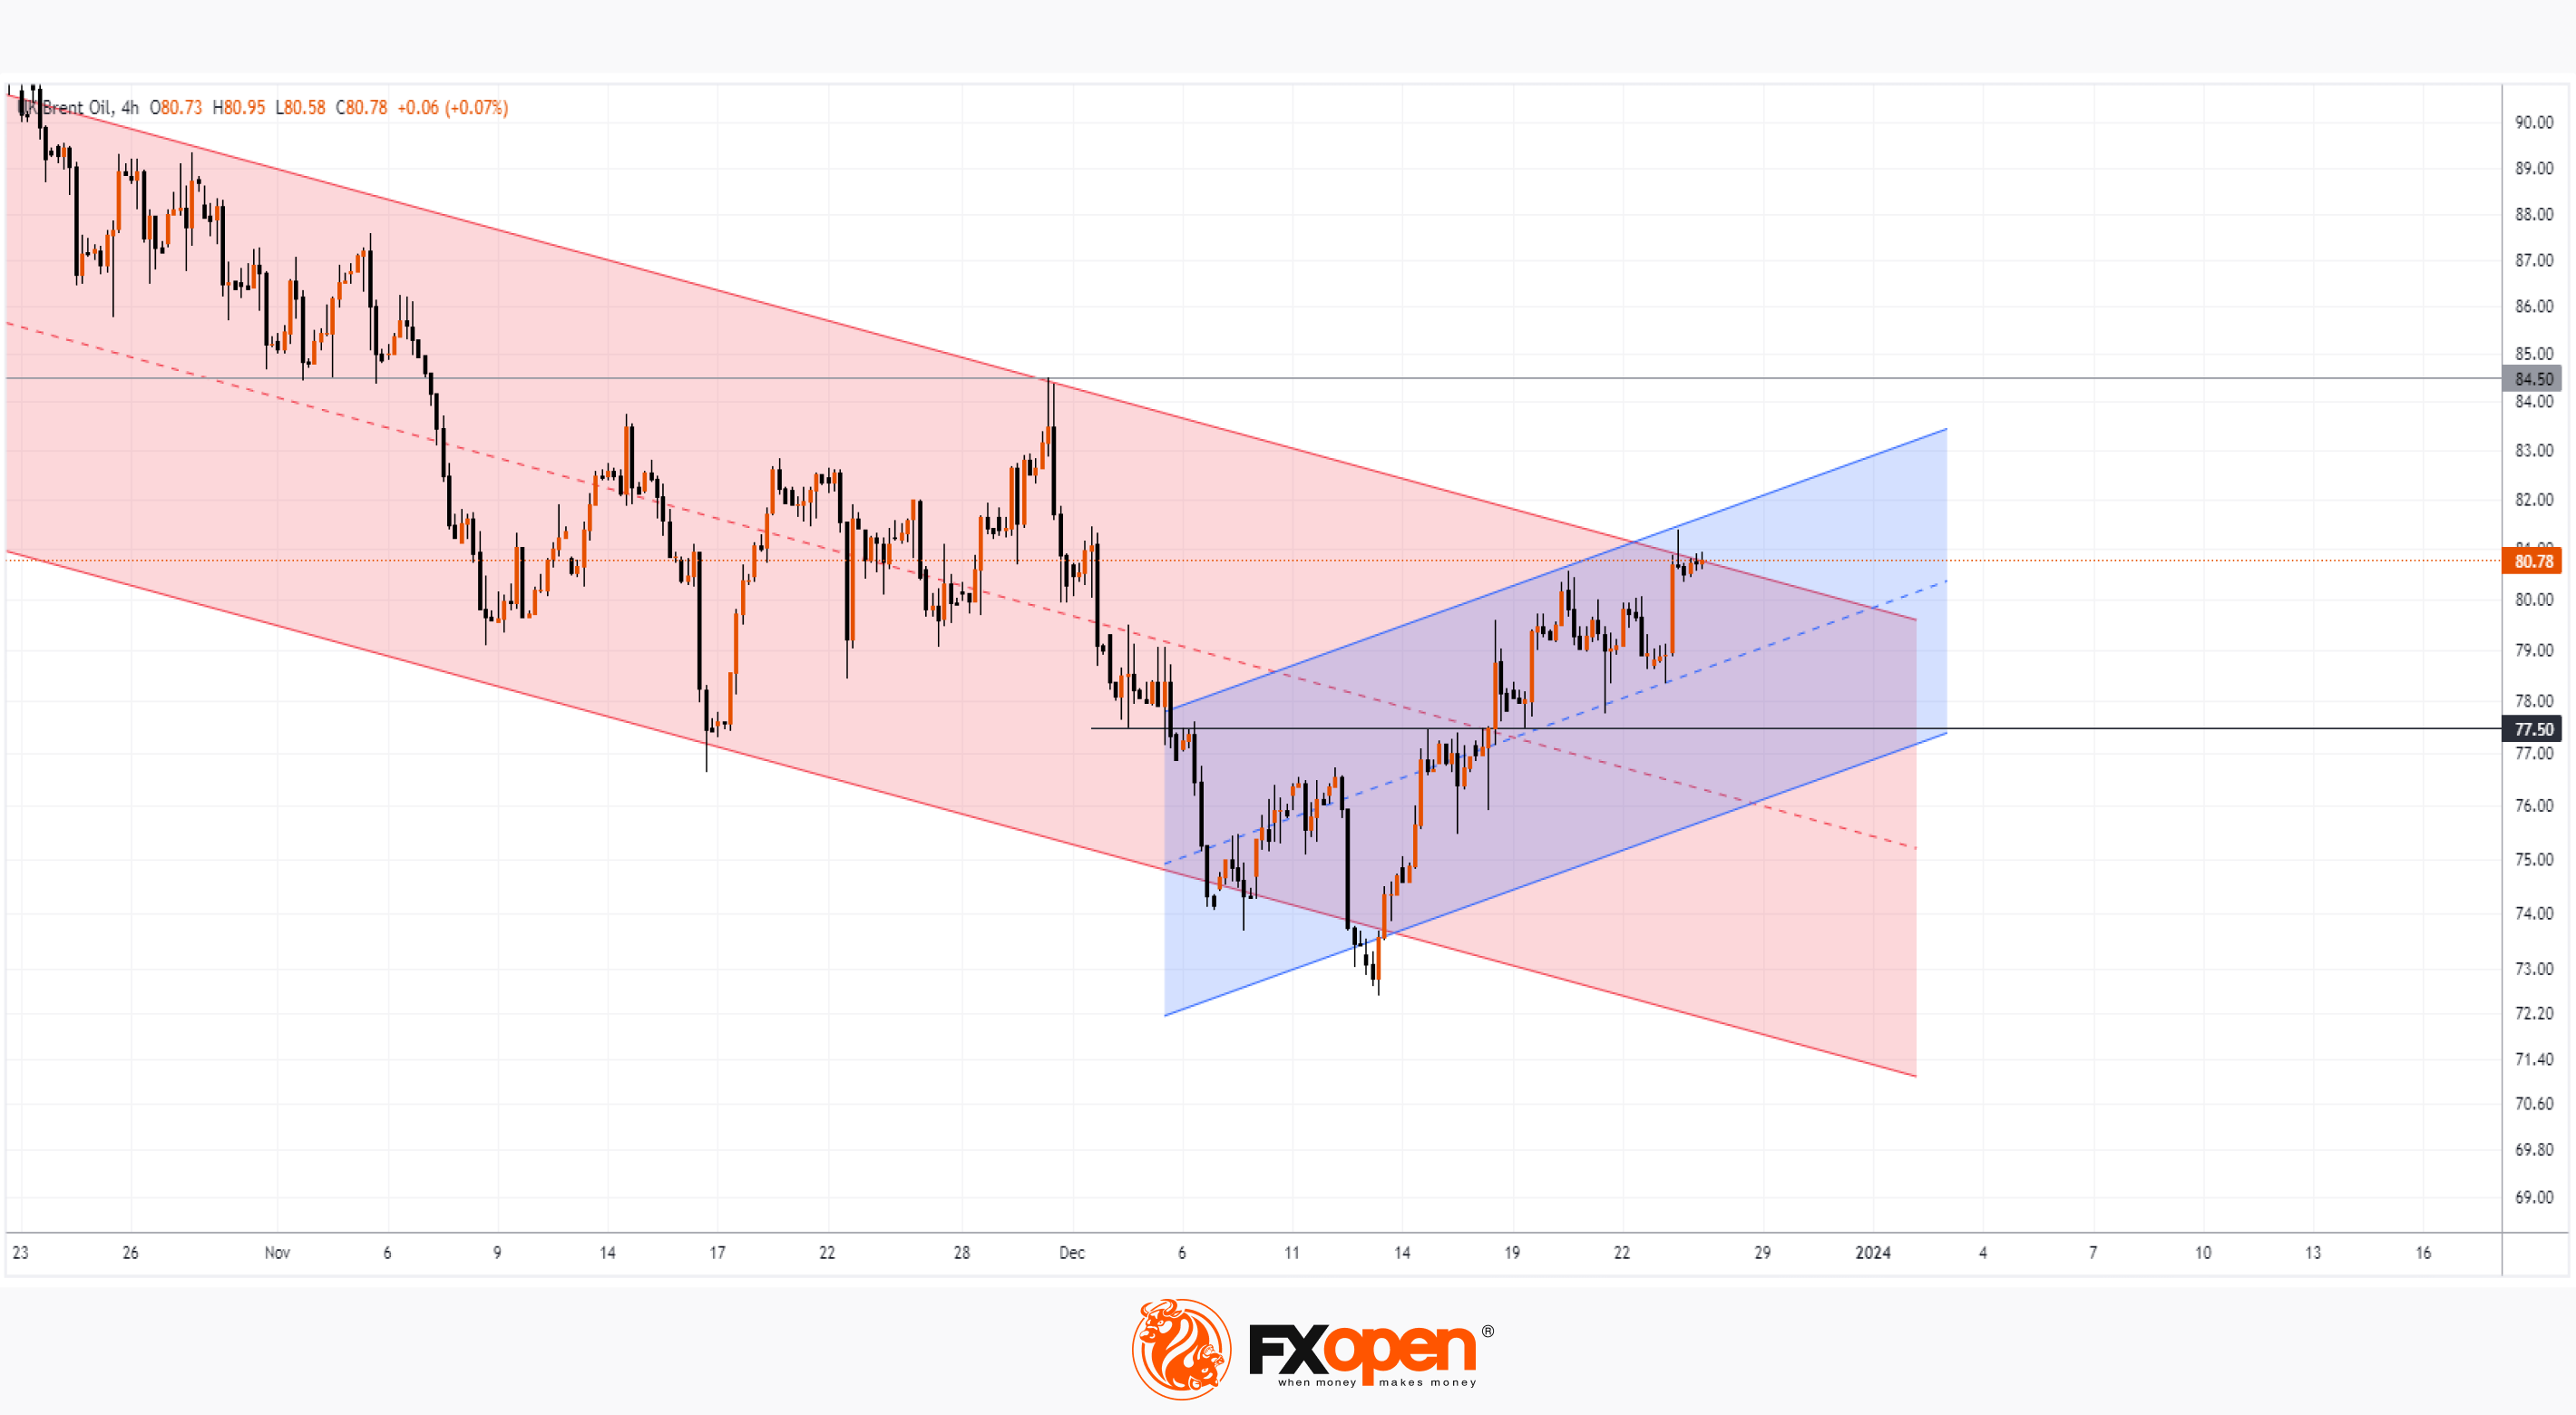
The XBR/USD chart shows that:
→ the price is still in a downtrend (as shown by the red channel);
→ moving within the ascending channel (shown in blue) in December, the price has reached the upper limit of the red channel, and is now in a vulnerable position.
On the one hand, bears may try to resume the downward trend. On the other hand, if demand forces truly dominate the market, then only a minor pullback from the upper boundary of the red channel can be expected. Note the 77.50 level, which acted as resistance but changed its role after the breakout. Around this level there is a value of 50% of the price increase from the December low. So as long as the price is above 77.50, it is acceptable to assume that the chances of an attempt at a bullish breakout of the red channel will remain high.
To benefit from the rise and fall of oil prices, consider enlisting the services of a trusted broker like FXOpen.
CFDs are complex instruments and come with a high risk of losing your money.
This article represents the opinion of the Companies operating under the FXOpen brand only. It is not to be construed as an offer, solicitation, or recommendation with respect to products and services provided by the Companies operating under the FXOpen brand, nor is it to be considered financial advice.
Brent Oil Price Reaches New December High
Financial markets are experiencing a traditional decline in trading activity associated with the holiday period. Notable events:
→ the S&P-500 and NASDAQ-100 stock indices updated their maximum for the year after the holiday Monday, thereby confirming the idea that the decline on Wednesday, September 20, was in the nature of a correction. Santa and his rally do not disappoint.
→ The dollar index drops to six-month lows due to expectations of an interest rate cut in March 2024.
→ The price of oil reached a new high in December.
The rise in oil prices is caused by geopolitical tensions:
→ WSJ: Iran-backed militias fire at US bases in the Middle East.
→ Bloomberg: Continued Houthi attacks on shipping and US strikes on targets in Iraq raise the risk of the war expanding in the Middle East.
→ Reuters: The war in Gaza will last several months. Concerns about the spread of the conflict are growing.
→ Barron's: Dispute between Venezuela and Guyana could threaten oil production and higher prices.
If military action disrupts the production and supply of oil, this could sharply increase its price.
The XBR/USD chart shows that:
→ the price is still in a downtrend (as shown by the red channel);
→ moving within the ascending channel (shown in blue) in December, the price has reached the upper limit of the red channel, and is now in a vulnerable position.
On the one hand, bears may try to resume the downward trend. On the other hand, if demand forces truly dominate the market, then only a minor pullback from the upper boundary of the red channel can be expected. Note the 77.50 level, which acted as resistance but changed its role after the breakout. Around this level there is a value of 50% of the price increase from the December low. So as long as the price is above 77.50, it is acceptable to assume that the chances of an attempt at a bullish breakout of the red channel will remain high.
To benefit from the rise and fall of oil prices, consider enlisting the services of a trusted broker like FXOpen.
CFDs are complex instruments and come with a high risk of losing your money.
This article represents the opinion of the Companies operating under the FXOpen brand only. It is not to be construed as an offer, solicitation, or recommendation with respect to products and services provided by the Companies operating under the FXOpen brand, nor is it to be considered financial advice.
#crypto #forextrading #ETH
ETH/USD Analysis: New Record of the Year
Today, the price of Ethereum exceeded the level of 2,440 per token, thereby setting a new high for 2023. It is noteworthy that the price of Bitcoin did not support the bullish sentiment, continuing to fluctuate around the USD 43,000 level for the fifth day.
What is the reason for the growth of ETH/USD from a fundamental point of view? There is no obvious trigger in the media, so we can only make assumptions:
→ market participants considered ETH an undervalued asset against the backdrop of the growth of Bitcoin and Solana;
→ perhaps buyers assume that after the expected approval of applications for the BTC ETF, the ETH ETF story will be next?
→ Santa's rally and the positive sentiment associated with it.
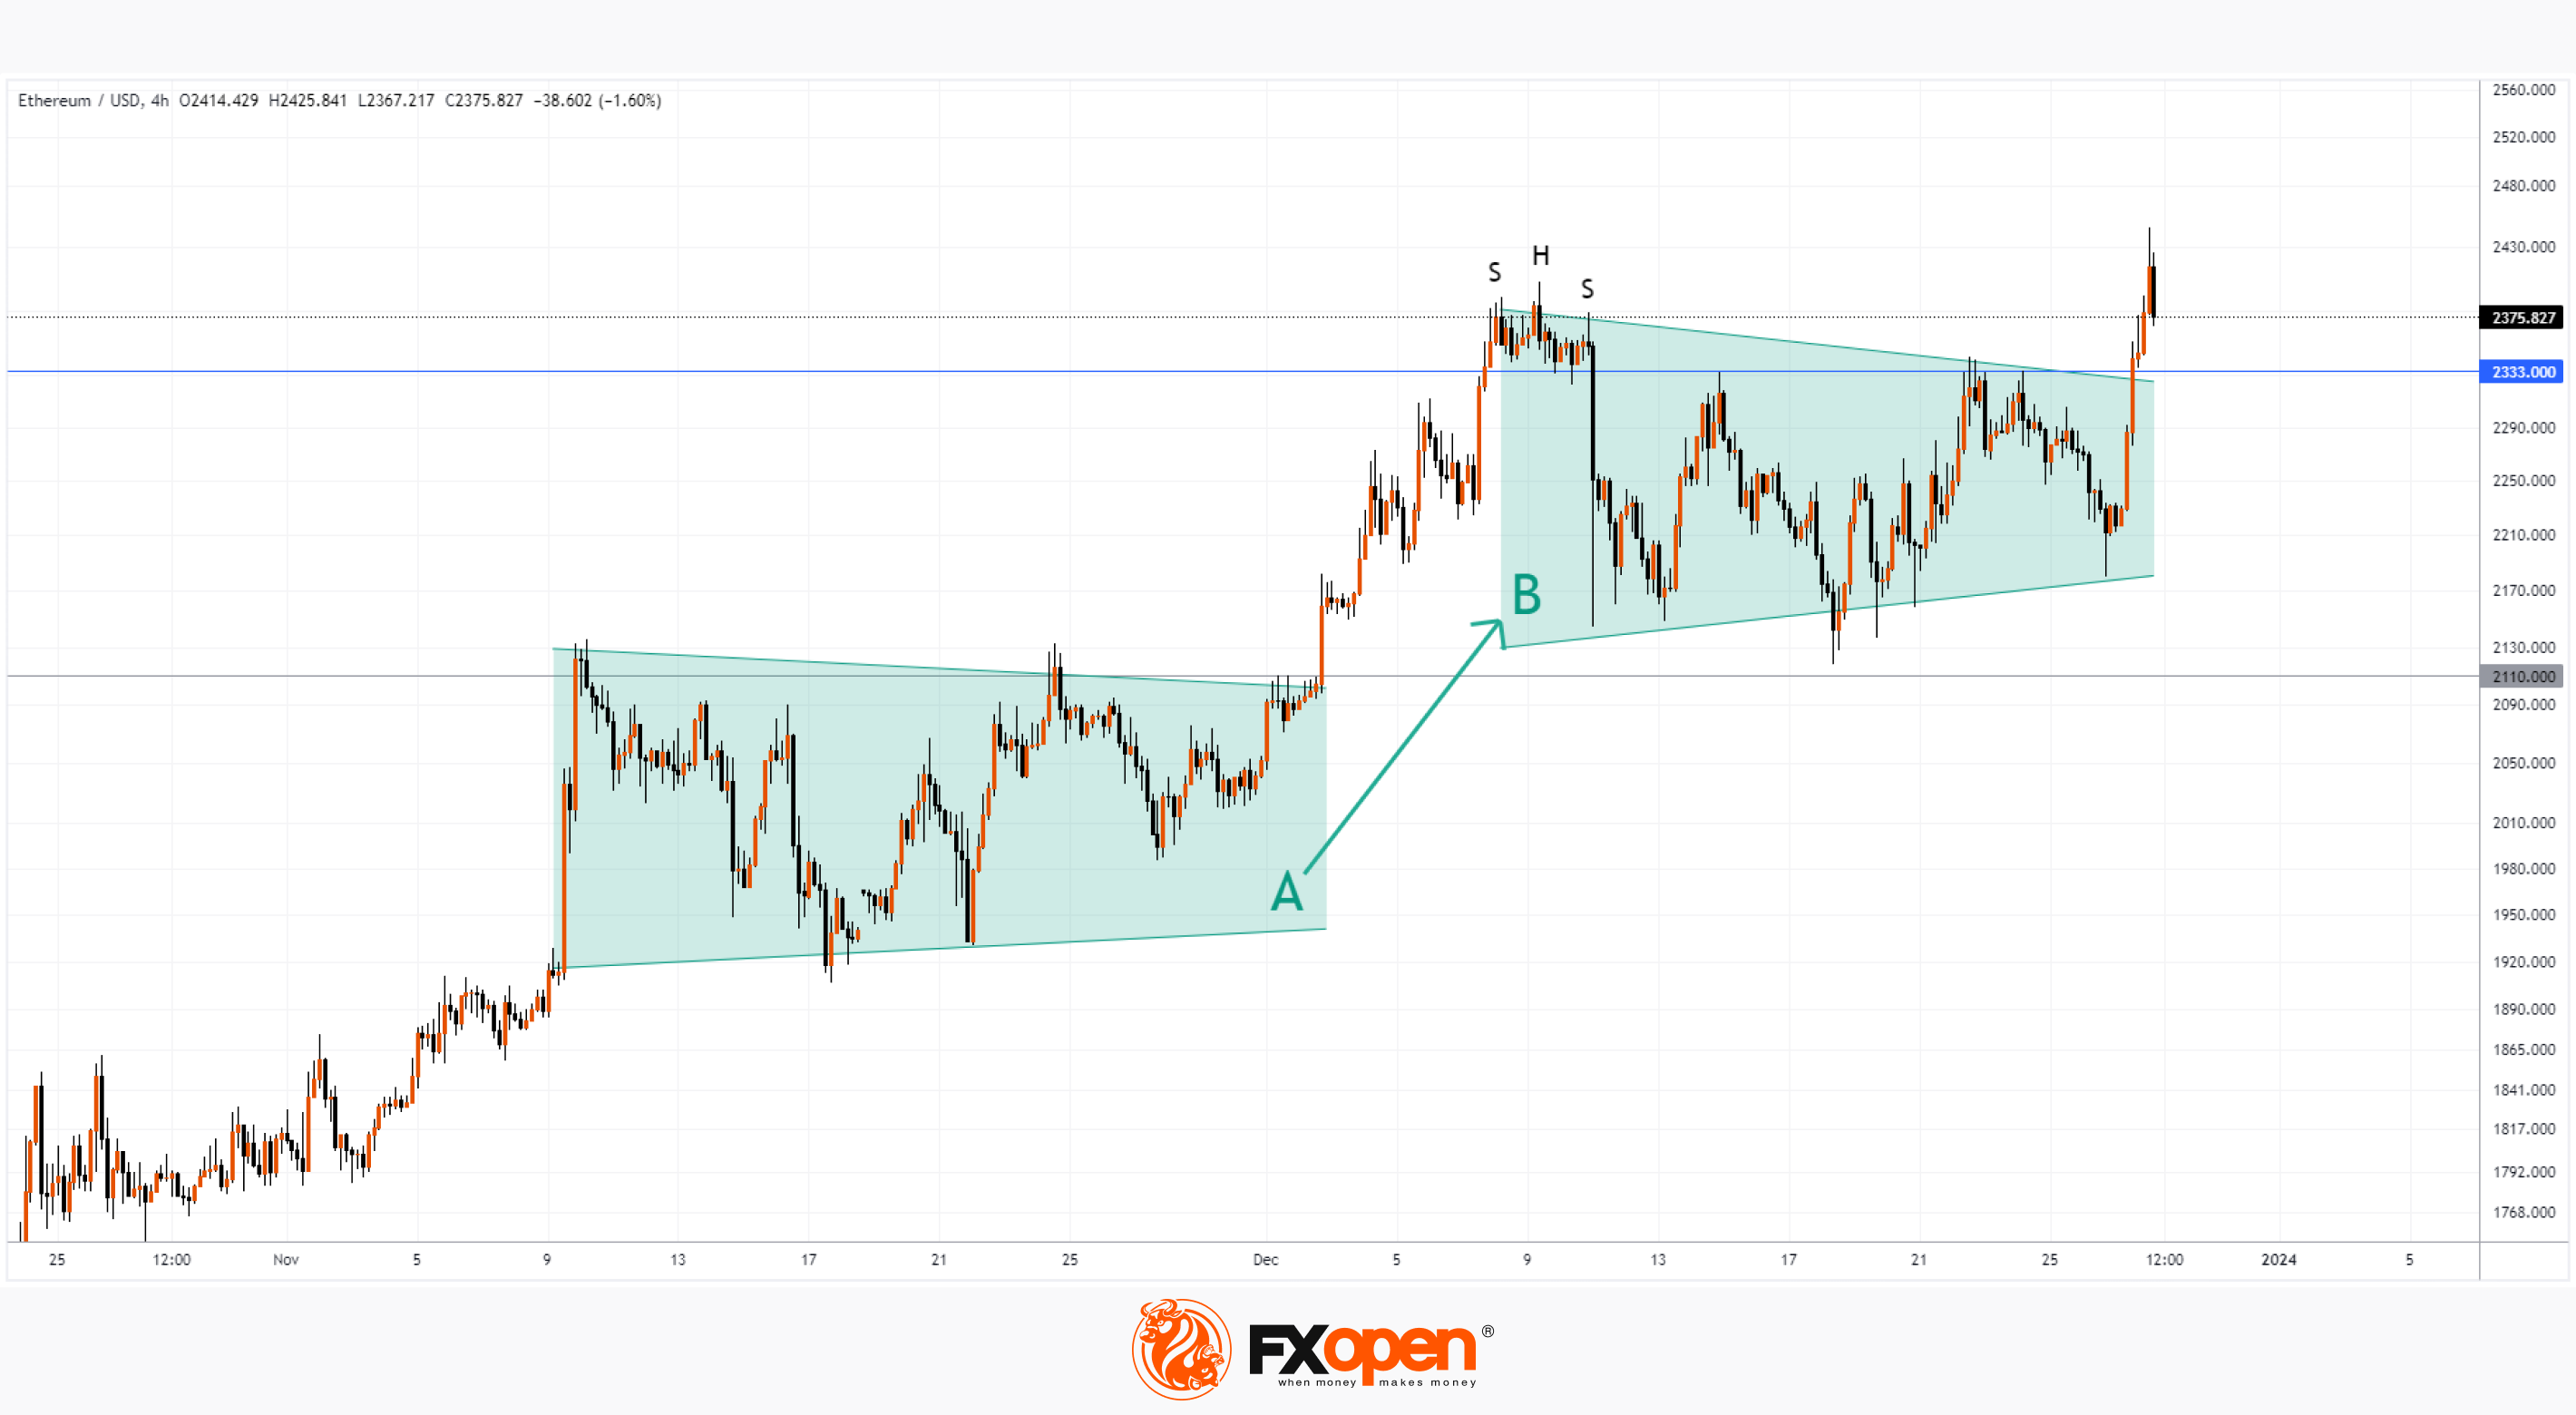
From a technical point of view, the price of ETH/USD moved up beyond the balance period “B”, where the forces of supply and demand were balanced. The bullish momentum was maintained, with upward momentum above the 2,333 level attracting followers and forcing short sellers to take losses. According to on-chain analytical platforms, in just one hour, at the peak of growth, USD 14 million of bearish positions were liquidated on cryptocurrency exchanges—there was a short squeeze in the market to some extent.
What's next? Will the price be able to form a new balance period “C”, which will be above the period “B” (similar to the trend “A” → “B”)?
This morning, on the 4-hour chart, a bearish engulfing pattern is forming, which may result in a false breakout of the previous top on December 9, when the SHS pattern was formed — this is not a very optimistic development of events.
However, as long as the price remains above the level of 2,333, there is reason to believe that the market is on the way to forming a balance “C”, which is above the balance “B” - similar to what happened with the level of 2,110. A bearish breakdown of the level of 2,333 and a return to the zone balance “B” will mean an alarming signal: buyers have lost strength, and therefore the next breakdown of balance “B” may occur in a downward direction.
To benefit from the rise and fall of cryptocurrency prices, consider enlisting the services of a trusted broker like FXOpen.
CFDs are complex instruments and come with a high risk of losing your money.
At FXOpen UK and FXOpen AU, Cryptocurrency CFDs are only available for trading by those clients categorised as Professional clients under FCA Rules and Professional clients under ASIC Rules, respectively. They are not available for trading by Retail clients.
This article represents the opinion of the Companies operating under the FXOpen brand only. It is not to be construed as an offer, solicitation, or recommendation with respect to products and services provided by the Companies operating under the FXOpen brand, nor is it to be considered financial advice.
ETH/USD Analysis: New Record of the Year
Today, the price of Ethereum exceeded the level of 2,440 per token, thereby setting a new high for 2023. It is noteworthy that the price of Bitcoin did not support the bullish sentiment, continuing to fluctuate around the USD 43,000 level for the fifth day.
What is the reason for the growth of ETH/USD from a fundamental point of view? There is no obvious trigger in the media, so we can only make assumptions:
→ market participants considered ETH an undervalued asset against the backdrop of the growth of Bitcoin and Solana;
→ perhaps buyers assume that after the expected approval of applications for the BTC ETF, the ETH ETF story will be next?
→ Santa's rally and the positive sentiment associated with it.
From a technical point of view, the price of ETH/USD moved up beyond the balance period “B”, where the forces of supply and demand were balanced. The bullish momentum was maintained, with upward momentum above the 2,333 level attracting followers and forcing short sellers to take losses. According to on-chain analytical platforms, in just one hour, at the peak of growth, USD 14 million of bearish positions were liquidated on cryptocurrency exchanges—there was a short squeeze in the market to some extent.
What's next? Will the price be able to form a new balance period “C”, which will be above the period “B” (similar to the trend “A” → “B”)?
This morning, on the 4-hour chart, a bearish engulfing pattern is forming, which may result in a false breakout of the previous top on December 9, when the SHS pattern was formed — this is not a very optimistic development of events.
However, as long as the price remains above the level of 2,333, there is reason to believe that the market is on the way to forming a balance “C”, which is above the balance “B” - similar to what happened with the level of 2,110. A bearish breakdown of the level of 2,333 and a return to the zone balance “B” will mean an alarming signal: buyers have lost strength, and therefore the next breakdown of balance “B” may occur in a downward direction.
To benefit from the rise and fall of cryptocurrency prices, consider enlisting the services of a trusted broker like FXOpen.
CFDs are complex instruments and come with a high risk of losing your money.
At FXOpen UK and FXOpen AU, Cryptocurrency CFDs are only available for trading by those clients categorised as Professional clients under FCA Rules and Professional clients under ASIC Rules, respectively. They are not available for trading by Retail clients.
This article represents the opinion of the Companies operating under the FXOpen brand only. It is not to be construed as an offer, solicitation, or recommendation with respect to products and services provided by the Companies operating under the FXOpen brand, nor is it to be considered financial advice.
#stockmarket #stocktrading #stocks
European Stock Index Shows Signs of Weakness
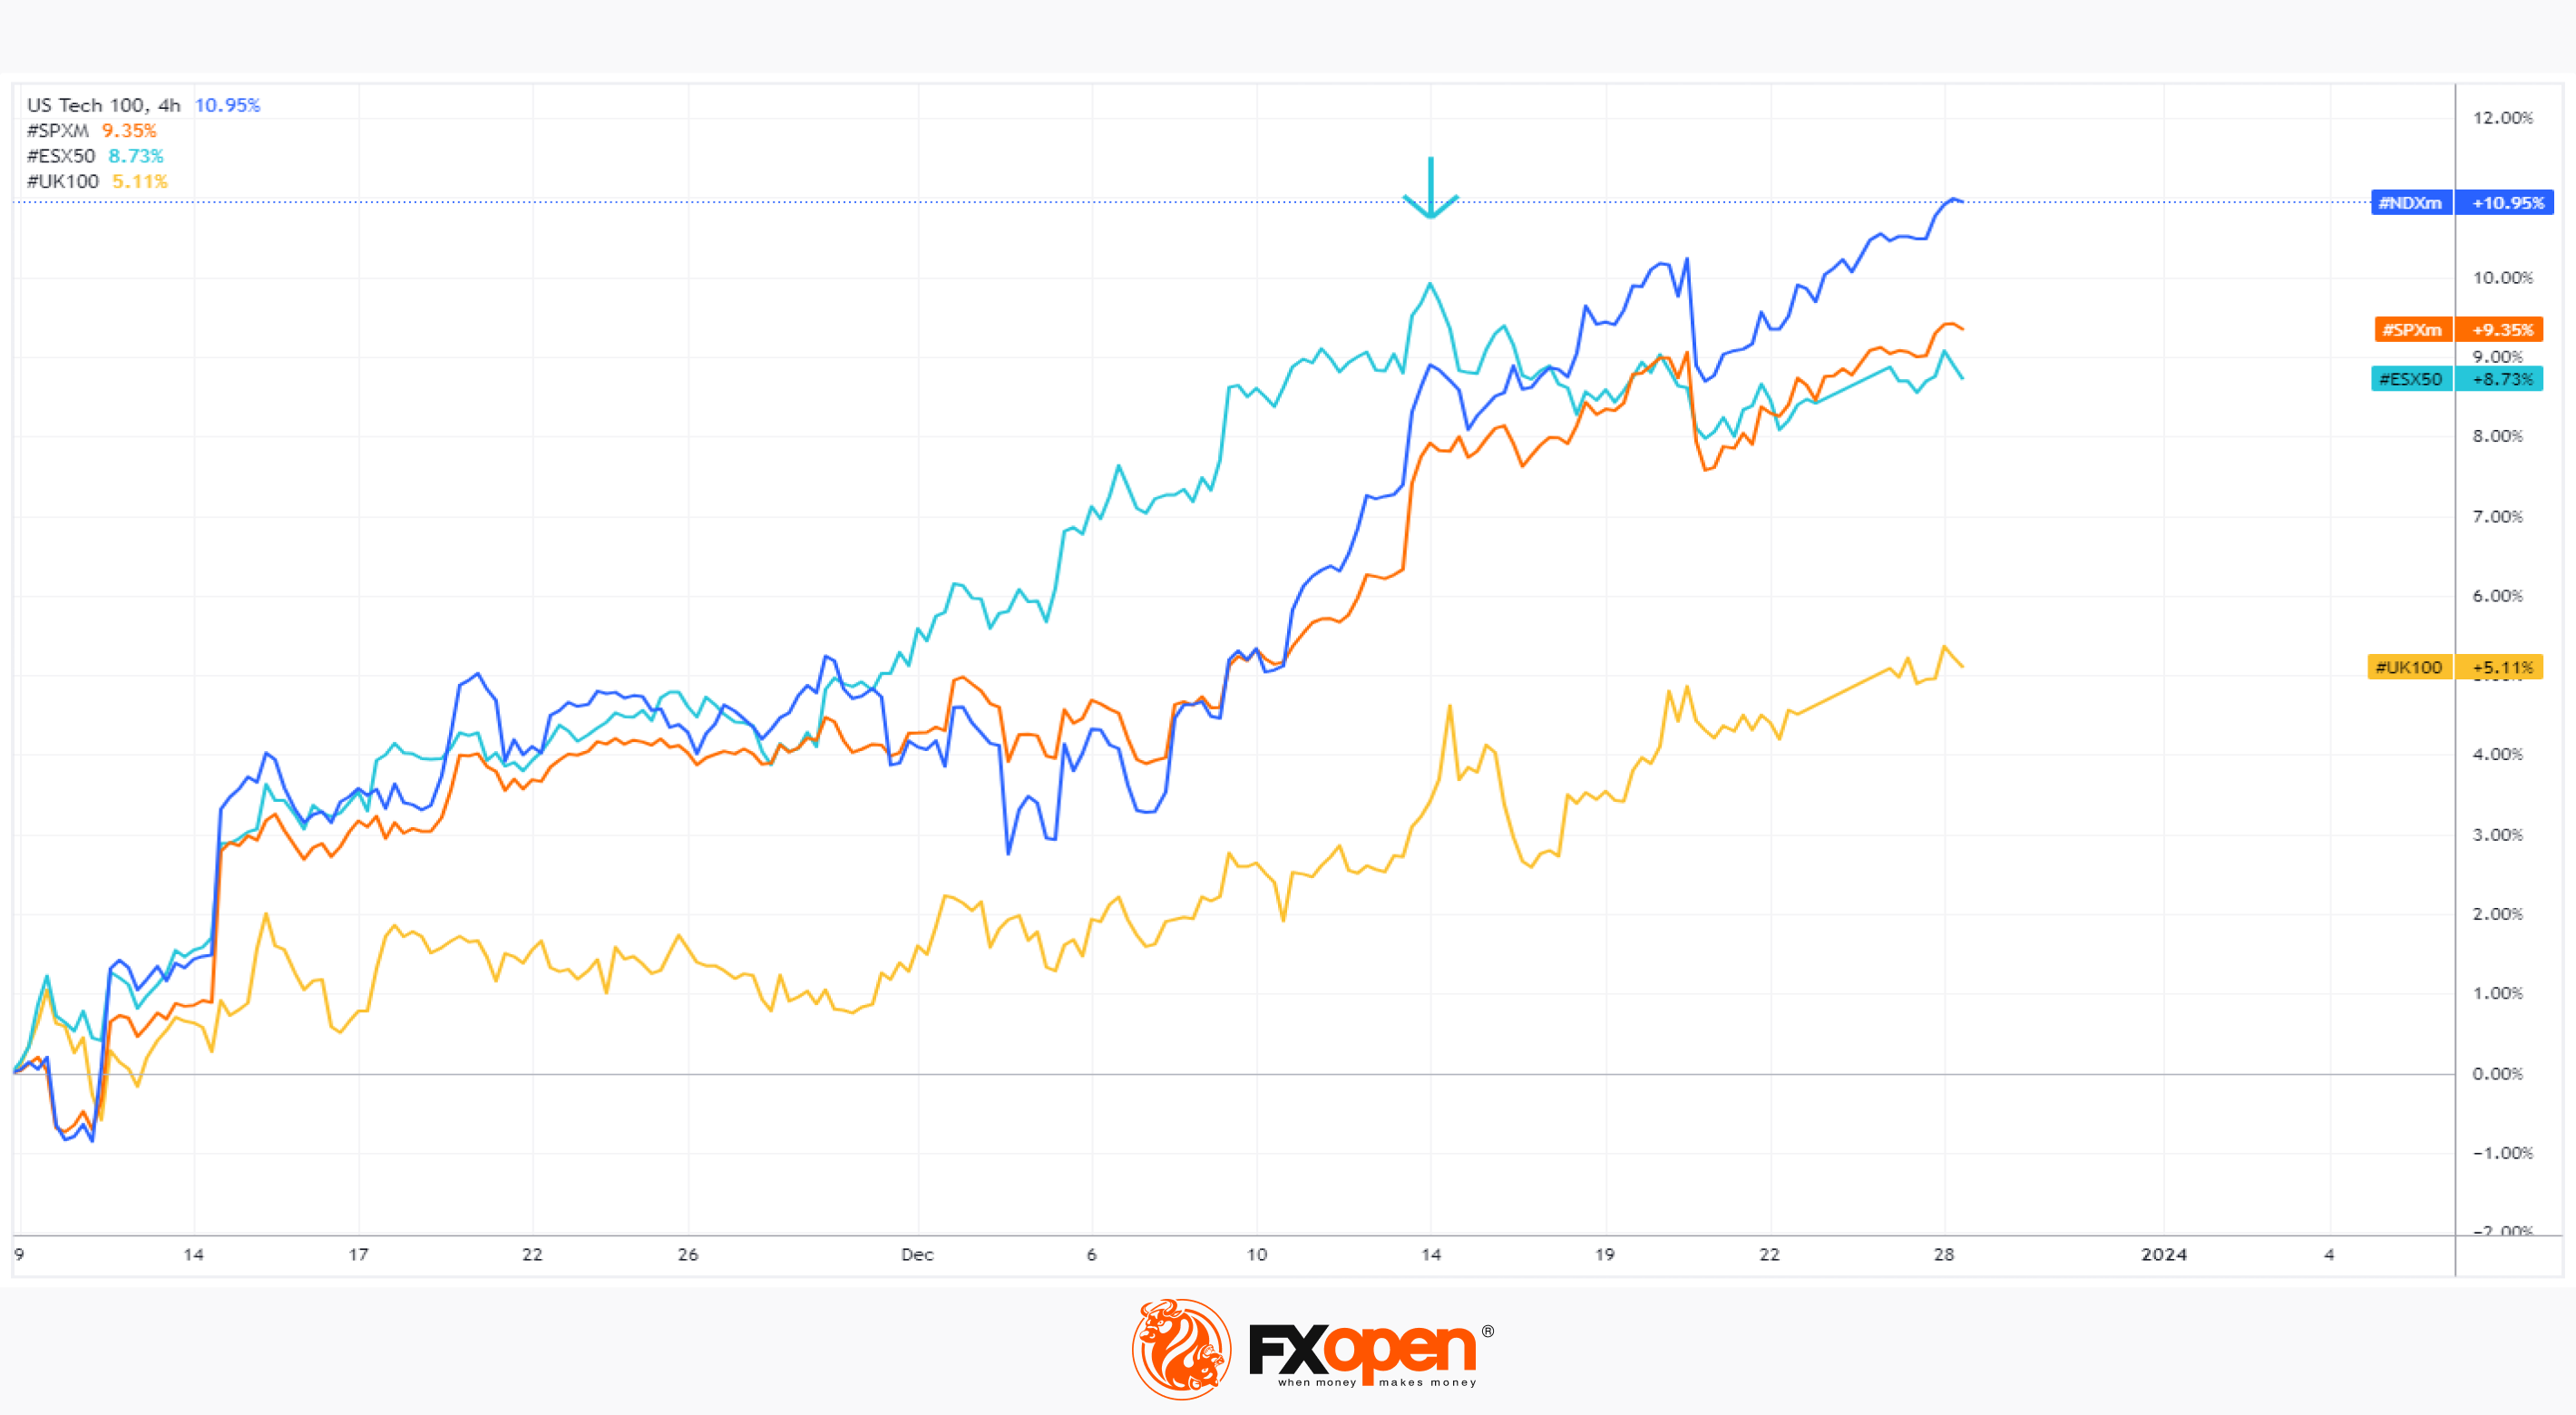
As the comparison chart shows, the ESX50 lags behind the US500. And this trend has been observed since mid-December, a period when central banks around the world published interest rate decisions and set expectations for the future. The divergence suggests that Europe's central bankers are in no rush to join the US turn to lower interest rates — even as investors continue to insist that they will have to accept easier monetary policy soon enough.
According to Bloomberg, after Federal Reserve Chairman Jerome Powell signalled that the focus is now on lowering borrowing costs, colleagues from Frankfurt to London said that a further slowdown in inflation cannot be taken for granted. That is, for now in Europe, policy easing is not yet on the agenda.
“We should absolutely not lower our guard,” European Central Bank President Christine Lagarde told reporters in December, while her Bank of England counterpart Andrew Bailey noted there was “still work to be done” in the fight to rein in consumer prices.
The chart shows that overall Western stock markets were positive in December, but a comparative analysis allows us to make interesting observations:
the ESX50 index was the top gainer in December;
but after a series of central bank meetings in the middle of the month (shown by the arrow), the lead was lost. While the S&P 500 is in close proximity to an all-time high, European stocks have lost bullish momentum.
It is possible that the mid-December highs will prove to be important resistance. And if a correction occurs in the stock market (which will be a reason to write about the end of the Santa rally), then the ESX50 will again be a leader, but in a downward trend.
To benefit from the rise and fall of stock markets around the world, consider enlisting the services of a trusted broker like FXOpen.
CFDs are complex instruments and come with a high risk of losing your money.
This article represents the opinion of the Companies operating under the FXOpen brand only. It is not to be construed as an offer, solicitation, or recommendation with respect to products and services provided by the Companies operating under the FXOpen brand, nor is it to be considered financial advice.
European Stock Index Shows Signs of Weakness
As the comparison chart shows, the ESX50 lags behind the US500. And this trend has been observed since mid-December, a period when central banks around the world published interest rate decisions and set expectations for the future. The divergence suggests that Europe's central bankers are in no rush to join the US turn to lower interest rates — even as investors continue to insist that they will have to accept easier monetary policy soon enough.
According to Bloomberg, after Federal Reserve Chairman Jerome Powell signalled that the focus is now on lowering borrowing costs, colleagues from Frankfurt to London said that a further slowdown in inflation cannot be taken for granted. That is, for now in Europe, policy easing is not yet on the agenda.
“We should absolutely not lower our guard,” European Central Bank President Christine Lagarde told reporters in December, while her Bank of England counterpart Andrew Bailey noted there was “still work to be done” in the fight to rein in consumer prices.
The chart shows that overall Western stock markets were positive in December, but a comparative analysis allows us to make interesting observations:
the ESX50 index was the top gainer in December;
but after a series of central bank meetings in the middle of the month (shown by the arrow), the lead was lost. While the S&P 500 is in close proximity to an all-time high, European stocks have lost bullish momentum.
It is possible that the mid-December highs will prove to be important resistance. And if a correction occurs in the stock market (which will be a reason to write about the end of the Santa rally), then the ESX50 will again be a leader, but in a downward trend.
To benefit from the rise and fall of stock markets around the world, consider enlisting the services of a trusted broker like FXOpen.
CFDs are complex instruments and come with a high risk of losing your money.
This article represents the opinion of the Companies operating under the FXOpen brand only. It is not to be construed as an offer, solicitation, or recommendation with respect to products and services provided by the Companies operating under the FXOpen brand, nor is it to be considered financial advice.
#marketanalysis #MarketNews #tradingforex
USD/JPY Analysis: Outlook for 2024
The Japanese yen has been one of the worst performing currencies over the past couple of years. The situation could improve in 2024, writes WSJ.
The yen has lost about 20% against the dollar since the end of 2021, underperforming other major currencies. The reason is that Japan's central bank kept interest rates ultra-low while most of its peers raised them aggressively. This was possible because it did not grow so rapidly in Japan. Japan's core inflation rate, which does not include fresh produce, was 2.5% in November. Although this is already above its 2% inflation target, the Bank of Japan is reluctant to raise interest rates too quickly for fear of a hit to the economy.
But the situation may change in 2024. The central bank has already made several changes to its “yield curve control” policy in the bond market. And the yen has risen about 7% against the dollar since mid-November, partly because traders expect the Bank of Japan to continue reforms. On the other hand, the dollar may weaken, including due to the expected easing of Fed policy.
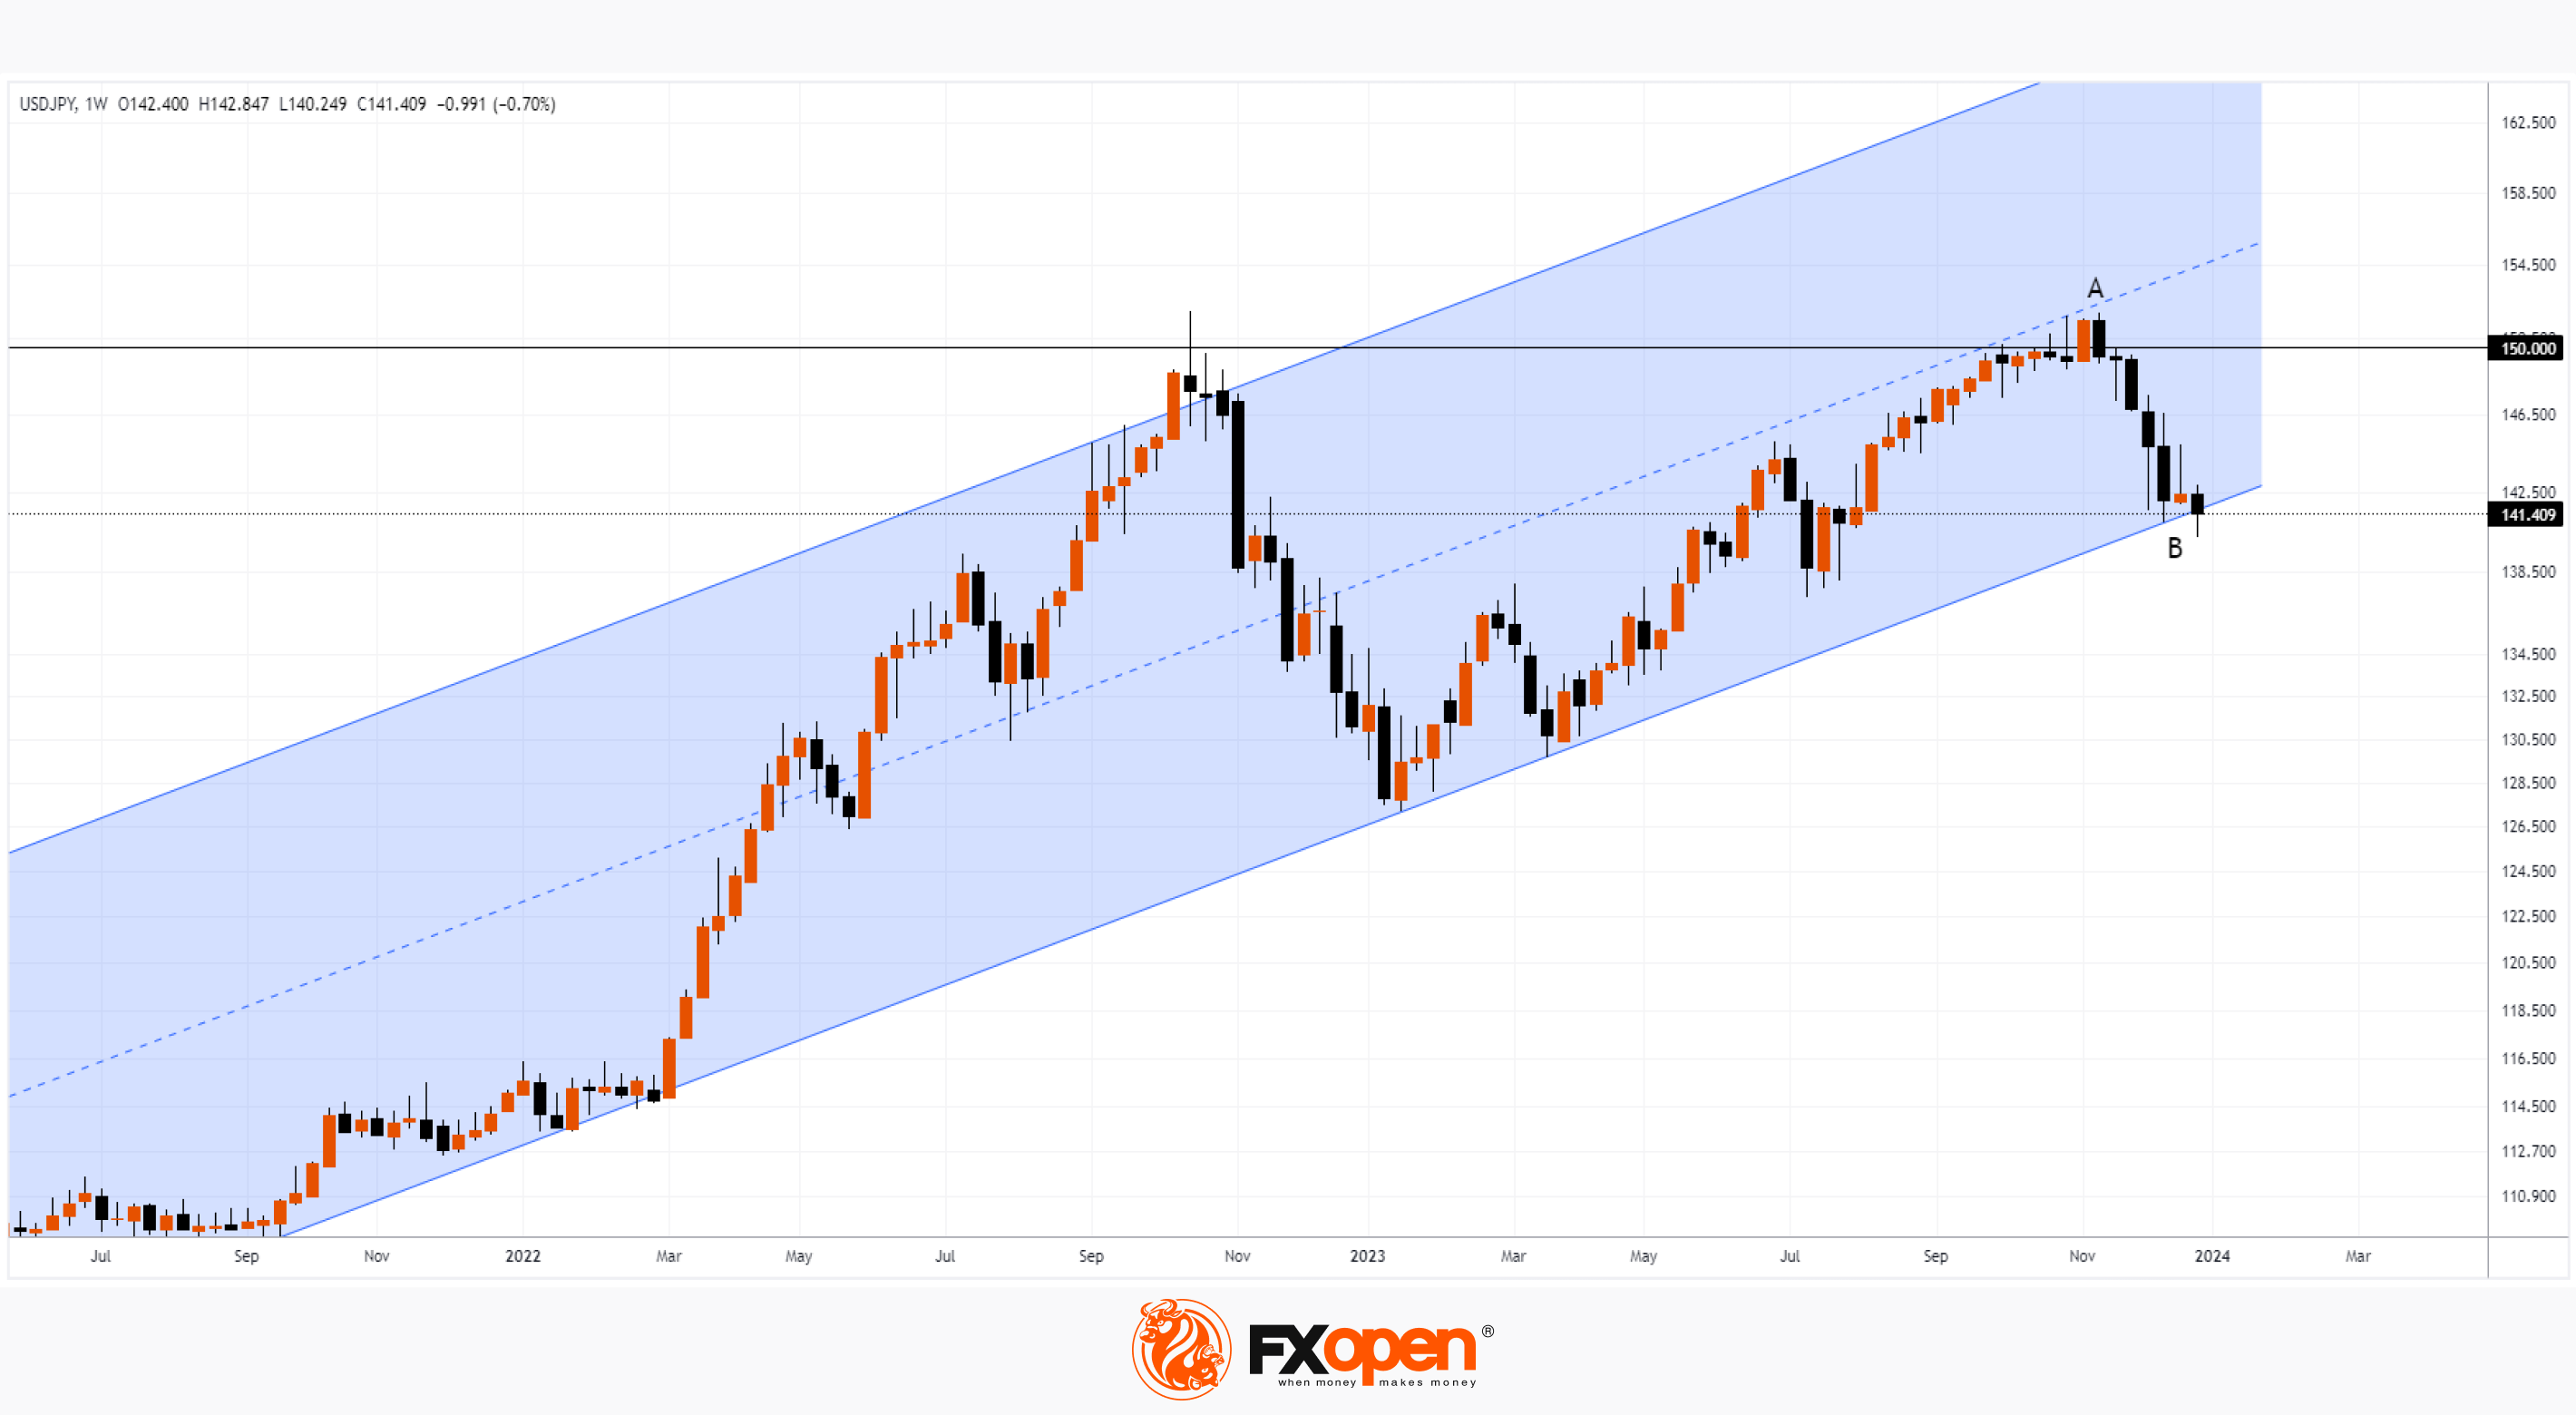
From a technical analysis point of view:
→ the price is within the ascending channel (shown in blue);
→ in 2022 and 2023, 2 peaks were formed near the psychological mark of 150 yen per dollar. Both times the price tried to break higher, but was unsuccessful - which confirms the importance of this level;
→ when the second top was formed, the price also tested the median line, which acted as resistance;
→ at the end of the year the price is at the lower limit - support may be expected from it.
Thus, there is a scenario in which there will be a technical rebound from the lower line of the channel - it describes an important trend lasting from 2021. If the rebound is weak (for example, no higher than 50% of the decline in A→B), then the threat of a bearish breakout of this line may increase. Please note that growth towards top A occurs at a slow pace, and as it falls towards point B, the candles expand - a potential bearish sign.
To benefit from the rise and fall of currency rates, consider enlisting the services of a trusted broker like FXOpen.
CFDs are complex instruments and come with a high risk of losing your money.
USD/JPY Analysis: Outlook for 2024
The Japanese yen has been one of the worst performing currencies over the past couple of years. The situation could improve in 2024, writes WSJ.
The yen has lost about 20% against the dollar since the end of 2021, underperforming other major currencies. The reason is that Japan's central bank kept interest rates ultra-low while most of its peers raised them aggressively. This was possible because it did not grow so rapidly in Japan. Japan's core inflation rate, which does not include fresh produce, was 2.5% in November. Although this is already above its 2% inflation target, the Bank of Japan is reluctant to raise interest rates too quickly for fear of a hit to the economy.
But the situation may change in 2024. The central bank has already made several changes to its “yield curve control” policy in the bond market. And the yen has risen about 7% against the dollar since mid-November, partly because traders expect the Bank of Japan to continue reforms. On the other hand, the dollar may weaken, including due to the expected easing of Fed policy.
From a technical analysis point of view:
→ the price is within the ascending channel (shown in blue);
→ in 2022 and 2023, 2 peaks were formed near the psychological mark of 150 yen per dollar. Both times the price tried to break higher, but was unsuccessful - which confirms the importance of this level;
→ when the second top was formed, the price also tested the median line, which acted as resistance;
→ at the end of the year the price is at the lower limit - support may be expected from it.
Thus, there is a scenario in which there will be a technical rebound from the lower line of the channel - it describes an important trend lasting from 2021. If the rebound is weak (for example, no higher than 50% of the decline in A→B), then the threat of a bearish breakout of this line may increase. Please note that growth towards top A occurs at a slow pace, and as it falls towards point B, the candles expand - a potential bearish sign.
To benefit from the rise and fall of currency rates, consider enlisting the services of a trusted broker like FXOpen.
CFDs are complex instruments and come with a high risk of losing your money.
#marketanalysis #currencymarket #tradingtips
Market Analysis: AUD/USD and NZD/USD Regain Strength
🔸The Aussie Dollar started a fresh increase above the 0.6760 and 0.6800 levels against the US Dollar.
🔸There is a bullish flag forming with resistance near 0.6845 on the hourly chart of AUD/USD at FXOpen.
🔸NZD/USD is gaining bullish momentum above the 0.6320 support.
🔸There is a short-term contracting triangle forming with support near 0.6320 on the hourly chart of NZD/USD at FXOpen.
🔗Read the full analysis: https://cutt.ly/3wF5cNEl
To benefit from the rise and fall of currency rates, consider enlisting the services of a trusted broker like FXOpen.
CFDs are complex instruments and come with a high risk of losing your money.
Market Analysis: AUD/USD and NZD/USD Regain Strength
🔸The Aussie Dollar started a fresh increase above the 0.6760 and 0.6800 levels against the US Dollar.
🔸There is a bullish flag forming with resistance near 0.6845 on the hourly chart of AUD/USD at FXOpen.
🔸NZD/USD is gaining bullish momentum above the 0.6320 support.
🔸There is a short-term contracting triangle forming with support near 0.6320 on the hourly chart of NZD/USD at FXOpen.
🔗Read the full analysis: https://cutt.ly/3wF5cNEl
To benefit from the rise and fall of currency rates, consider enlisting the services of a trusted broker like FXOpen.
CFDs are complex instruments and come with a high risk of losing your money.
Market Pulse
Market Analysis: AUD/USD and NZD/USD Regain Strength
AUD/USD is moving higher and might climb further above 0.6870. NZD/USD is also rising and could extend its increase above the 0.6370 resistance zone. Important Takeaways for AUD USD and NZD USD Analysis TodayThe Aussie Dollar started a fresh increase above…
#marketanalysis #bitcoin #crypto #BTCUSD
Bitcoin Price Starts the Year with Bullish Sentiment
The first Bitcoin block, also known as the genesis block, was mined on January 3, 2009 at 18:15:05 UTC. 15 years have passed and the value of Bitcoin is in the tens of thousands of US dollars.
In the first days of 2023, bitcoin was worth about $16,600 — and, as it turned out, this was the minimum. After all, then the BTC/USD rate went up and by the end of 2023 reached $44,000. The change was more than +150%!
On January 3, 2024, the price was already above $45,000, giving hope to the bulls that 2024 will be no less successful. If in the coming 2024 BTC/USD repeats the progress of last year, this will mean exceeding the psychological mark of USD 100,000 per coin!
What will influence the price of Bitcoin in the first half of the year?
→ Expected approval of applications for BTC ETF by the SEC regulator. On the one hand, approval will allow a wide range of people to simply invest in Bitcoin, which should increase demand. On the other hand, waiting for approval takes too long. And if it happens, it is possible that a price reduction may occur according to the “buy rumours, sell facts” principle.
→ Approximately, halving will occur in April. This will happen after the 210,000th block is mined. After the halving, miners' block rewards will be reduced from 6.25 BTC to 3.125 BTC. It is believed that this should reduce the supply of coins on the market — accordingly, the price of BTC/USD may rise (and history suggests this).
→ Fed rate cut. Easing monetary policy can serve as a driver for the growth of investment in risky assets, which is Bitcoin.
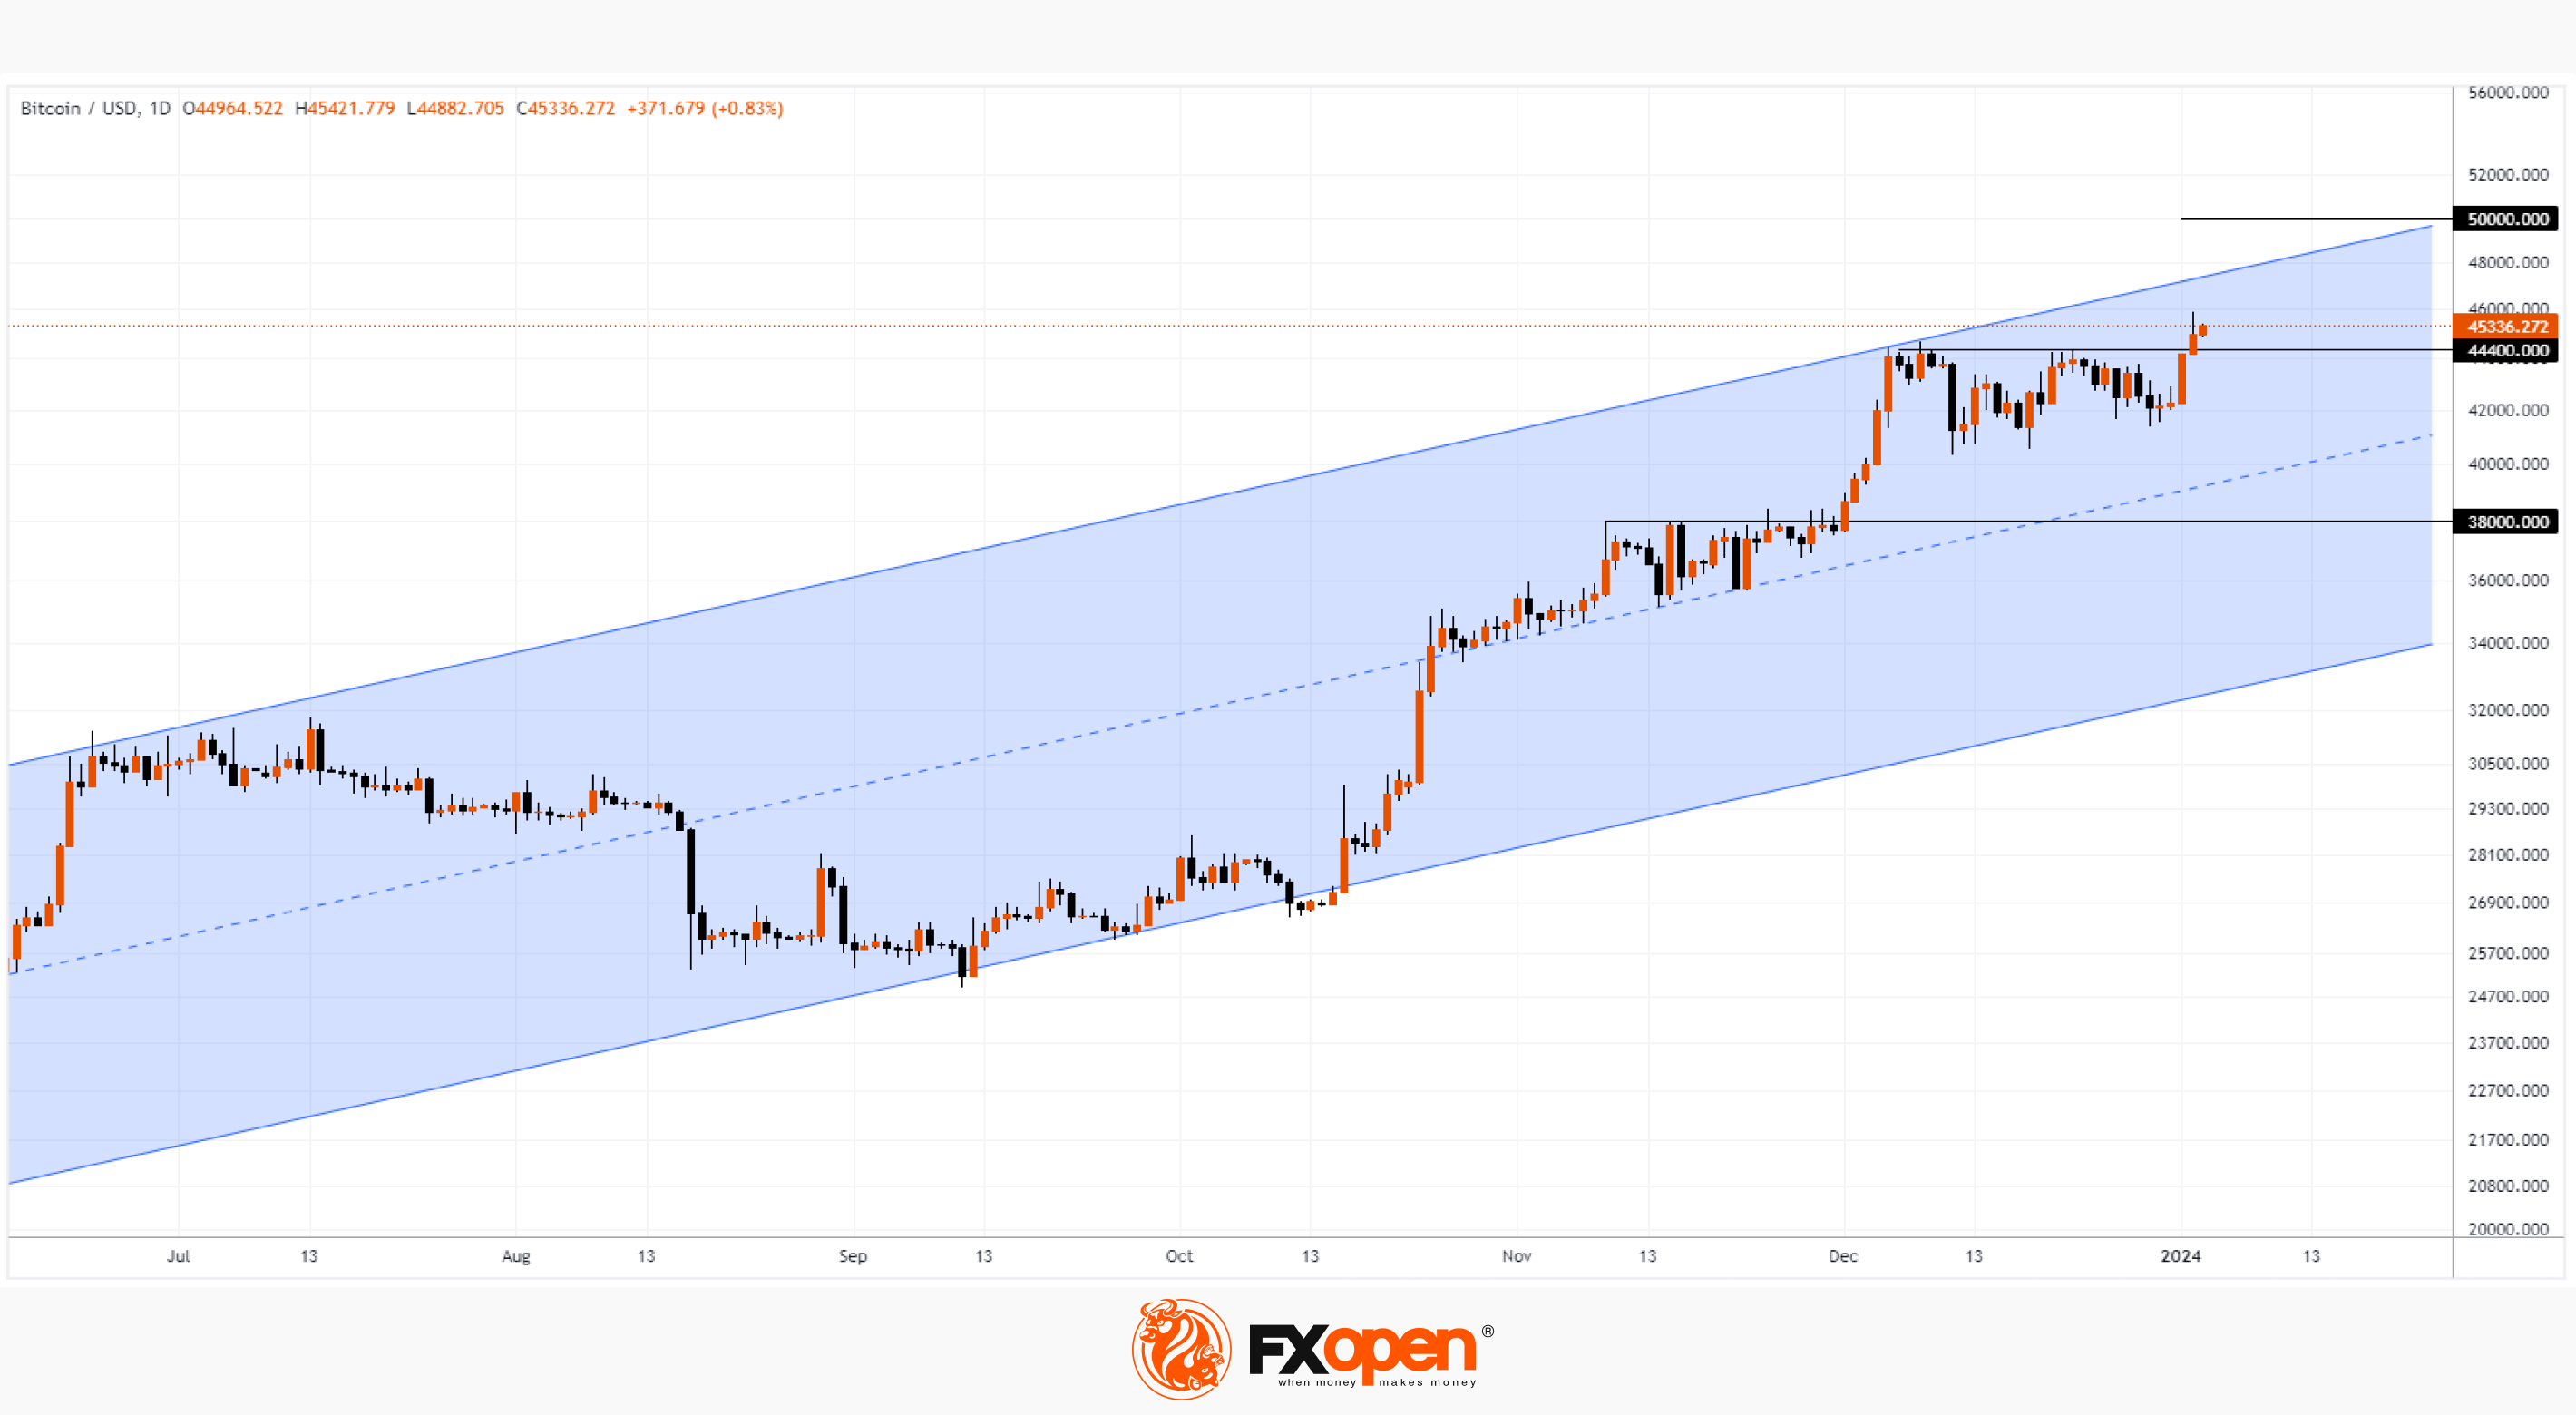
The BTC/USD daily chart shows that:
→ the price of Bitcoin is within the ascending channel;
→ the price broke through the resistance level of $44,400 per coin.
In this case, a comparison with the recent breakdown of the level of 38,000 is appropriate. If the price acts in the same bullish manner, it may consolidate above 44,400, without even testing this former resistance level.
If the demand for Bitcoin does not exhaust itself, the price may reach the upper boundary of the channel and drift towards the psychological mark of $50k. A return below the $44,000 level will mean a big setback for the bulls and will give reason to consider bearish scenarios, up to a breakdown of the current channel.
To benefit from the rise and fall of crypto prices, consider enlisting the services of a trusted broker like FXOpen.
CFDs are complex instruments and come with a high risk of losing your money.
This article represents the opinion of the Companies operating under the FXOpen brand only. It is not to be construed as an offer, solicitation, or recommendation with respect to products and services provided by the Companies operating under the FXOpen brand, nor is it to be considered financial advice.
At FXOpen UK and FXOpen AU, Cryptocurrency CFDs are only available for trading by those clients categorised as Professional clients under FCA Rules and Professional clients under ASIC Rules, respectively. They are not available for trading by Retail clients.
Bitcoin Price Starts the Year with Bullish Sentiment
The first Bitcoin block, also known as the genesis block, was mined on January 3, 2009 at 18:15:05 UTC. 15 years have passed and the value of Bitcoin is in the tens of thousands of US dollars.
In the first days of 2023, bitcoin was worth about $16,600 — and, as it turned out, this was the minimum. After all, then the BTC/USD rate went up and by the end of 2023 reached $44,000. The change was more than +150%!
On January 3, 2024, the price was already above $45,000, giving hope to the bulls that 2024 will be no less successful. If in the coming 2024 BTC/USD repeats the progress of last year, this will mean exceeding the psychological mark of USD 100,000 per coin!
What will influence the price of Bitcoin in the first half of the year?
→ Expected approval of applications for BTC ETF by the SEC regulator. On the one hand, approval will allow a wide range of people to simply invest in Bitcoin, which should increase demand. On the other hand, waiting for approval takes too long. And if it happens, it is possible that a price reduction may occur according to the “buy rumours, sell facts” principle.
→ Approximately, halving will occur in April. This will happen after the 210,000th block is mined. After the halving, miners' block rewards will be reduced from 6.25 BTC to 3.125 BTC. It is believed that this should reduce the supply of coins on the market — accordingly, the price of BTC/USD may rise (and history suggests this).
→ Fed rate cut. Easing monetary policy can serve as a driver for the growth of investment in risky assets, which is Bitcoin.
The BTC/USD daily chart shows that:
→ the price of Bitcoin is within the ascending channel;
→ the price broke through the resistance level of $44,400 per coin.
In this case, a comparison with the recent breakdown of the level of 38,000 is appropriate. If the price acts in the same bullish manner, it may consolidate above 44,400, without even testing this former resistance level.
If the demand for Bitcoin does not exhaust itself, the price may reach the upper boundary of the channel and drift towards the psychological mark of $50k. A return below the $44,000 level will mean a big setback for the bulls and will give reason to consider bearish scenarios, up to a breakdown of the current channel.
To benefit from the rise and fall of crypto prices, consider enlisting the services of a trusted broker like FXOpen.
CFDs are complex instruments and come with a high risk of losing your money.
This article represents the opinion of the Companies operating under the FXOpen brand only. It is not to be construed as an offer, solicitation, or recommendation with respect to products and services provided by the Companies operating under the FXOpen brand, nor is it to be considered financial advice.
At FXOpen UK and FXOpen AU, Cryptocurrency CFDs are only available for trading by those clients categorised as Professional clients under FCA Rules and Professional clients under ASIC Rules, respectively. They are not available for trading by Retail clients.
#marketanalysis #tradingforex #trading
Traders Adjust Their Expectations for Fed Action
From the beginning of November to the end of December 2023, the dollar index futures price fell by approximately 5.5%, according to the CME exchange. The weakening of the USD was caused by the sentiment of traders who expected the Fed to cut interest rates in March. As a result of the sentiment that prevailed at the end of 2023, stock indices, gold (setting a historical maximum on December 4) and cryptocurrencies rose.
However, the start of 2024 indicated a sharp change in sentiment, with the dollar index futures price rising more than 1% during the January 3-4 sessions.
This can be interpreted as:
→ during the pre-holiday period, there was a certain emotional component that helped to look into the future with optimism;
→ after the end of the holidays, market participants adjusted their expectations regarding the easing of the Fed's actions.
Data released yesterday showed that there is no clear indication that the Fed may start cutting rates, as its members still see the need for policy to remain restrictive for some time.
That is, in the first days of 2024, there was a correction of bullish sentiment at the end of 2023. In the cryptocurrency market, which is characterised by a high degree of margin (opening positions with borrowed funds), the correction turned into an avalanche of sales — the BTC/USD rate dropped rapidly to the level of $41,000, forming a false bullish breakout of the consolidation zone at the end of 2023, which we wrote about yesterday .
We also note the decline in the NASDAQ technology stock index, which, according to Bloomberg, showed the worst start to the year since 2001 (the time of the dot-com crash).
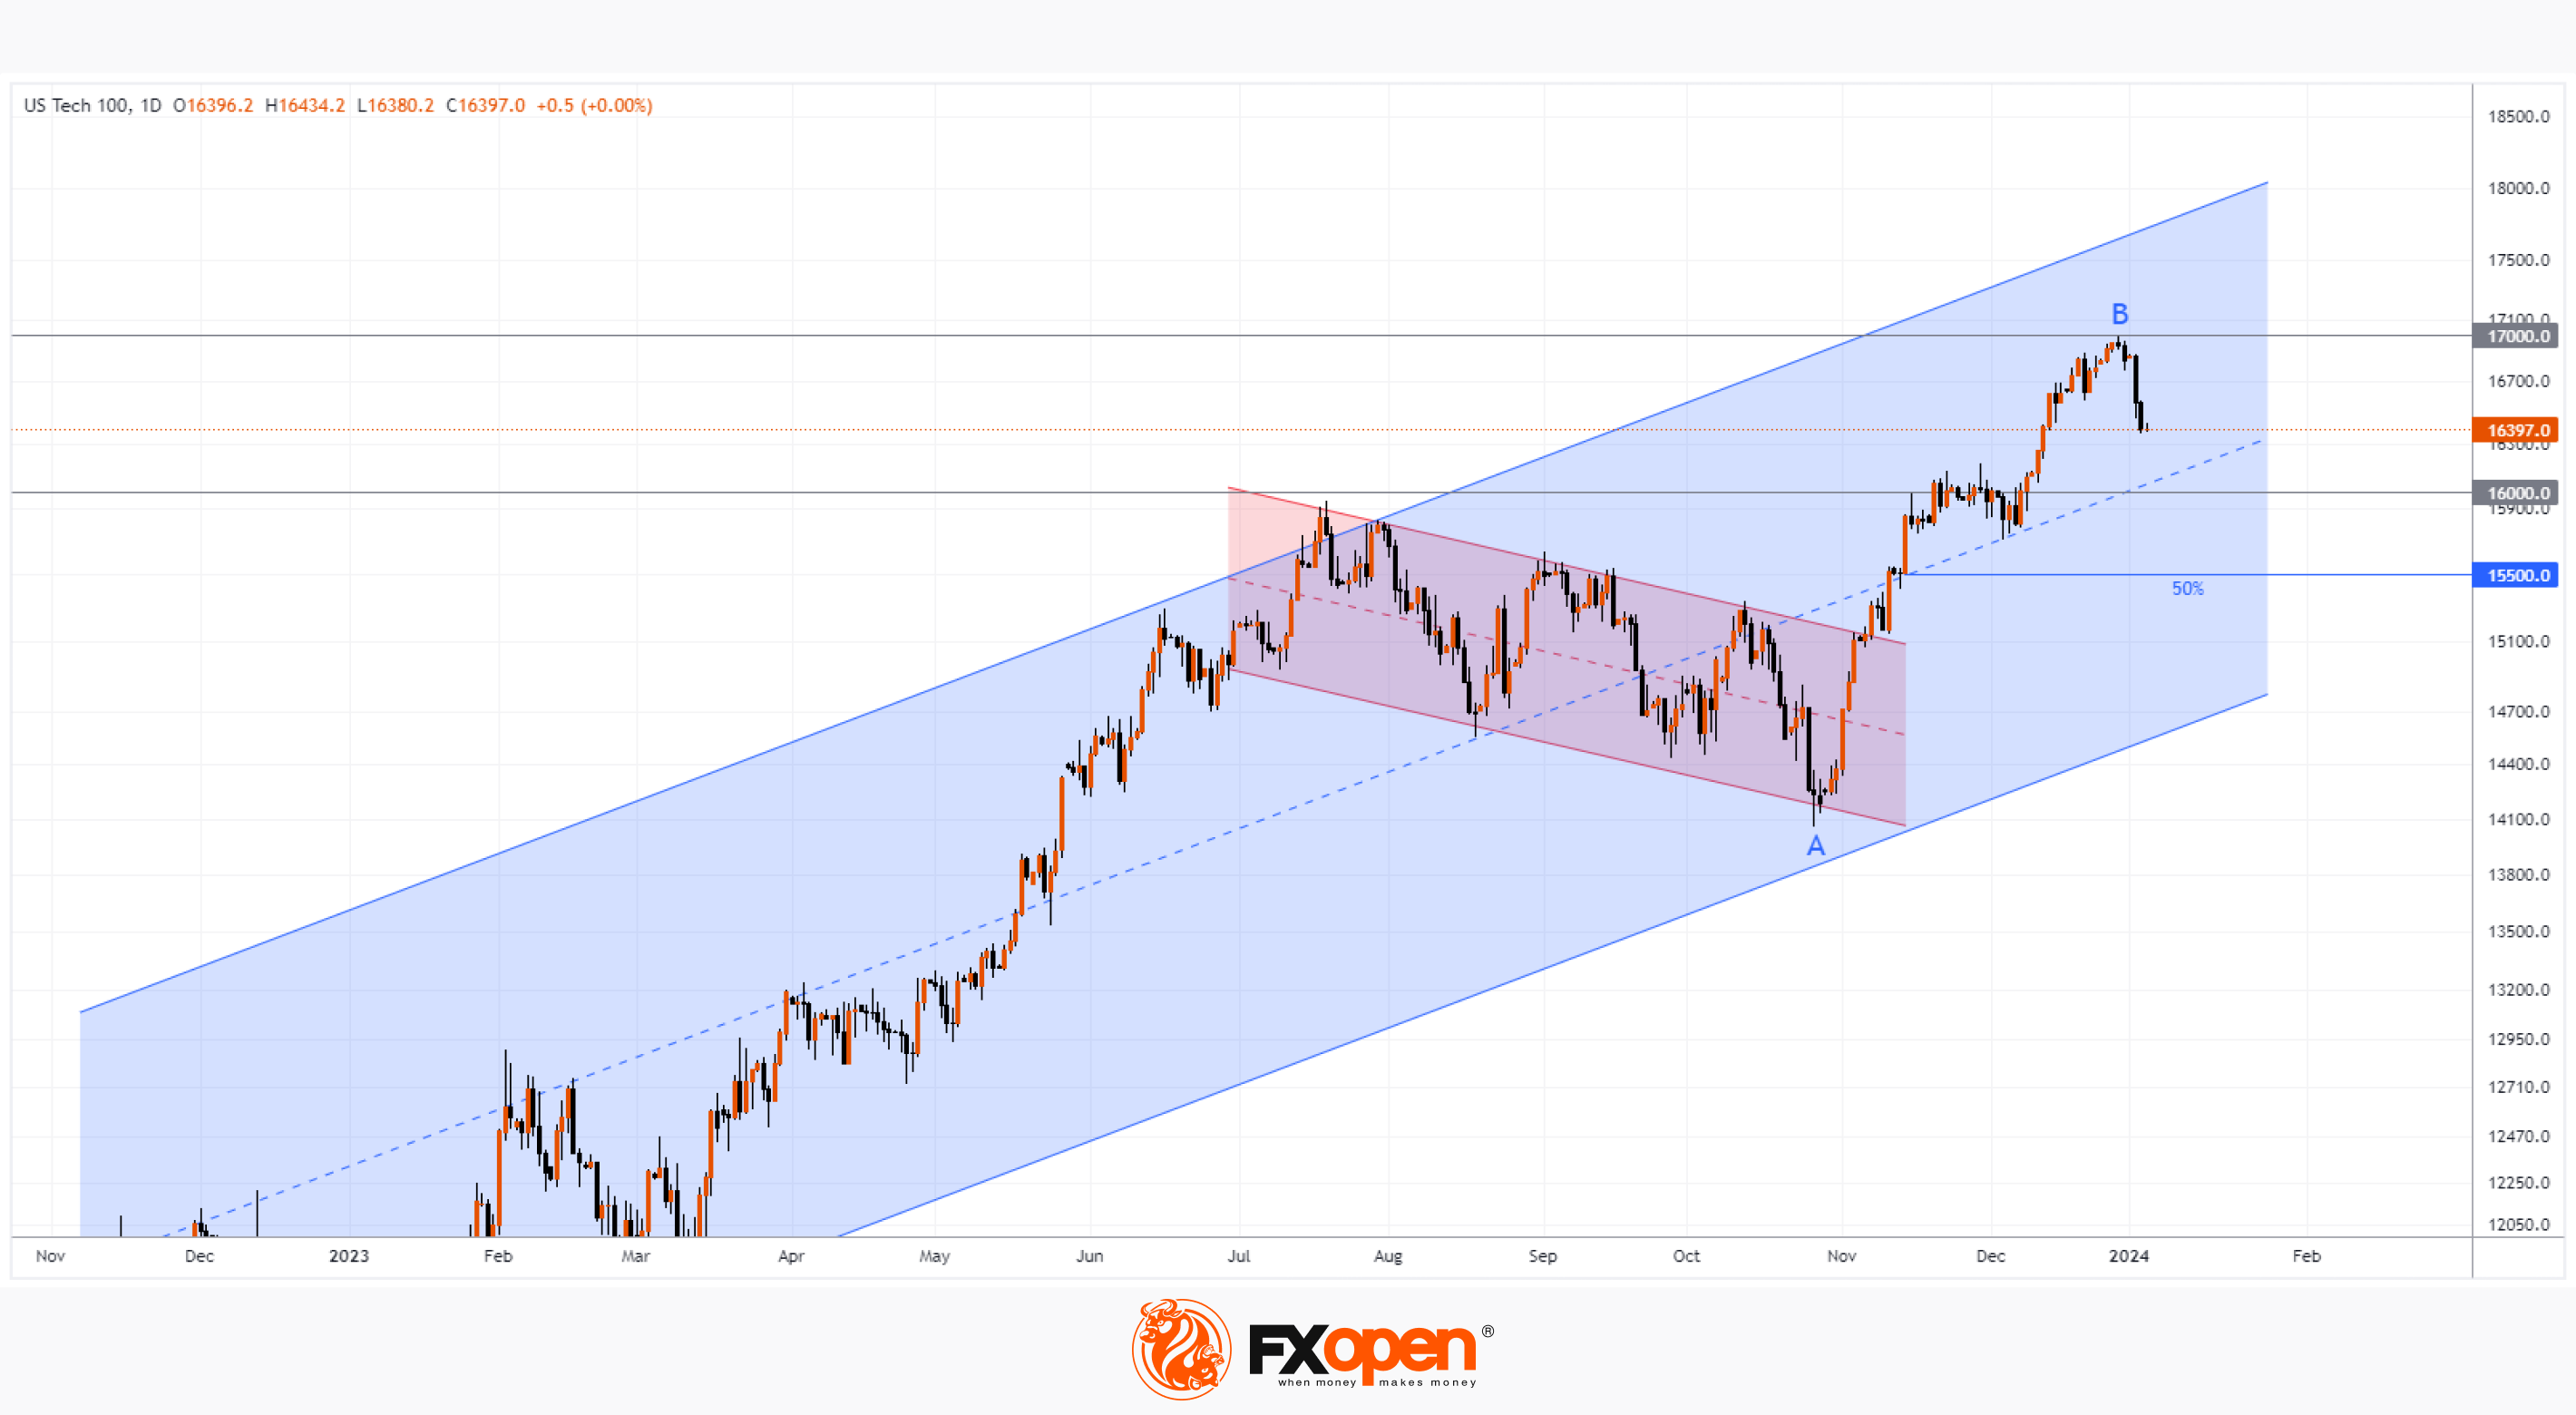
The NASDAQ-100 chart shows that:
→ the stock index price is still within the uptrend (shown in blue);
→ the price was within the intermediate correction (shown in red), forming a flag pattern;
→ the psychological level of 17,000 served as resistance.
The price may be supported by:
→ the psychological level of 16,000, which was broken by the bulls after some consolidation in the second half of December;
→ the median line of the ascending channel;
→ a level of 50% of the A-B growth impulse, located around the level of 15,500.
Price action near these levels (if reached) will provide more valuable information about how much sentiment has changed since the bullish end to 2023.
To benefit from fluctuations in stock market indices, consider enlisting the services of a trusted broker like FXOpen.
CFDs are complex instruments and come with a high risk of losing your money.
This article represents the opinion of the Companies operating under the FXOpen brand only. It is not to be construed as an offer, solicitation, or recommendation with respect to products and services provided by the Companies operating under the FXOpen brand, nor is it to be considered financial advice.
At FXOpen UK and FXOpen AU, Cryptocurrency CFDs are only available for trading by those clients categorised as Professional clients under FCA Rules and Professional clients under ASIC Rules, respectively. They are not available for trading by Retail clients.
Traders Adjust Their Expectations for Fed Action
From the beginning of November to the end of December 2023, the dollar index futures price fell by approximately 5.5%, according to the CME exchange. The weakening of the USD was caused by the sentiment of traders who expected the Fed to cut interest rates in March. As a result of the sentiment that prevailed at the end of 2023, stock indices, gold (setting a historical maximum on December 4) and cryptocurrencies rose.
However, the start of 2024 indicated a sharp change in sentiment, with the dollar index futures price rising more than 1% during the January 3-4 sessions.
This can be interpreted as:
→ during the pre-holiday period, there was a certain emotional component that helped to look into the future with optimism;
→ after the end of the holidays, market participants adjusted their expectations regarding the easing of the Fed's actions.
Data released yesterday showed that there is no clear indication that the Fed may start cutting rates, as its members still see the need for policy to remain restrictive for some time.
That is, in the first days of 2024, there was a correction of bullish sentiment at the end of 2023. In the cryptocurrency market, which is characterised by a high degree of margin (opening positions with borrowed funds), the correction turned into an avalanche of sales — the BTC/USD rate dropped rapidly to the level of $41,000, forming a false bullish breakout of the consolidation zone at the end of 2023, which we wrote about yesterday .
We also note the decline in the NASDAQ technology stock index, which, according to Bloomberg, showed the worst start to the year since 2001 (the time of the dot-com crash).
The NASDAQ-100 chart shows that:
→ the stock index price is still within the uptrend (shown in blue);
→ the price was within the intermediate correction (shown in red), forming a flag pattern;
→ the psychological level of 17,000 served as resistance.
The price may be supported by:
→ the psychological level of 16,000, which was broken by the bulls after some consolidation in the second half of December;
→ the median line of the ascending channel;
→ a level of 50% of the A-B growth impulse, located around the level of 15,500.
Price action near these levels (if reached) will provide more valuable information about how much sentiment has changed since the bullish end to 2023.
To benefit from fluctuations in stock market indices, consider enlisting the services of a trusted broker like FXOpen.
CFDs are complex instruments and come with a high risk of losing your money.
This article represents the opinion of the Companies operating under the FXOpen brand only. It is not to be construed as an offer, solicitation, or recommendation with respect to products and services provided by the Companies operating under the FXOpen brand, nor is it to be considered financial advice.
At FXOpen UK and FXOpen AU, Cryptocurrency CFDs are only available for trading by those clients categorised as Professional clients under FCA Rules and Professional clients under ASIC Rules, respectively. They are not available for trading by Retail clients.
#AAPL #stocktrading #stockmarket #MarketNews
Analysts Downgrade AAPL Shares
According to Yahoo Finance, Barclays analysts downgraded AAPL shares to “underweight” and lowered their price forecast: they expect the share price to drop to USD 160 (although AAPL traded above USD 184 yesterday).
Analysts justified their decision by their expectations of a decrease in demand for new iPhone models. “Our checks remain negative on volumes and mix for iPhone 15, and we see no features or upgrades that are likely to make the iPhone 16 more compelling.”
The news caused AAPL's share price to fall 3.6% on Tuesday, its biggest one-day percentage drop since September, and the decline wiped out more than USD 107 billion in market value. Concerns are growing due to:
→ growing competition from companies such as Huawei Technologies Co;
→ strict measures by the Chinese government against foreign-made devices.
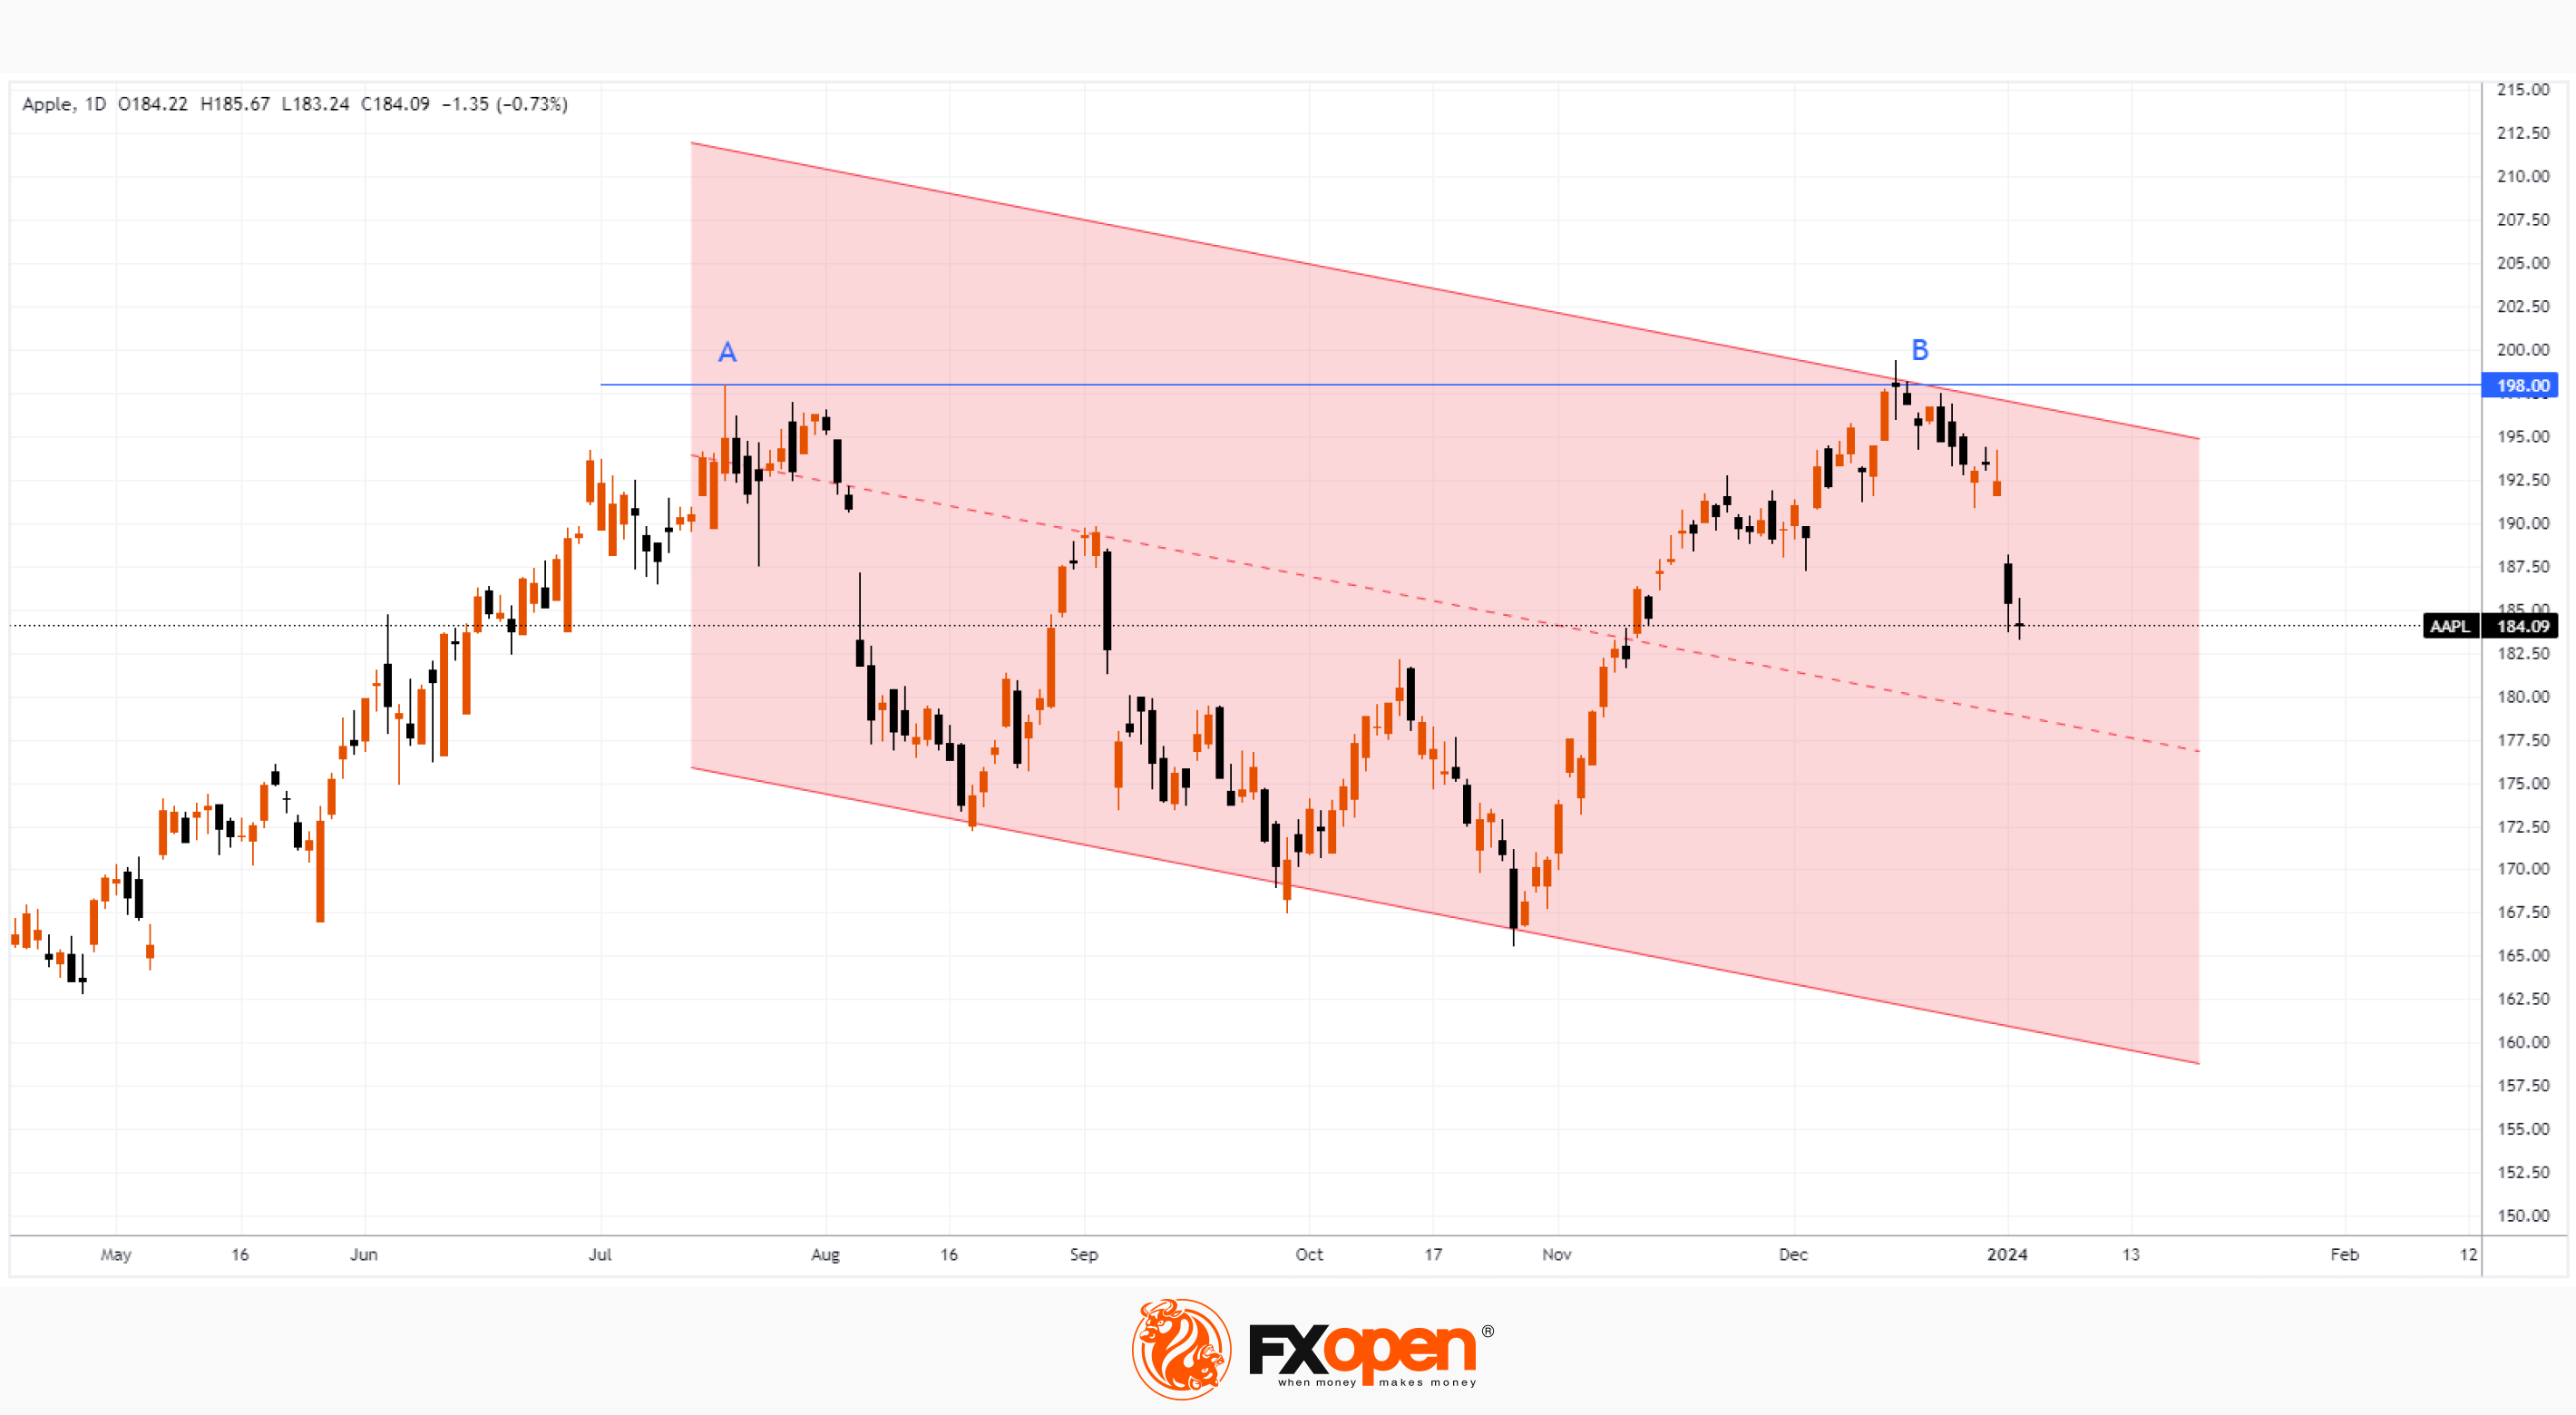
The graph shows that:
→ The price forms a downward channel, shown in red. We outlined the lower contour of this channel in the analysis of the AAPL share price on November 3. At the same time, we wrote about the emerging decline in sales of Apple products.
→ The price has formed an AB double top pattern. Moreover, the second peak is higher than the first, which forms a false bullish breakout - a threatening sign.
→ Comparing the performance of AAPL stock with the performance of the stock market index, we can see that the stock is actually underperforming the market in the second half of 2023.
Thus, there is reason to assume that if the price continues to develop within the contours indicated by the downward red channel, it will drop to the values predicted by Barclays analysts.
To benefit from the rise and fall of the world's hottest stocks, consider enlisting the services of a trusted broker like FXOpen.
CFDs are complex instruments and come with a high risk of losing your money.
This article represents the opinion of the Companies operating under the FXOpen brand only. It is not to be construed as an offer, solicitation, or recommendation with respect to products and services provided by the Companies operating under the FXOpen brand, nor is it to be considered financial advice.
Analysts Downgrade AAPL Shares
According to Yahoo Finance, Barclays analysts downgraded AAPL shares to “underweight” and lowered their price forecast: they expect the share price to drop to USD 160 (although AAPL traded above USD 184 yesterday).
Analysts justified their decision by their expectations of a decrease in demand for new iPhone models. “Our checks remain negative on volumes and mix for iPhone 15, and we see no features or upgrades that are likely to make the iPhone 16 more compelling.”
The news caused AAPL's share price to fall 3.6% on Tuesday, its biggest one-day percentage drop since September, and the decline wiped out more than USD 107 billion in market value. Concerns are growing due to:
→ growing competition from companies such as Huawei Technologies Co;
→ strict measures by the Chinese government against foreign-made devices.
The graph shows that:
→ The price forms a downward channel, shown in red. We outlined the lower contour of this channel in the analysis of the AAPL share price on November 3. At the same time, we wrote about the emerging decline in sales of Apple products.
→ The price has formed an AB double top pattern. Moreover, the second peak is higher than the first, which forms a false bullish breakout - a threatening sign.
→ Comparing the performance of AAPL stock with the performance of the stock market index, we can see that the stock is actually underperforming the market in the second half of 2023.
Thus, there is reason to assume that if the price continues to develop within the contours indicated by the downward red channel, it will drop to the values predicted by Barclays analysts.
To benefit from the rise and fall of the world's hottest stocks, consider enlisting the services of a trusted broker like FXOpen.
CFDs are complex instruments and come with a high risk of losing your money.
This article represents the opinion of the Companies operating under the FXOpen brand only. It is not to be construed as an offer, solicitation, or recommendation with respect to products and services provided by the Companies operating under the FXOpen brand, nor is it to be considered financial advice.
#marketanalysis #forextrading #USDJPY
USD/JPY: The Price Reaches Resistance at 145 Yen per US Dollar
As of Friday morning, the situation on the USD/JPY market deserves attention:
→ the US dollar is on course to demonstrate its strongest week since July 2023. The media writes that markets are adjusting expectations regarding the easing of monetary policy by the Fed.
→ The yen fell about 3% against the US dollar in the first week of the year, which could be its weakest weekly performance since August 2022.
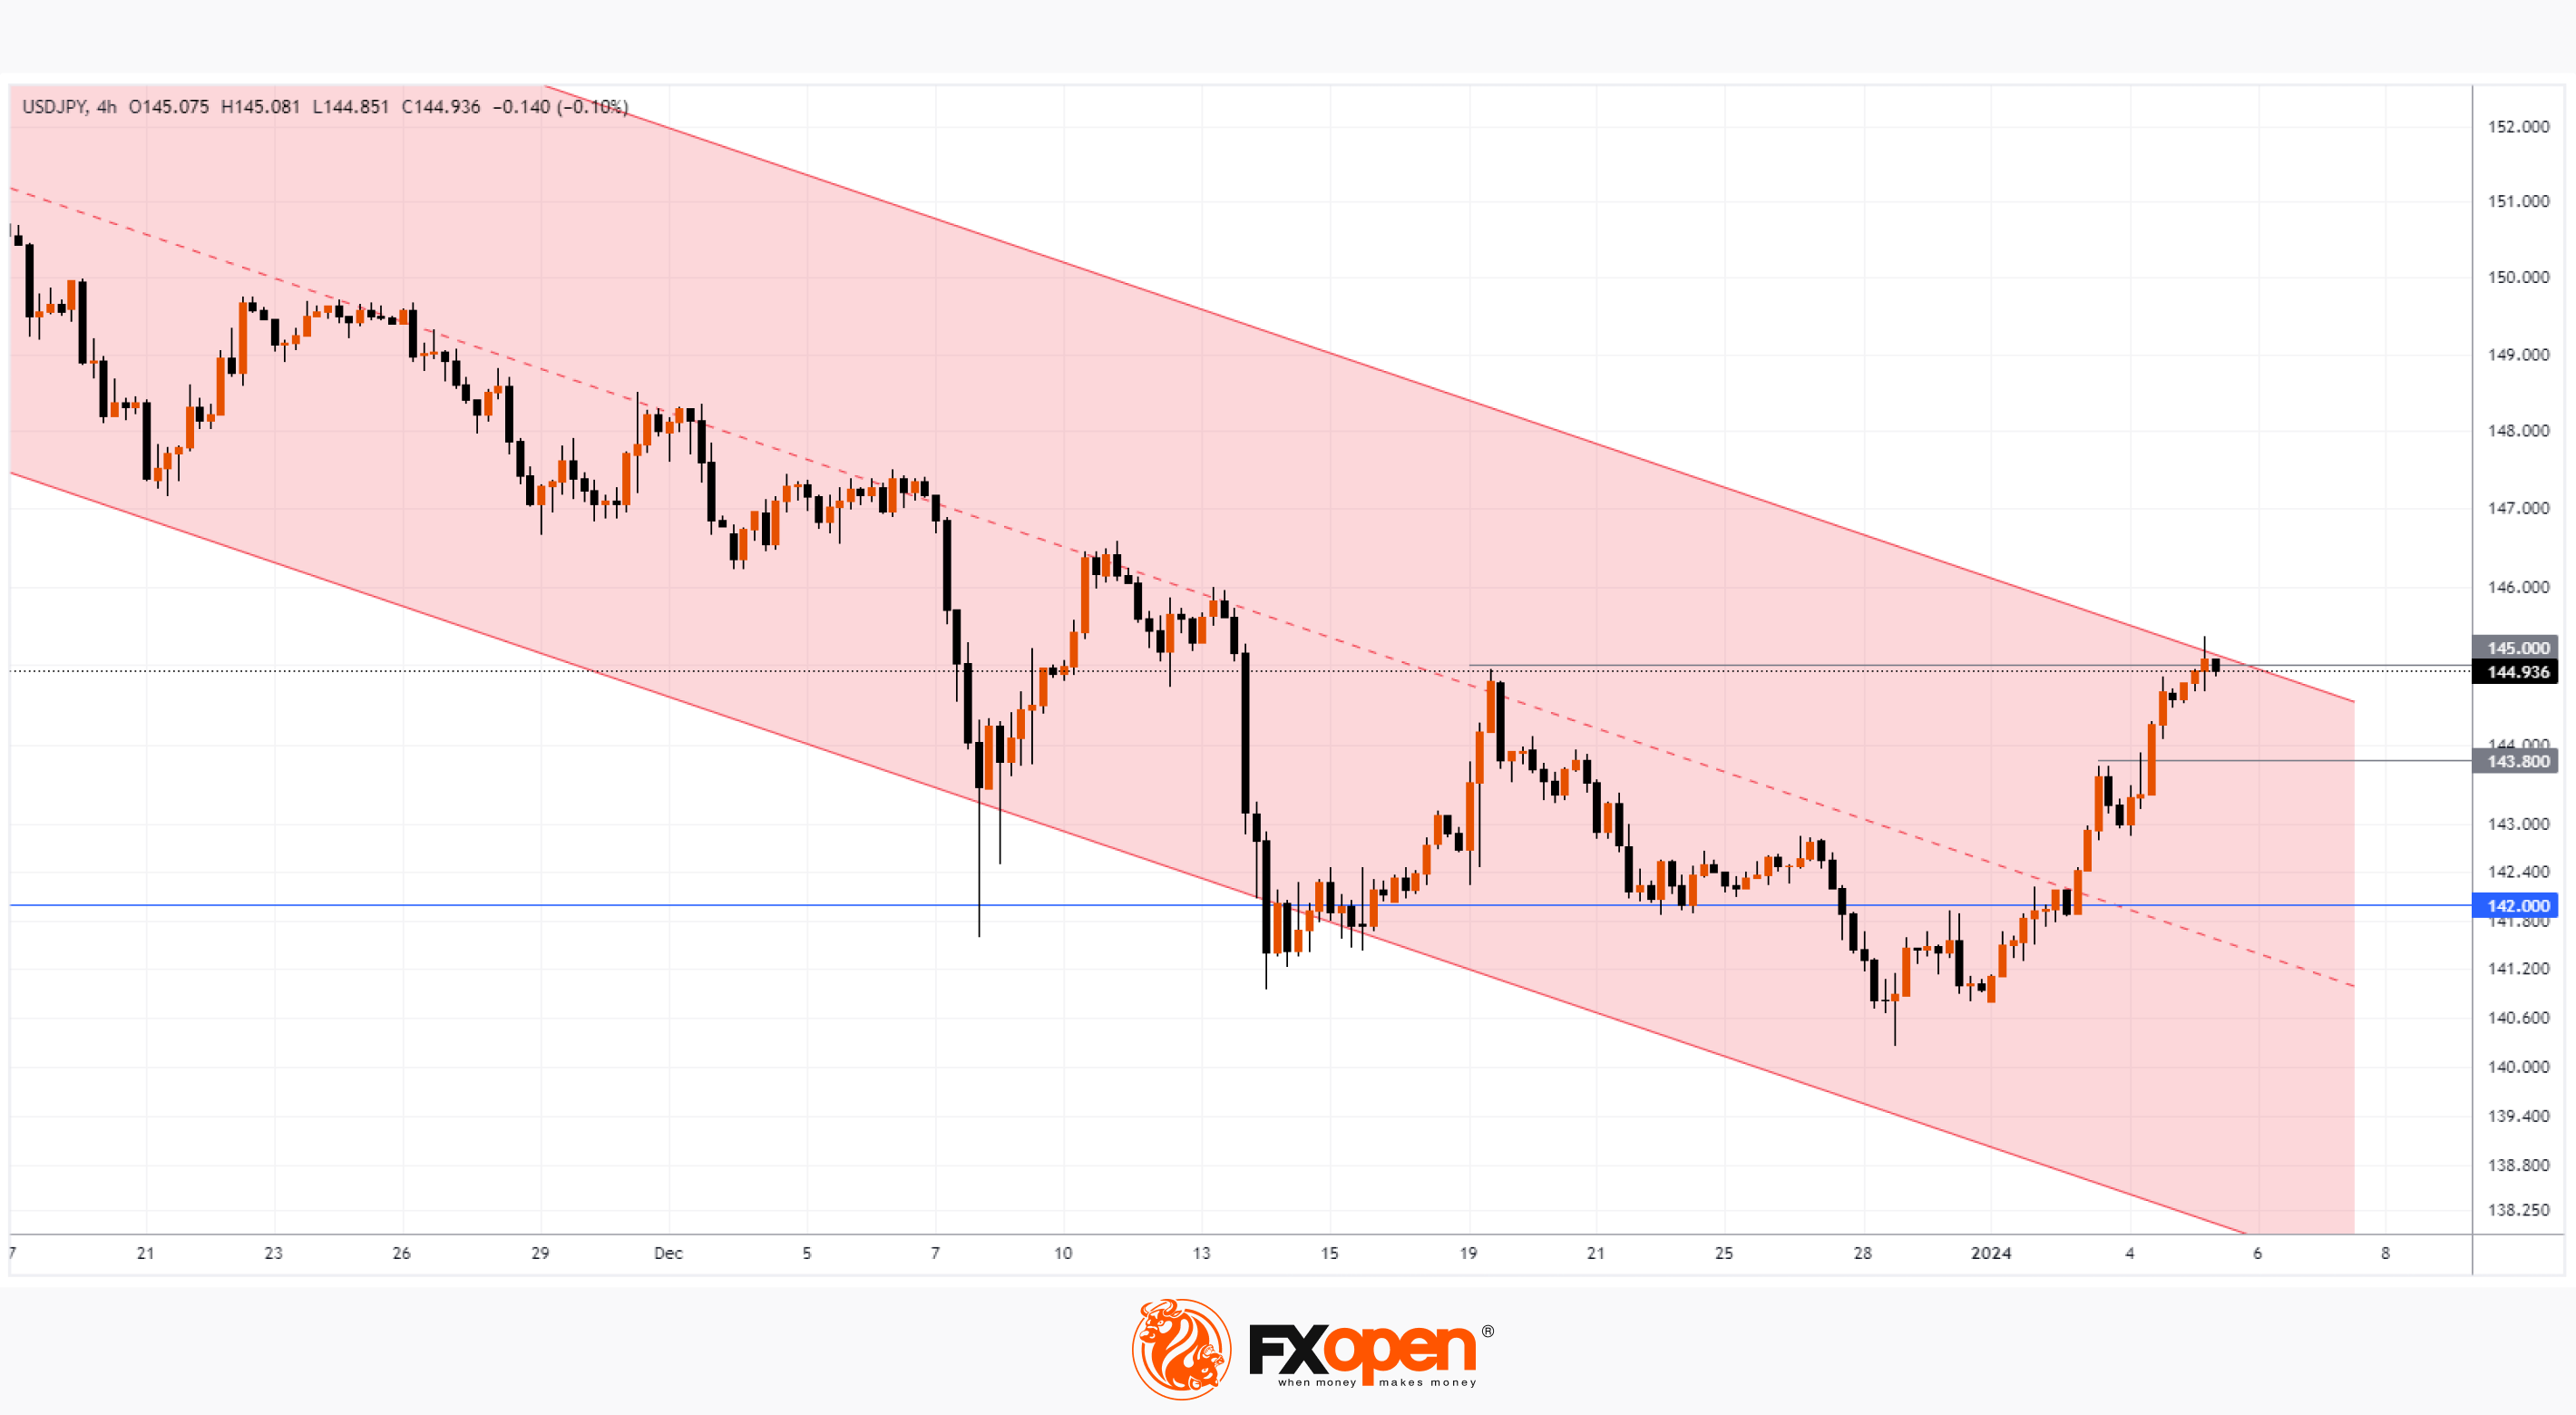
The USD/JPY chart shows that:
→ the price moves within the descending channel (shown in red). Growth at the beginning of the year expanded its boundaries along the principle of a parallel channel.
→ the median line has been broken by the bulls. The price action around 142 shows increased demand. The price could not consolidate below this level in December, serving as a powerful support for ending panic on December 7 and 14-15. Also, demand forces did not allow the price to reach the lower border of the channel on December 28.
Note that the bulls managed to break above the psychological level of 145 yen/dollar, something they failed to do on December 19 when a notable high was formed. Thus, the market is in a vulnerable position for a pullback from the upper boundary of the channel after rapid growth in the first days of the year. If this happens, a false bullish breakout of the psychological level of 145 yen per US dollar will form on the chart. The bears will have a chance to resume the trend, but given the listed signs of demand strength around the 142 yen per dollar level, they will have to make significant efforts to do this.
Be careful, today at 16:30 GMT+3 there will be news on the labour market in the US, which will be able to affect the USD exchange rate.
To benefit from the rise and fall of currency rates, consider enlisting the services of a trusted broker like FXOpen.
CFDs are complex instruments and come with a high risk of losing your money.
This article represents the opinion of the Companies operating under the FXOpen brand only. It is not to be construed as an offer, solicitation, or recommendation with respect to products and services provided by the Companies operating under the FXOpen brand, nor is it to be considered financial advice.
USD/JPY: The Price Reaches Resistance at 145 Yen per US Dollar
As of Friday morning, the situation on the USD/JPY market deserves attention:
→ the US dollar is on course to demonstrate its strongest week since July 2023. The media writes that markets are adjusting expectations regarding the easing of monetary policy by the Fed.
→ The yen fell about 3% against the US dollar in the first week of the year, which could be its weakest weekly performance since August 2022.
The USD/JPY chart shows that:
→ the price moves within the descending channel (shown in red). Growth at the beginning of the year expanded its boundaries along the principle of a parallel channel.
→ the median line has been broken by the bulls. The price action around 142 shows increased demand. The price could not consolidate below this level in December, serving as a powerful support for ending panic on December 7 and 14-15. Also, demand forces did not allow the price to reach the lower border of the channel on December 28.
Note that the bulls managed to break above the psychological level of 145 yen/dollar, something they failed to do on December 19 when a notable high was formed. Thus, the market is in a vulnerable position for a pullback from the upper boundary of the channel after rapid growth in the first days of the year. If this happens, a false bullish breakout of the psychological level of 145 yen per US dollar will form on the chart. The bears will have a chance to resume the trend, but given the listed signs of demand strength around the 142 yen per dollar level, they will have to make significant efforts to do this.
Be careful, today at 16:30 GMT+3 there will be news on the labour market in the US, which will be able to affect the USD exchange rate.
To benefit from the rise and fall of currency rates, consider enlisting the services of a trusted broker like FXOpen.
CFDs are complex instruments and come with a high risk of losing your money.
This article represents the opinion of the Companies operating under the FXOpen brand only. It is not to be construed as an offer, solicitation, or recommendation with respect to products and services provided by the Companies operating under the FXOpen brand, nor is it to be considered financial advice.
#marketanalysis #MarketNews #stockmarket
JPM Stock Hits All-time High
This week the reporting season begins — company results for the 4th quarter will certainly become one of the most important drivers of stock index prices, along with the publication of news about inflation, the labor market, and statements from the Federal Reserve.
Large banks will traditionally be among the first to report: JP Morgan, Bank of America, Wells Fargo, Citi. The banking sector looks frankly strong at the beginning of 2024. While the S&P-500 is down 1% in the first week, the XLF financial sector fund is holding near the year's opening price.
According to MarketWatch, bank stocks are becoming increasingly popular amid expectations of a positive yield curve in the second half of 2024, and analysts have set “buy” ratings on shares of Goldman Sachs, Morgan Stanley and Wells Fargo (WFC).
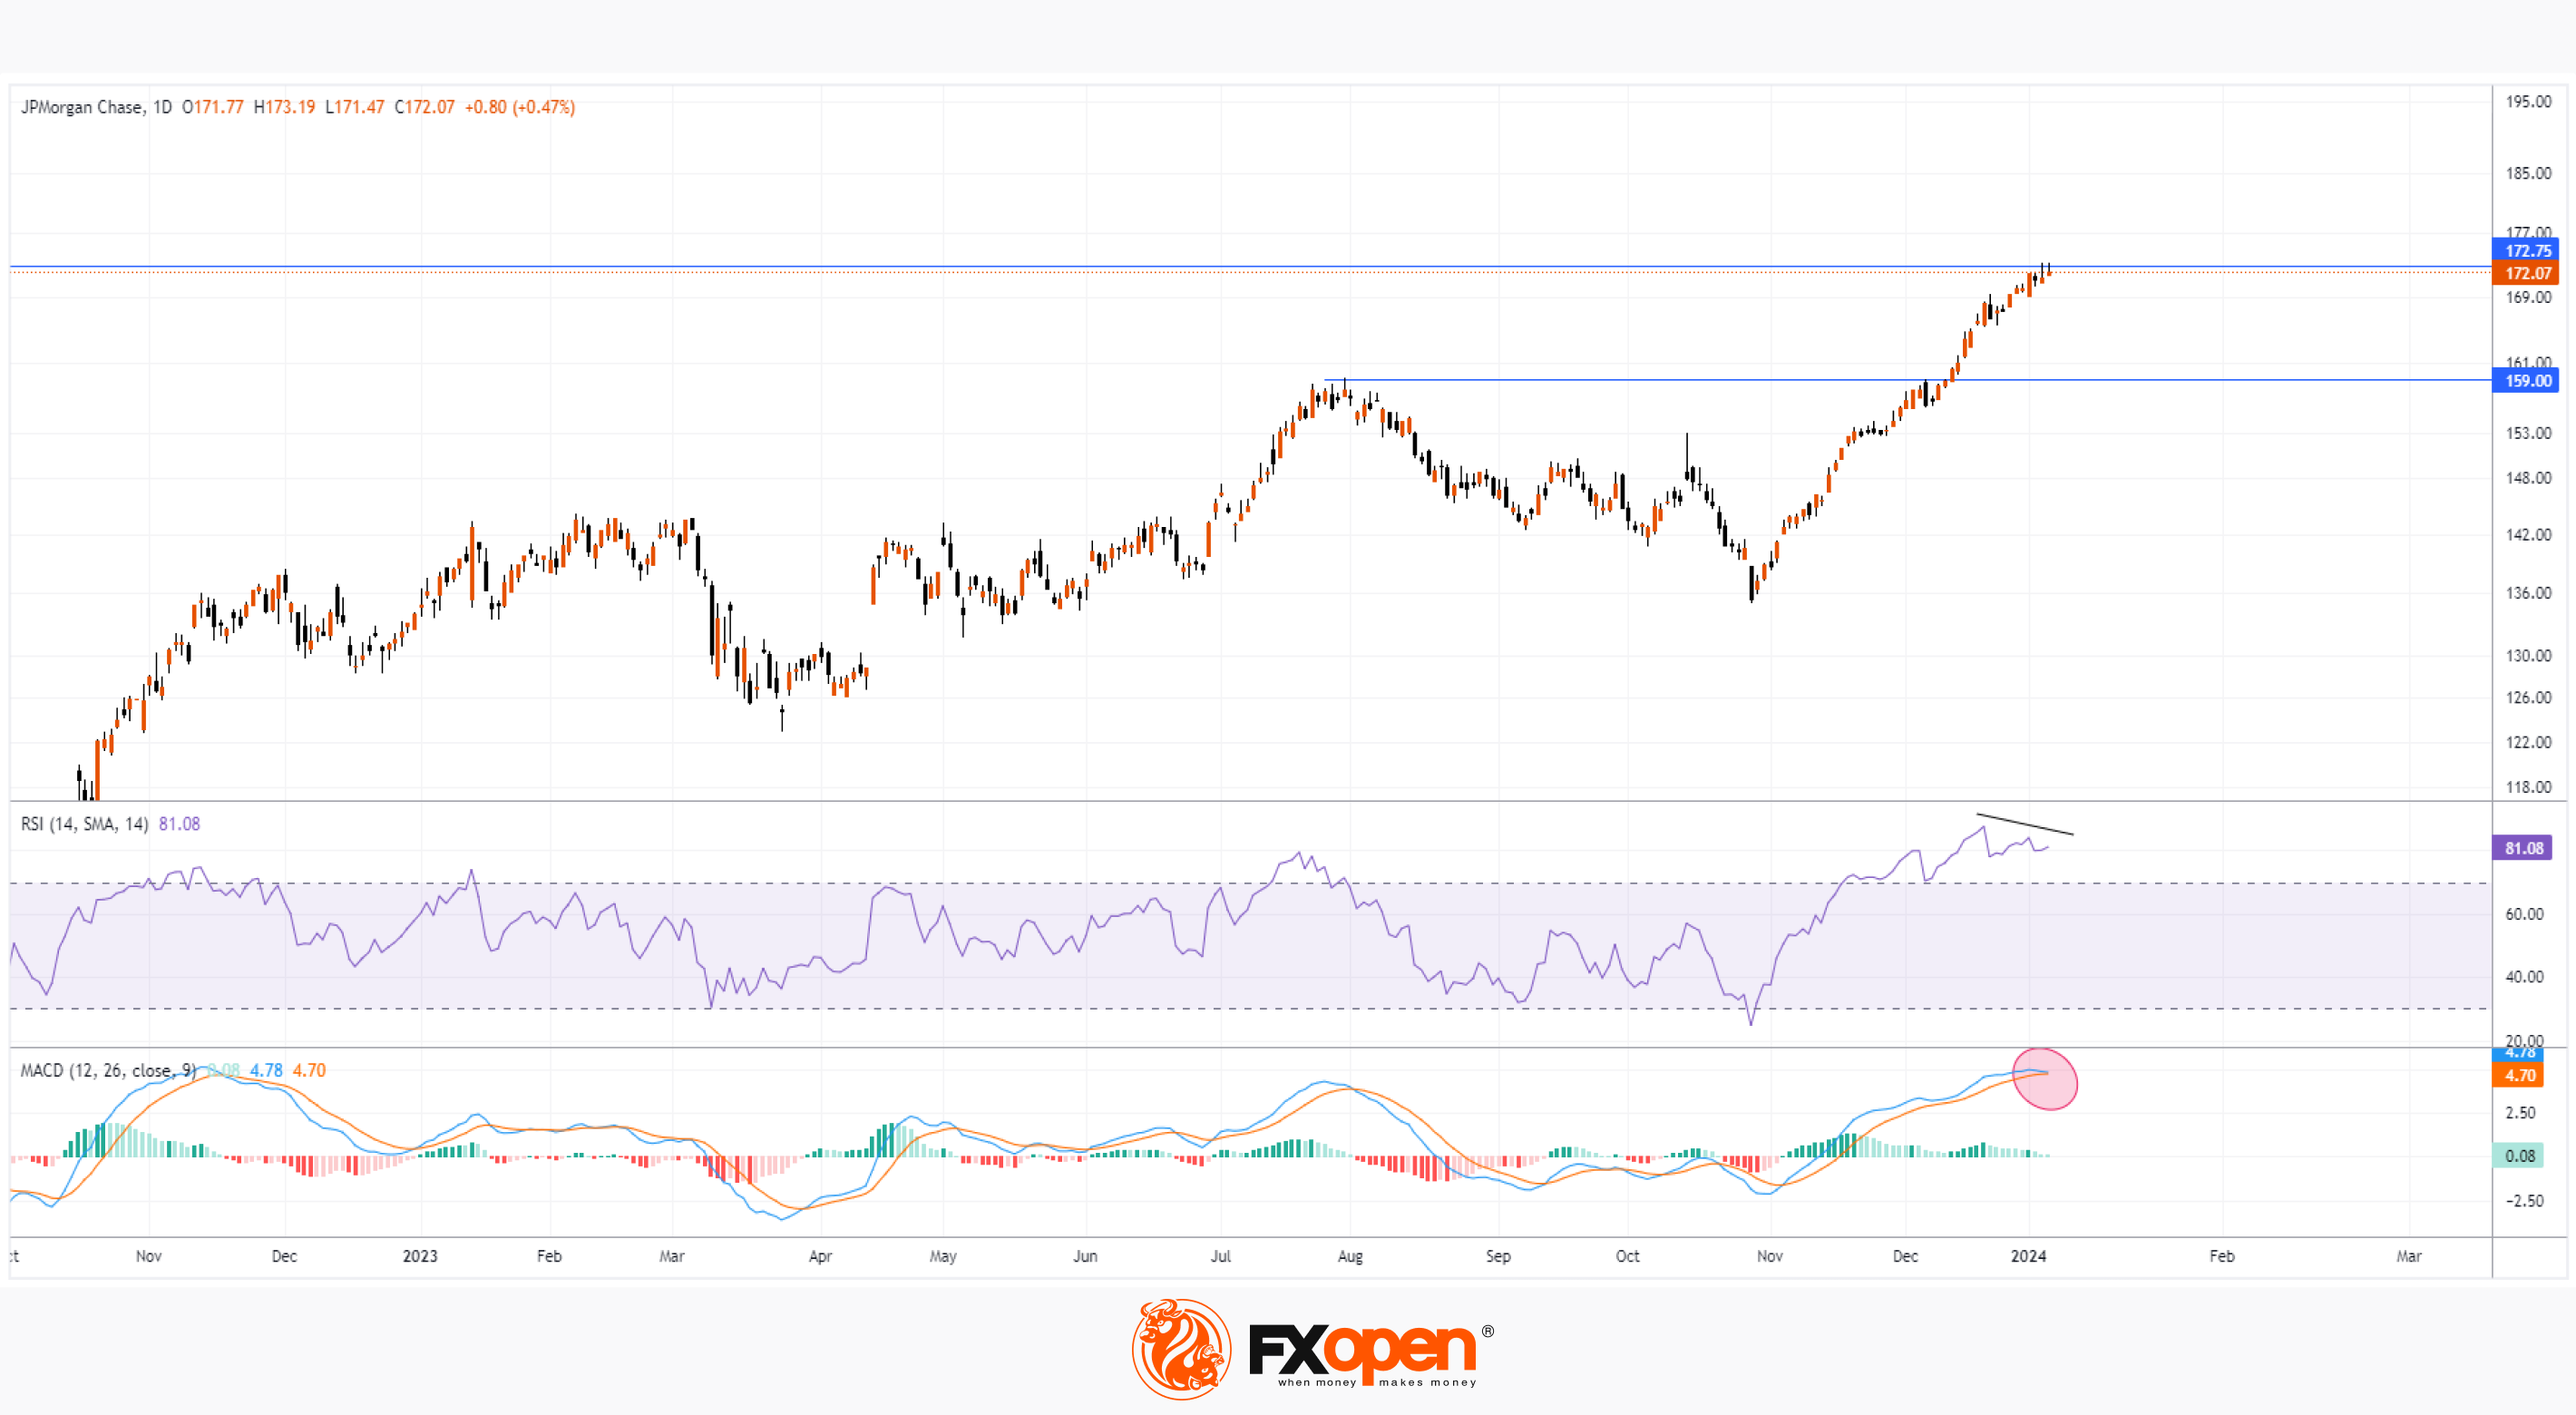
It should be noted that shares of JP Morgan bank set a historical record. The previous high set on October 25, 2021 was USD 172.75 per share. At its peak last Friday, the price reached USD 173.19 per share.
The growth of JPM shares is facilitated by the dividend policy:
→ January 2024: USD 1.05 per share;
→ January 2023: USD 1.00 per share;
→ January 2022: USD 1.00 per share;
→ January 2021: USD 0.90 per share;
→ January 2020: USD 0.90 per share.
JPM data will be published on Friday. Will the price be able to maintain its highs?
There are some concerns.
From a fundamental point of view, in the current economic environment, with inflation remaining above target and interest rates at high levels, the results for the 4th quarter may disappoint.
From a technical standpoint, the JPM price chart shows signs of a bearish reversal:
→ divergence on the RSI indicator;
→ potential intersection of MACD curves;
→ long upper shadows on the last candles show signs of selling pressure.
Thus, the market can form a false bullish breakout of the previous high. It is possible that the price of JPM shares, against the backdrop of news about the bank’s activities, may fall closer to the former resistance around USD 159.
To benefit from the rise and fall of popular stocks, consider enlisting the services of a trusted broker like FXOpen.
CFDs are complex instruments and come with a high risk of losing your money.
This article represents the opinion of the Companies operating under the FXOpen brand only. It is not to be construed as an offer, solicitation, or recommendation with respect to products and services provided by the Companies operating under the FXOpen brand, nor is it to be considered financial advice.
JPM Stock Hits All-time High
This week the reporting season begins — company results for the 4th quarter will certainly become one of the most important drivers of stock index prices, along with the publication of news about inflation, the labor market, and statements from the Federal Reserve.
Large banks will traditionally be among the first to report: JP Morgan, Bank of America, Wells Fargo, Citi. The banking sector looks frankly strong at the beginning of 2024. While the S&P-500 is down 1% in the first week, the XLF financial sector fund is holding near the year's opening price.
According to MarketWatch, bank stocks are becoming increasingly popular amid expectations of a positive yield curve in the second half of 2024, and analysts have set “buy” ratings on shares of Goldman Sachs, Morgan Stanley and Wells Fargo (WFC).
It should be noted that shares of JP Morgan bank set a historical record. The previous high set on October 25, 2021 was USD 172.75 per share. At its peak last Friday, the price reached USD 173.19 per share.
The growth of JPM shares is facilitated by the dividend policy:
→ January 2024: USD 1.05 per share;
→ January 2023: USD 1.00 per share;
→ January 2022: USD 1.00 per share;
→ January 2021: USD 0.90 per share;
→ January 2020: USD 0.90 per share.
JPM data will be published on Friday. Will the price be able to maintain its highs?
There are some concerns.
From a fundamental point of view, in the current economic environment, with inflation remaining above target and interest rates at high levels, the results for the 4th quarter may disappoint.
From a technical standpoint, the JPM price chart shows signs of a bearish reversal:
→ divergence on the RSI indicator;
→ potential intersection of MACD curves;
→ long upper shadows on the last candles show signs of selling pressure.
Thus, the market can form a false bullish breakout of the previous high. It is possible that the price of JPM shares, against the backdrop of news about the bank’s activities, may fall closer to the former resistance around USD 159.
To benefit from the rise and fall of popular stocks, consider enlisting the services of a trusted broker like FXOpen.
CFDs are complex instruments and come with a high risk of losing your money.
This article represents the opinion of the Companies operating under the FXOpen brand only. It is not to be construed as an offer, solicitation, or recommendation with respect to products and services provided by the Companies operating under the FXOpen brand, nor is it to be considered financial advice.
#marketanalysis #MarketNews #tradingforex
The Swiss National Bank Suffered Losses of 3 Billion Francs in 2023
The Swiss National Bank (SNB) reported an annual loss of 3 billion Swiss francs (USD 3.54 billion) in 2023 and said it would not make payments to Switzerland's central or local government or pay dividends to investors.
The loss is believed to have occurred as a result of interest rate hikes aimed at fighting inflation.
Although in Switzerland, perhaps, inflation is at the lowest level: according to yesterday's Core Price Index data, the actual value is = 0.0% (expected = 0.1%, a year ago = -0.2%, the highest actual value in 2023 was = +0.7 %). However, the SNB raised the rate to 1.75% twice in 2023, and this led to it making more payments to deposit account holders.
Note that the loss for 2023 is much less than the record minus 133 billion for 2022. Reuters writes that the losses will not affect the bank's current monetary policy, and interest rates could be cut during 2024.
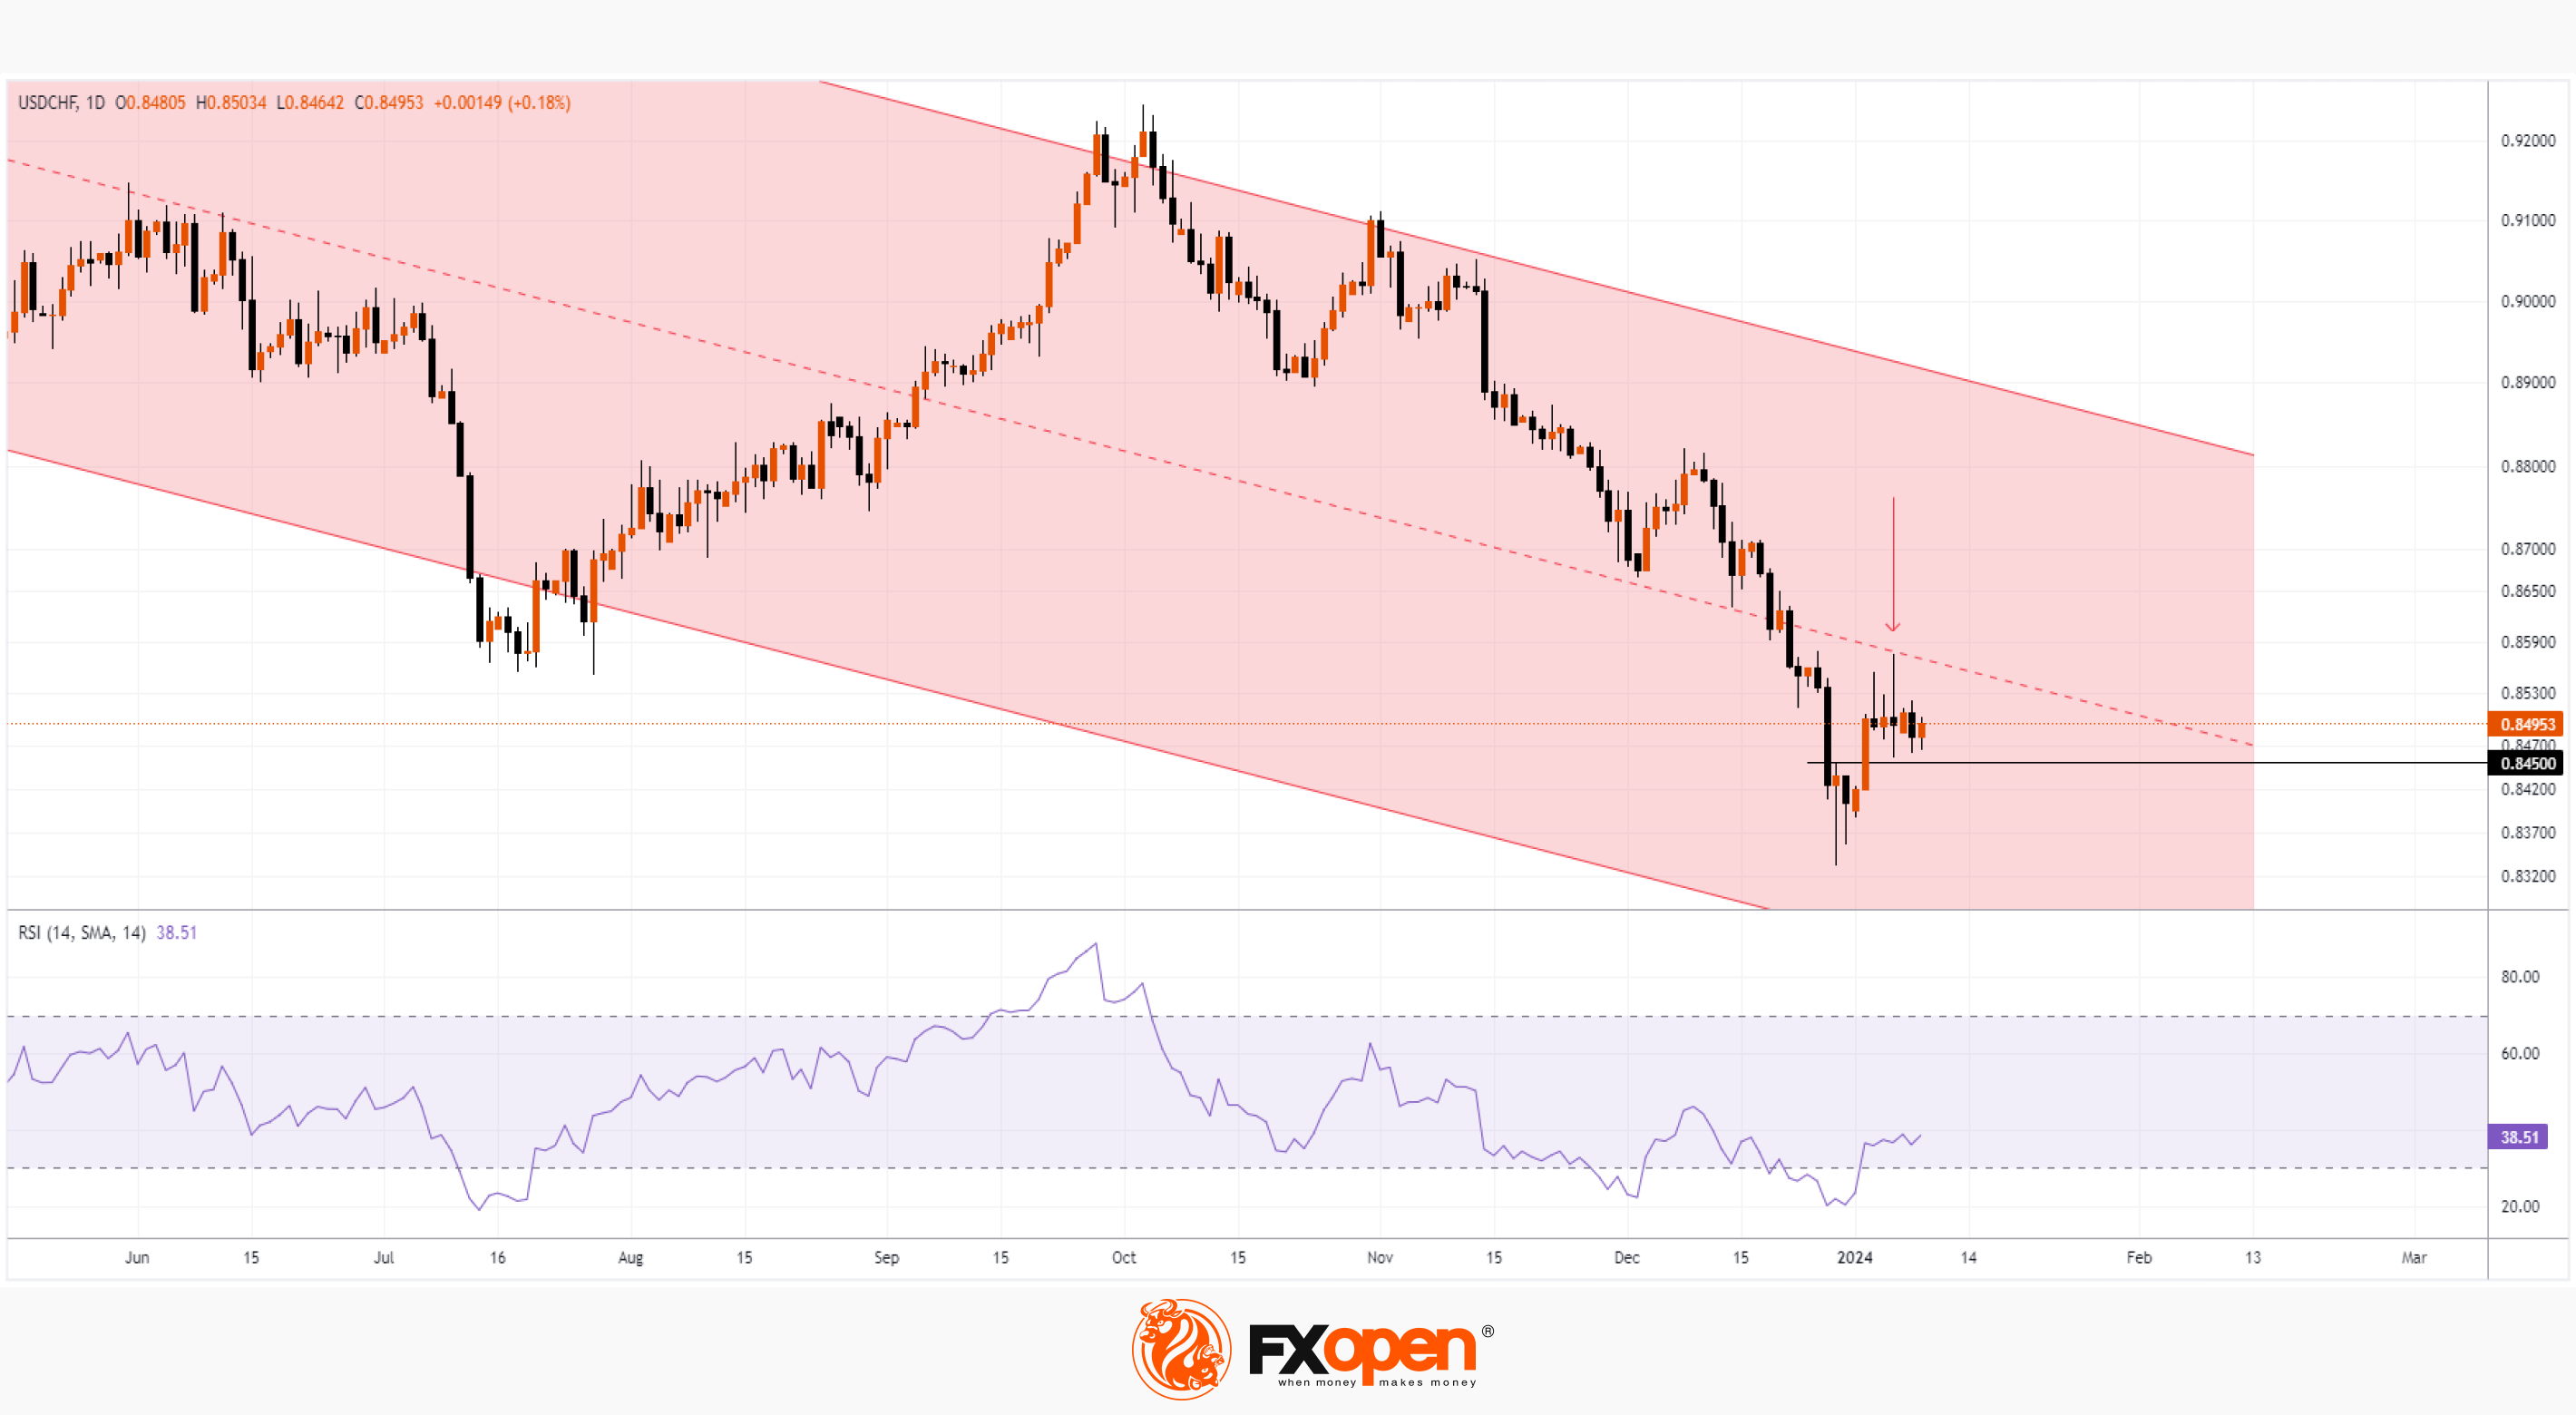
On November 2, we wrote that the franc could continue to strengthen. Since then, USD/CHF has fallen about 6%, setting its 2023 low on December 28 at 0.83327.
The graph shows that:
→ during 2023, the price moved within the descending channel;
→ at the 2023 low, the price was unable to reach its lower limit — a sign of a lack of selling pressure;
→ the median line of the channel still serves as resistance (as shown by the arrow);
→ level 0.845 changed its role from resistance to support;
→ in the area of the 2023 lows, long lower shadows were formed on the candles (a sign of aggressive demand). At the same time, the RSI indicator showed that the market was strongly oversold.
Taking into account the above arguments, it can be assumed that the USD will be able to strengthen against the franc, stopping the pace of the downward trend in 2023. A bullish breakdown of the median line (or failure of the price to consolidate below the 0.845 level) will provide more arguments in favor of the presence of demand in the market in question.
To benefit from the rise and fall of currency rates, consider enlisting the services of a trusted broker like FXOpen.
CFDs are complex instruments and come with a high risk of losing your money.
This article represents the opinion of the Companies operating under the FXOpen brand only. It is not to be construed as an offer, solicitation, or recommendation with respect to products and services provided by the Companies operating under the FXOpen brand, nor is it to be considered financial advice.
The Swiss National Bank Suffered Losses of 3 Billion Francs in 2023
The Swiss National Bank (SNB) reported an annual loss of 3 billion Swiss francs (USD 3.54 billion) in 2023 and said it would not make payments to Switzerland's central or local government or pay dividends to investors.
The loss is believed to have occurred as a result of interest rate hikes aimed at fighting inflation.
Although in Switzerland, perhaps, inflation is at the lowest level: according to yesterday's Core Price Index data, the actual value is = 0.0% (expected = 0.1%, a year ago = -0.2%, the highest actual value in 2023 was = +0.7 %). However, the SNB raised the rate to 1.75% twice in 2023, and this led to it making more payments to deposit account holders.
Note that the loss for 2023 is much less than the record minus 133 billion for 2022. Reuters writes that the losses will not affect the bank's current monetary policy, and interest rates could be cut during 2024.
On November 2, we wrote that the franc could continue to strengthen. Since then, USD/CHF has fallen about 6%, setting its 2023 low on December 28 at 0.83327.
The graph shows that:
→ during 2023, the price moved within the descending channel;
→ at the 2023 low, the price was unable to reach its lower limit — a sign of a lack of selling pressure;
→ the median line of the channel still serves as resistance (as shown by the arrow);
→ level 0.845 changed its role from resistance to support;
→ in the area of the 2023 lows, long lower shadows were formed on the candles (a sign of aggressive demand). At the same time, the RSI indicator showed that the market was strongly oversold.
Taking into account the above arguments, it can be assumed that the USD will be able to strengthen against the franc, stopping the pace of the downward trend in 2023. A bullish breakdown of the median line (or failure of the price to consolidate below the 0.845 level) will provide more arguments in favor of the presence of demand in the market in question.
To benefit from the rise and fall of currency rates, consider enlisting the services of a trusted broker like FXOpen.
CFDs are complex instruments and come with a high risk of losing your money.
This article represents the opinion of the Companies operating under the FXOpen brand only. It is not to be construed as an offer, solicitation, or recommendation with respect to products and services provided by the Companies operating under the FXOpen brand, nor is it to be considered financial advice.
👍2
#marketanalysis #inflation #MarketNews
Inflation in Australia Continues To Decline. AUD/USD Tests Important Support
Data today from the Australian Bureau of Statistics on Wednesday showed the monthly consumer price index (CPI) rose 4.3% year-on-year in November, the slowest pace since January 2022. Value a month earlier = 4.9%. Market forecasts = 4.4%.
This strengthened market expectations that interest rates would not have to rise further. Although the head of the Reserve Bank of Australia, Michele Bullock, warned of the risks of rising price pressures caused by domestic demand, for example, due to rising prices for rental housing.
Against the backdrop of the publication of news about inflation in Australia, no strong surges were noticed in the AUD/USD market. Perhaps this was due to the fact that there were no surprises.
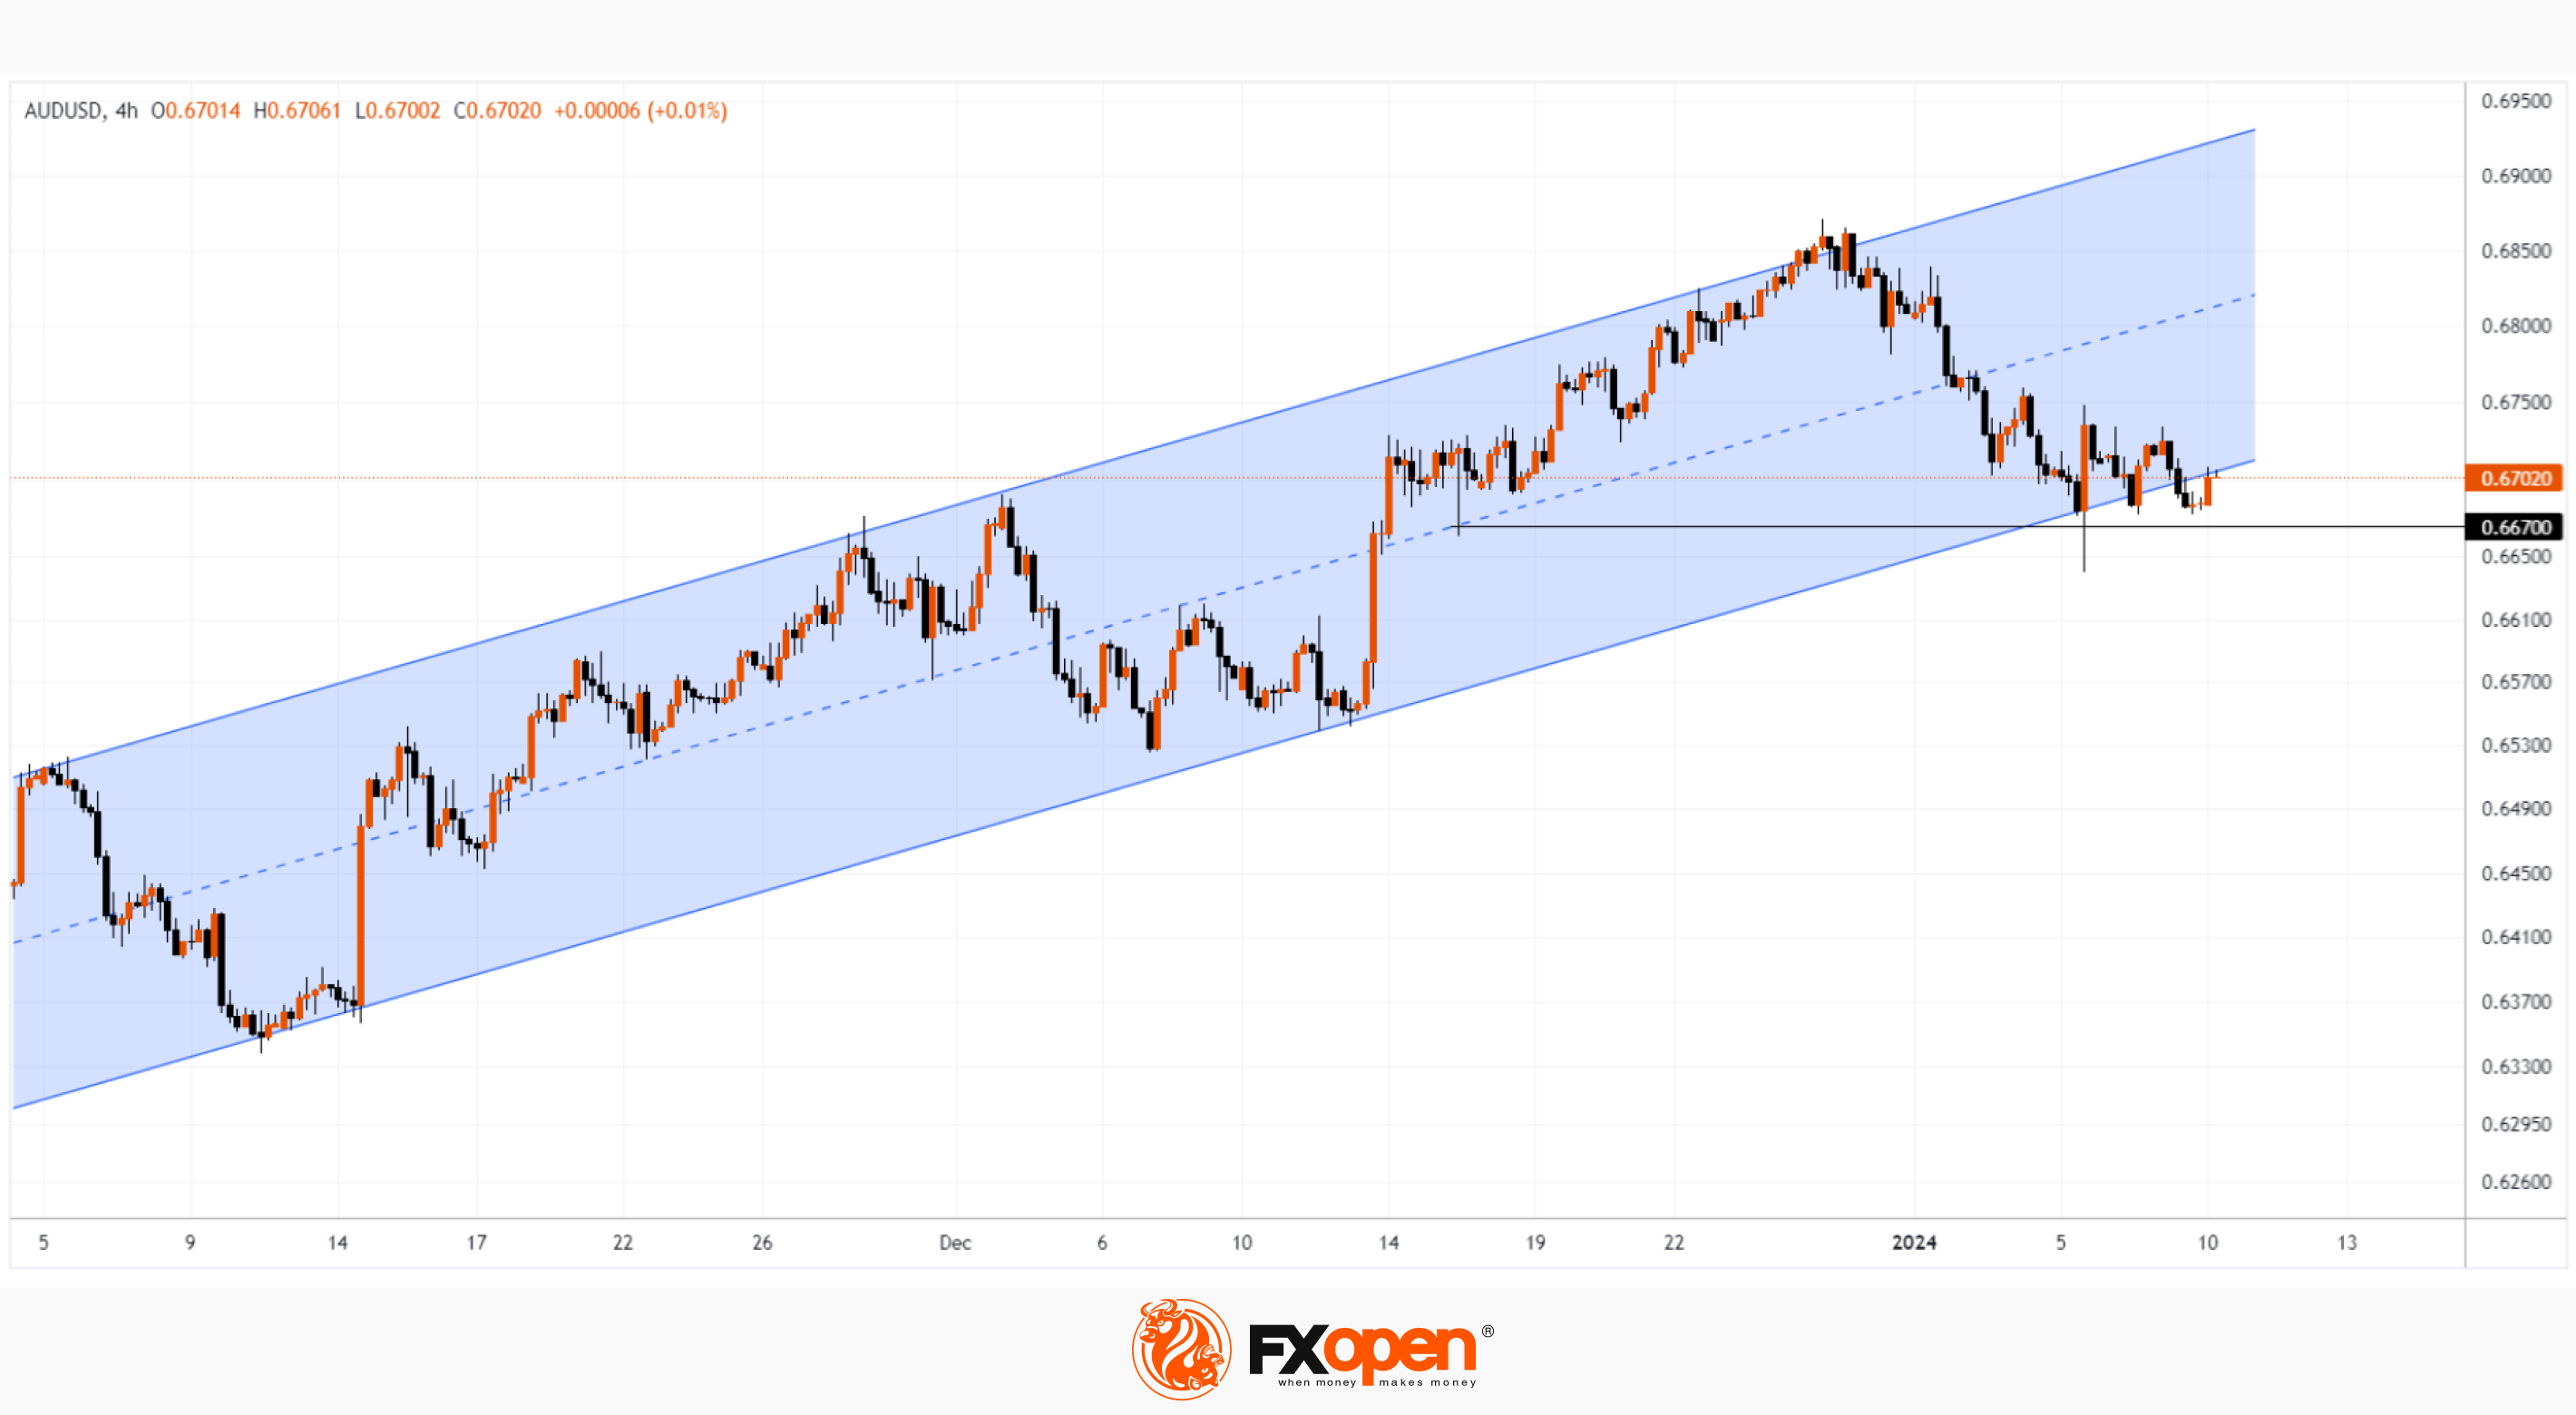
Meanwhile, the 4-hour chart shows that the AUD/USD rate is nearing important support, which is formed by the lower line of the trend channel (shown in blue), within which the price has been moving since last fall.
Wherein:
→ in 2024, the price managed to push off from this line several times, but continued growth did not follow;
→ the highs of the days of January 4, 5 and 9 form a sequence of falling tops;
→ on January 5, prices broke through the low of December 15, but then rose sharply — a sign of demand below the level of 0.667.
Thus, the chart provides evidence to suggest that the forces of demand have enough capacity to prevent the price from falling, but are so exhausted that they cannot resume the upward trend in the blue channel.
It is possible that the AUD/USD market will trade in a restrained manner until the release of tomorrow's inflation news in the US (16:30 GMT+3), which could lead to the formation of a new balance of supply and demand.
To benefit from price fluctuations in the forex market, consider enlisting the services of a trusted broker like FXOpen.
CFDs are complex instruments and come with a high risk of losing your money.
This article represents the opinion of the Companies operating under the FXOpen brand only. It is not to be construed as an offer, solicitation, or recommendation with respect to products and services provided by the Companies operating under the FXOpen brand, nor is it to be considered financial advice.
Inflation in Australia Continues To Decline. AUD/USD Tests Important Support
Data today from the Australian Bureau of Statistics on Wednesday showed the monthly consumer price index (CPI) rose 4.3% year-on-year in November, the slowest pace since January 2022. Value a month earlier = 4.9%. Market forecasts = 4.4%.
This strengthened market expectations that interest rates would not have to rise further. Although the head of the Reserve Bank of Australia, Michele Bullock, warned of the risks of rising price pressures caused by domestic demand, for example, due to rising prices for rental housing.
Against the backdrop of the publication of news about inflation in Australia, no strong surges were noticed in the AUD/USD market. Perhaps this was due to the fact that there were no surprises.
Meanwhile, the 4-hour chart shows that the AUD/USD rate is nearing important support, which is formed by the lower line of the trend channel (shown in blue), within which the price has been moving since last fall.
Wherein:
→ in 2024, the price managed to push off from this line several times, but continued growth did not follow;
→ the highs of the days of January 4, 5 and 9 form a sequence of falling tops;
→ on January 5, prices broke through the low of December 15, but then rose sharply — a sign of demand below the level of 0.667.
Thus, the chart provides evidence to suggest that the forces of demand have enough capacity to prevent the price from falling, but are so exhausted that they cannot resume the upward trend in the blue channel.
It is possible that the AUD/USD market will trade in a restrained manner until the release of tomorrow's inflation news in the US (16:30 GMT+3), which could lead to the formation of a new balance of supply and demand.
To benefit from price fluctuations in the forex market, consider enlisting the services of a trusted broker like FXOpen.
CFDs are complex instruments and come with a high risk of losing your money.
This article represents the opinion of the Companies operating under the FXOpen brand only. It is not to be construed as an offer, solicitation, or recommendation with respect to products and services provided by the Companies operating under the FXOpen brand, nor is it to be considered financial advice.
#MarketNews #bitcoin #crypto #cryptonews
Finally! The SEC Approves all 11 Applications for Bitcoin ETFs
The following ETFs can start operating today:
- Blackrock's iShares Bitcoin Trust (IBIT)
- ARK 21Shares Bitcoin ETF (ARKB)
- WisdomTree Bitcoin Fund (BTCW)
- Invesco Galaxy Bitcoin ETF (BTCO)
- Bitwise Bitcoin ETF (BITB)
- VanEck Bitcoin Trust (HODL)
- Franklin Bitcoin ETF (EZBC)
- Fidelity Wise Origin Bitcoin Trust (FBTC)
- Valkyrie Bitcoin Fund (BRRR)
- Grayscale Bitcoin Trust (GBTC)
- Hashdex Bitcoin ETF (DEFI)
Despite the regulatory approval of the first spot Bitcoin ETFs in US history, the head of the US Securities and Exchange Commission (SEC) Gary Gensler has not changed his critical attitude towards cryptocurrencies. Thus, the regulator sees signs of illegally issued securities in many cryptocurrencies that operate on the Proof-of-Stake (PoS) algorithm.
According to Gensler, the regulator was forced to approve the applications due to “changed circumstances.” This is likely a reference to the recent litigation where Grayscale filed a request with the Commission to transform its Bitcoin fund into a spot ETF. The judge then concluded that the regulator had wrongfully rejected the company's application.
Gensler also warned investors about the numerous risks associated with Bitcoin.
Meanwhile:
→ Funds whose applications have been approved are reducing fees one after another, trying to win the competition for investors.
→ Bank of England (BOE) Governor Andrew Bailey, speaking before the Treasury Committee of the United Kingdom Parliament, called Bitcoin ineffective.
→ Cryptocurrency exchange apps have become unavailable in India due to the introduction of stricter legislation governing cryptocurrencies.
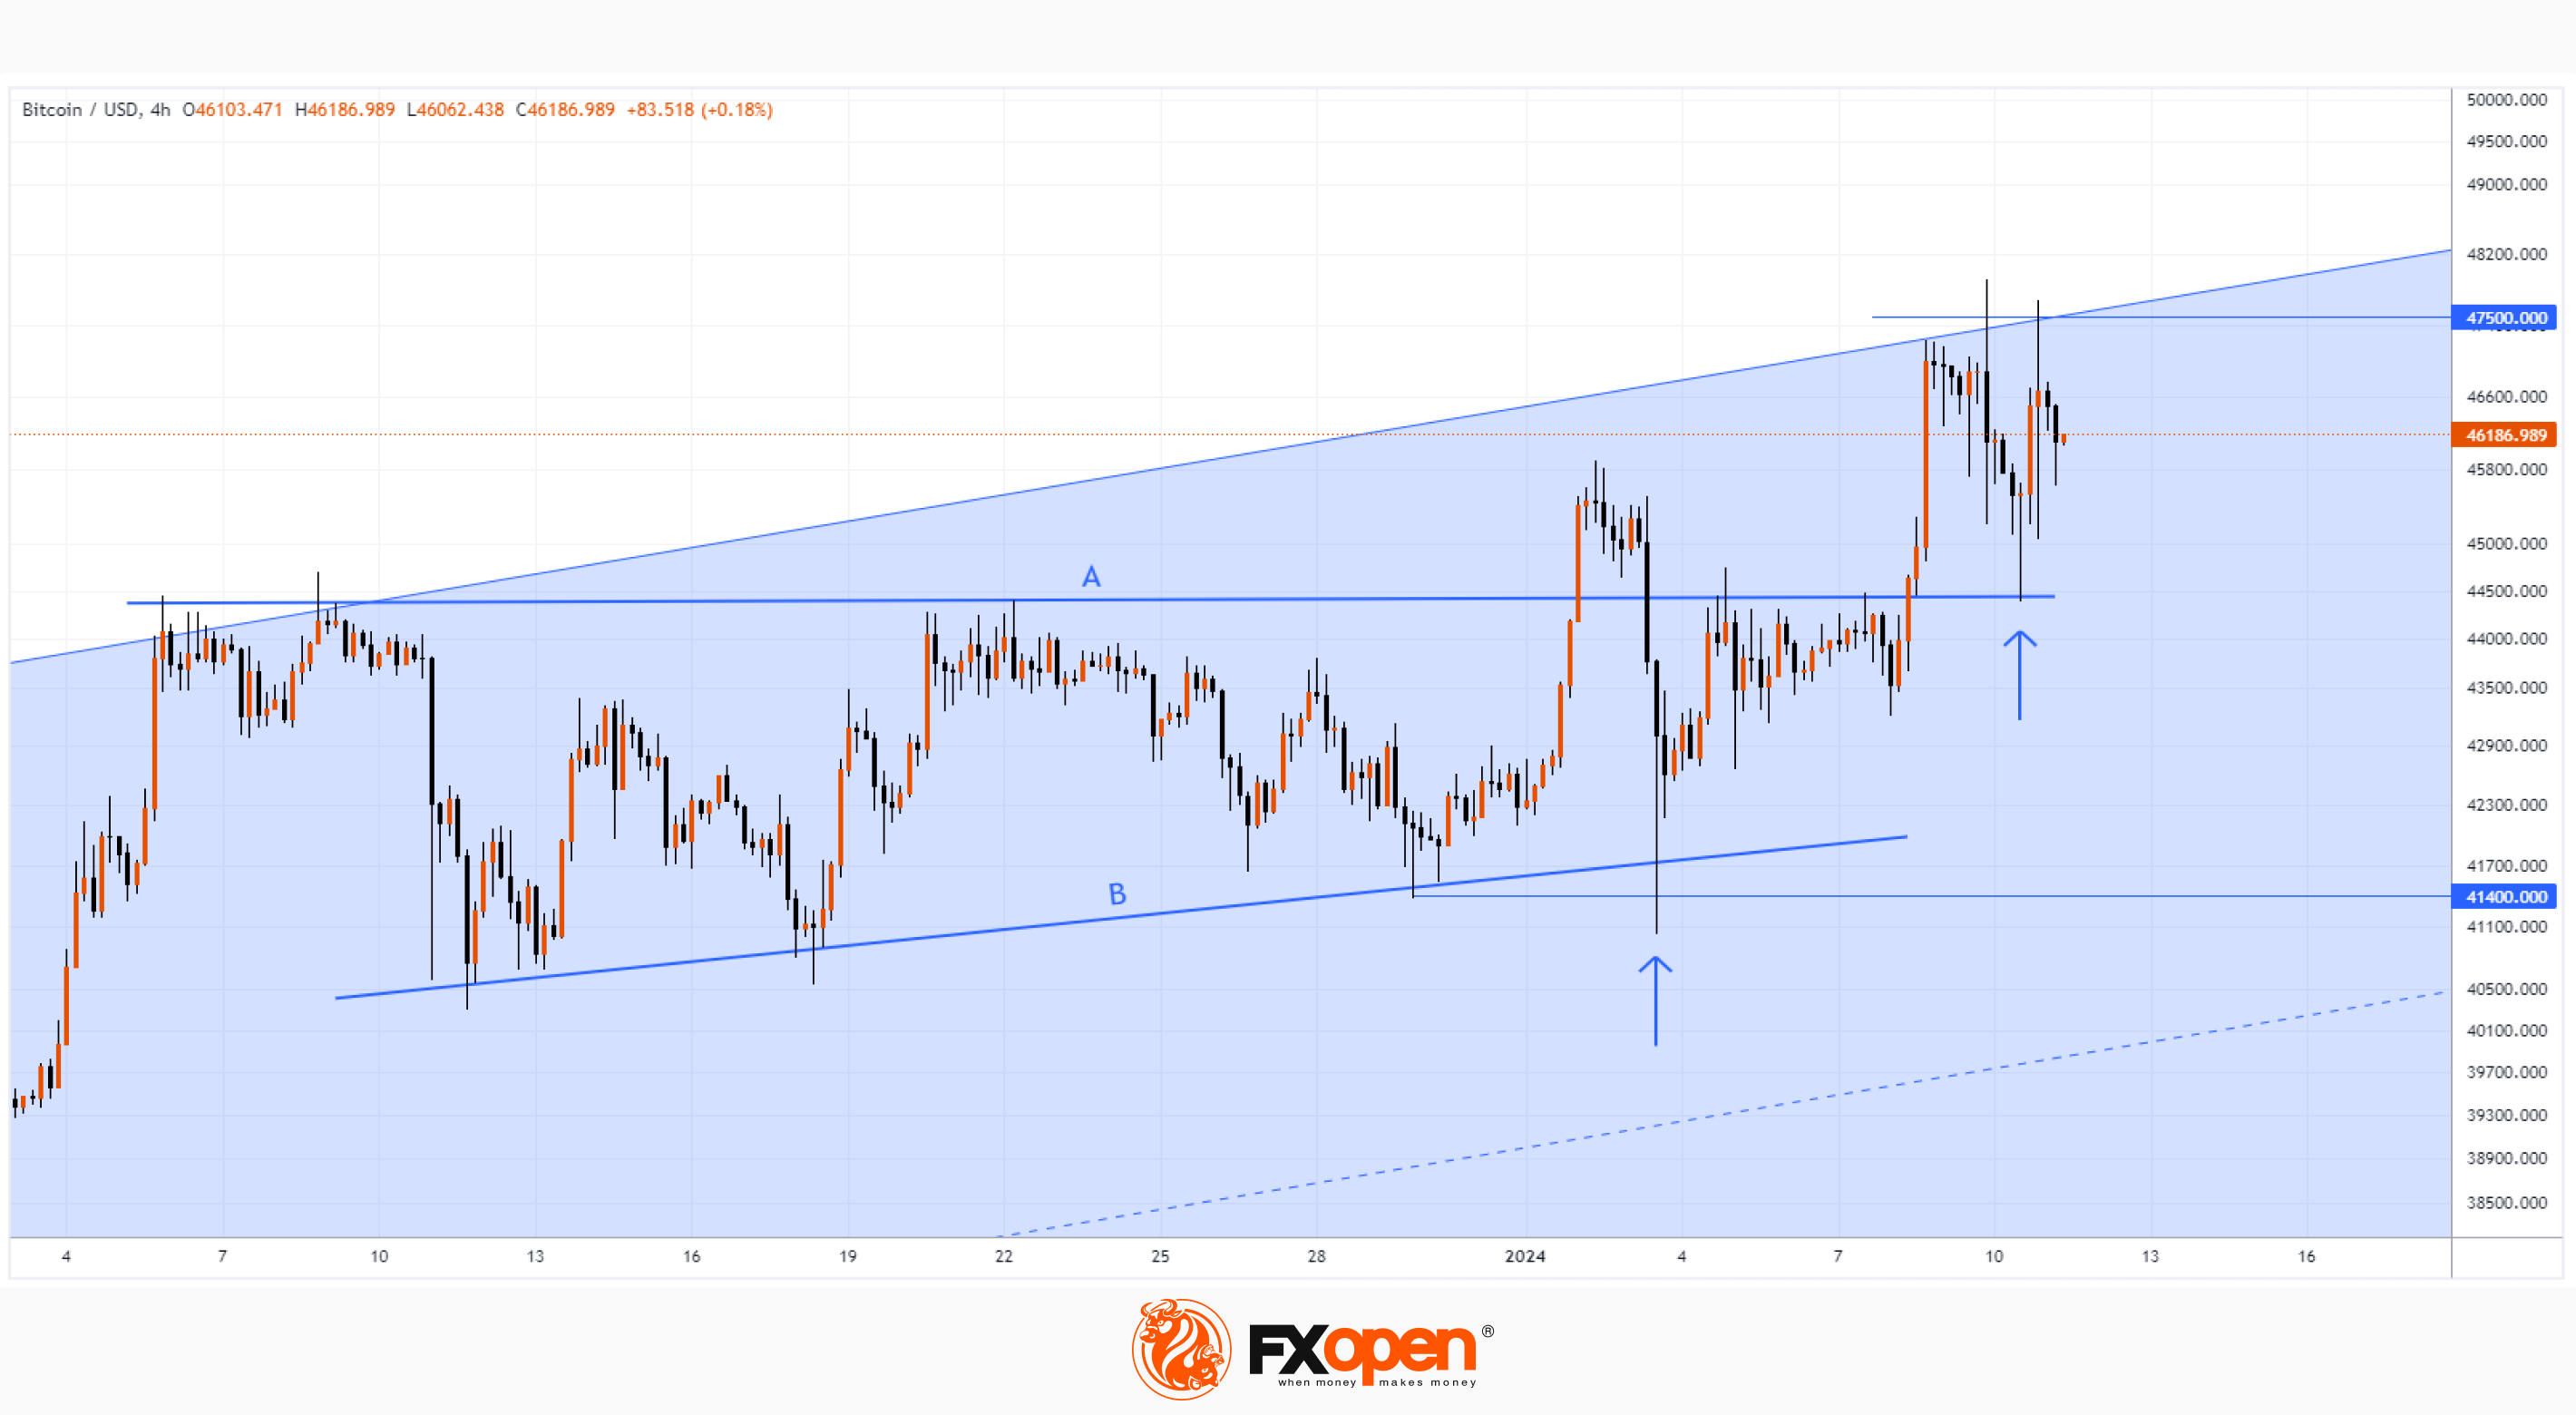
The chart shows that the price of BTC/USD did not change much after the official SEC decision. This highlights that the price of Bitcoin on exchanges has already taken into account the high probability of ETF approval.
We wrote earlier that Bitcoin is starting the year with bullish sentiment.
Note that:
→ The price of Bitcoin has reached the upper limit of the long-term channel (shown in blue, it is shown more fully in the post at the link above). Technically, resistance to growth should be expected from the upper border, which is, in principle, observed on the chart.
→ On January 2, the bulls tried to break through the A-B consolidation zone, but failed.
→ On January 3, there was an attempt at a bearish breakout (shown by an arrow), and it also turned out to be unsuccessful.
→ Recent price action shows that line A (44,400) is now acting as support.
Fundamentally, the price could be pushed higher by news that demand for new ETFs is exceeding expectations. But even if the price continues to rise on the new impulse, it will face the psychological mark of 50k per coin — it is possible that a false bullish breakout of the round figure will occur.
To benefit from the rise and fall of Bitcoin, consider enlisting the services of a trusted broker like FXOpen.
CFDs are complex instruments and come with a high risk of losing your money.
This article represents the opinion of the Companies operating under the FXOpen brand only. It is not to be construed as an offer, solicitation, or recommendation with respect to products and services provided by the Companies operating under the FXOpen brand, nor is it to be considered financial advice.
At FXOpen UK and FXOpen AU, Cryptocurrency CFDs are only available for trading by those clients categorised as Professional clients under FCA Rules and Professional clients under ASIC Rules, respectively. They are not available for trading by Retail clients.
Finally! The SEC Approves all 11 Applications for Bitcoin ETFs
The following ETFs can start operating today:
- Blackrock's iShares Bitcoin Trust (IBIT)
- ARK 21Shares Bitcoin ETF (ARKB)
- WisdomTree Bitcoin Fund (BTCW)
- Invesco Galaxy Bitcoin ETF (BTCO)
- Bitwise Bitcoin ETF (BITB)
- VanEck Bitcoin Trust (HODL)
- Franklin Bitcoin ETF (EZBC)
- Fidelity Wise Origin Bitcoin Trust (FBTC)
- Valkyrie Bitcoin Fund (BRRR)
- Grayscale Bitcoin Trust (GBTC)
- Hashdex Bitcoin ETF (DEFI)
Despite the regulatory approval of the first spot Bitcoin ETFs in US history, the head of the US Securities and Exchange Commission (SEC) Gary Gensler has not changed his critical attitude towards cryptocurrencies. Thus, the regulator sees signs of illegally issued securities in many cryptocurrencies that operate on the Proof-of-Stake (PoS) algorithm.
According to Gensler, the regulator was forced to approve the applications due to “changed circumstances.” This is likely a reference to the recent litigation where Grayscale filed a request with the Commission to transform its Bitcoin fund into a spot ETF. The judge then concluded that the regulator had wrongfully rejected the company's application.
Gensler also warned investors about the numerous risks associated with Bitcoin.
Meanwhile:
→ Funds whose applications have been approved are reducing fees one after another, trying to win the competition for investors.
→ Bank of England (BOE) Governor Andrew Bailey, speaking before the Treasury Committee of the United Kingdom Parliament, called Bitcoin ineffective.
→ Cryptocurrency exchange apps have become unavailable in India due to the introduction of stricter legislation governing cryptocurrencies.
The chart shows that the price of BTC/USD did not change much after the official SEC decision. This highlights that the price of Bitcoin on exchanges has already taken into account the high probability of ETF approval.
We wrote earlier that Bitcoin is starting the year with bullish sentiment.
Note that:
→ The price of Bitcoin has reached the upper limit of the long-term channel (shown in blue, it is shown more fully in the post at the link above). Technically, resistance to growth should be expected from the upper border, which is, in principle, observed on the chart.
→ On January 2, the bulls tried to break through the A-B consolidation zone, but failed.
→ On January 3, there was an attempt at a bearish breakout (shown by an arrow), and it also turned out to be unsuccessful.
→ Recent price action shows that line A (44,400) is now acting as support.
Fundamentally, the price could be pushed higher by news that demand for new ETFs is exceeding expectations. But even if the price continues to rise on the new impulse, it will face the psychological mark of 50k per coin — it is possible that a false bullish breakout of the round figure will occur.
To benefit from the rise and fall of Bitcoin, consider enlisting the services of a trusted broker like FXOpen.
CFDs are complex instruments and come with a high risk of losing your money.
This article represents the opinion of the Companies operating under the FXOpen brand only. It is not to be construed as an offer, solicitation, or recommendation with respect to products and services provided by the Companies operating under the FXOpen brand, nor is it to be considered financial advice.
At FXOpen UK and FXOpen AU, Cryptocurrency CFDs are only available for trading by those clients categorised as Professional clients under FCA Rules and Professional clients under ASIC Rules, respectively. They are not available for trading by Retail clients.
#stockmarket #MarketNews #marketanalysis
Nikkei 225 sets 21st century high
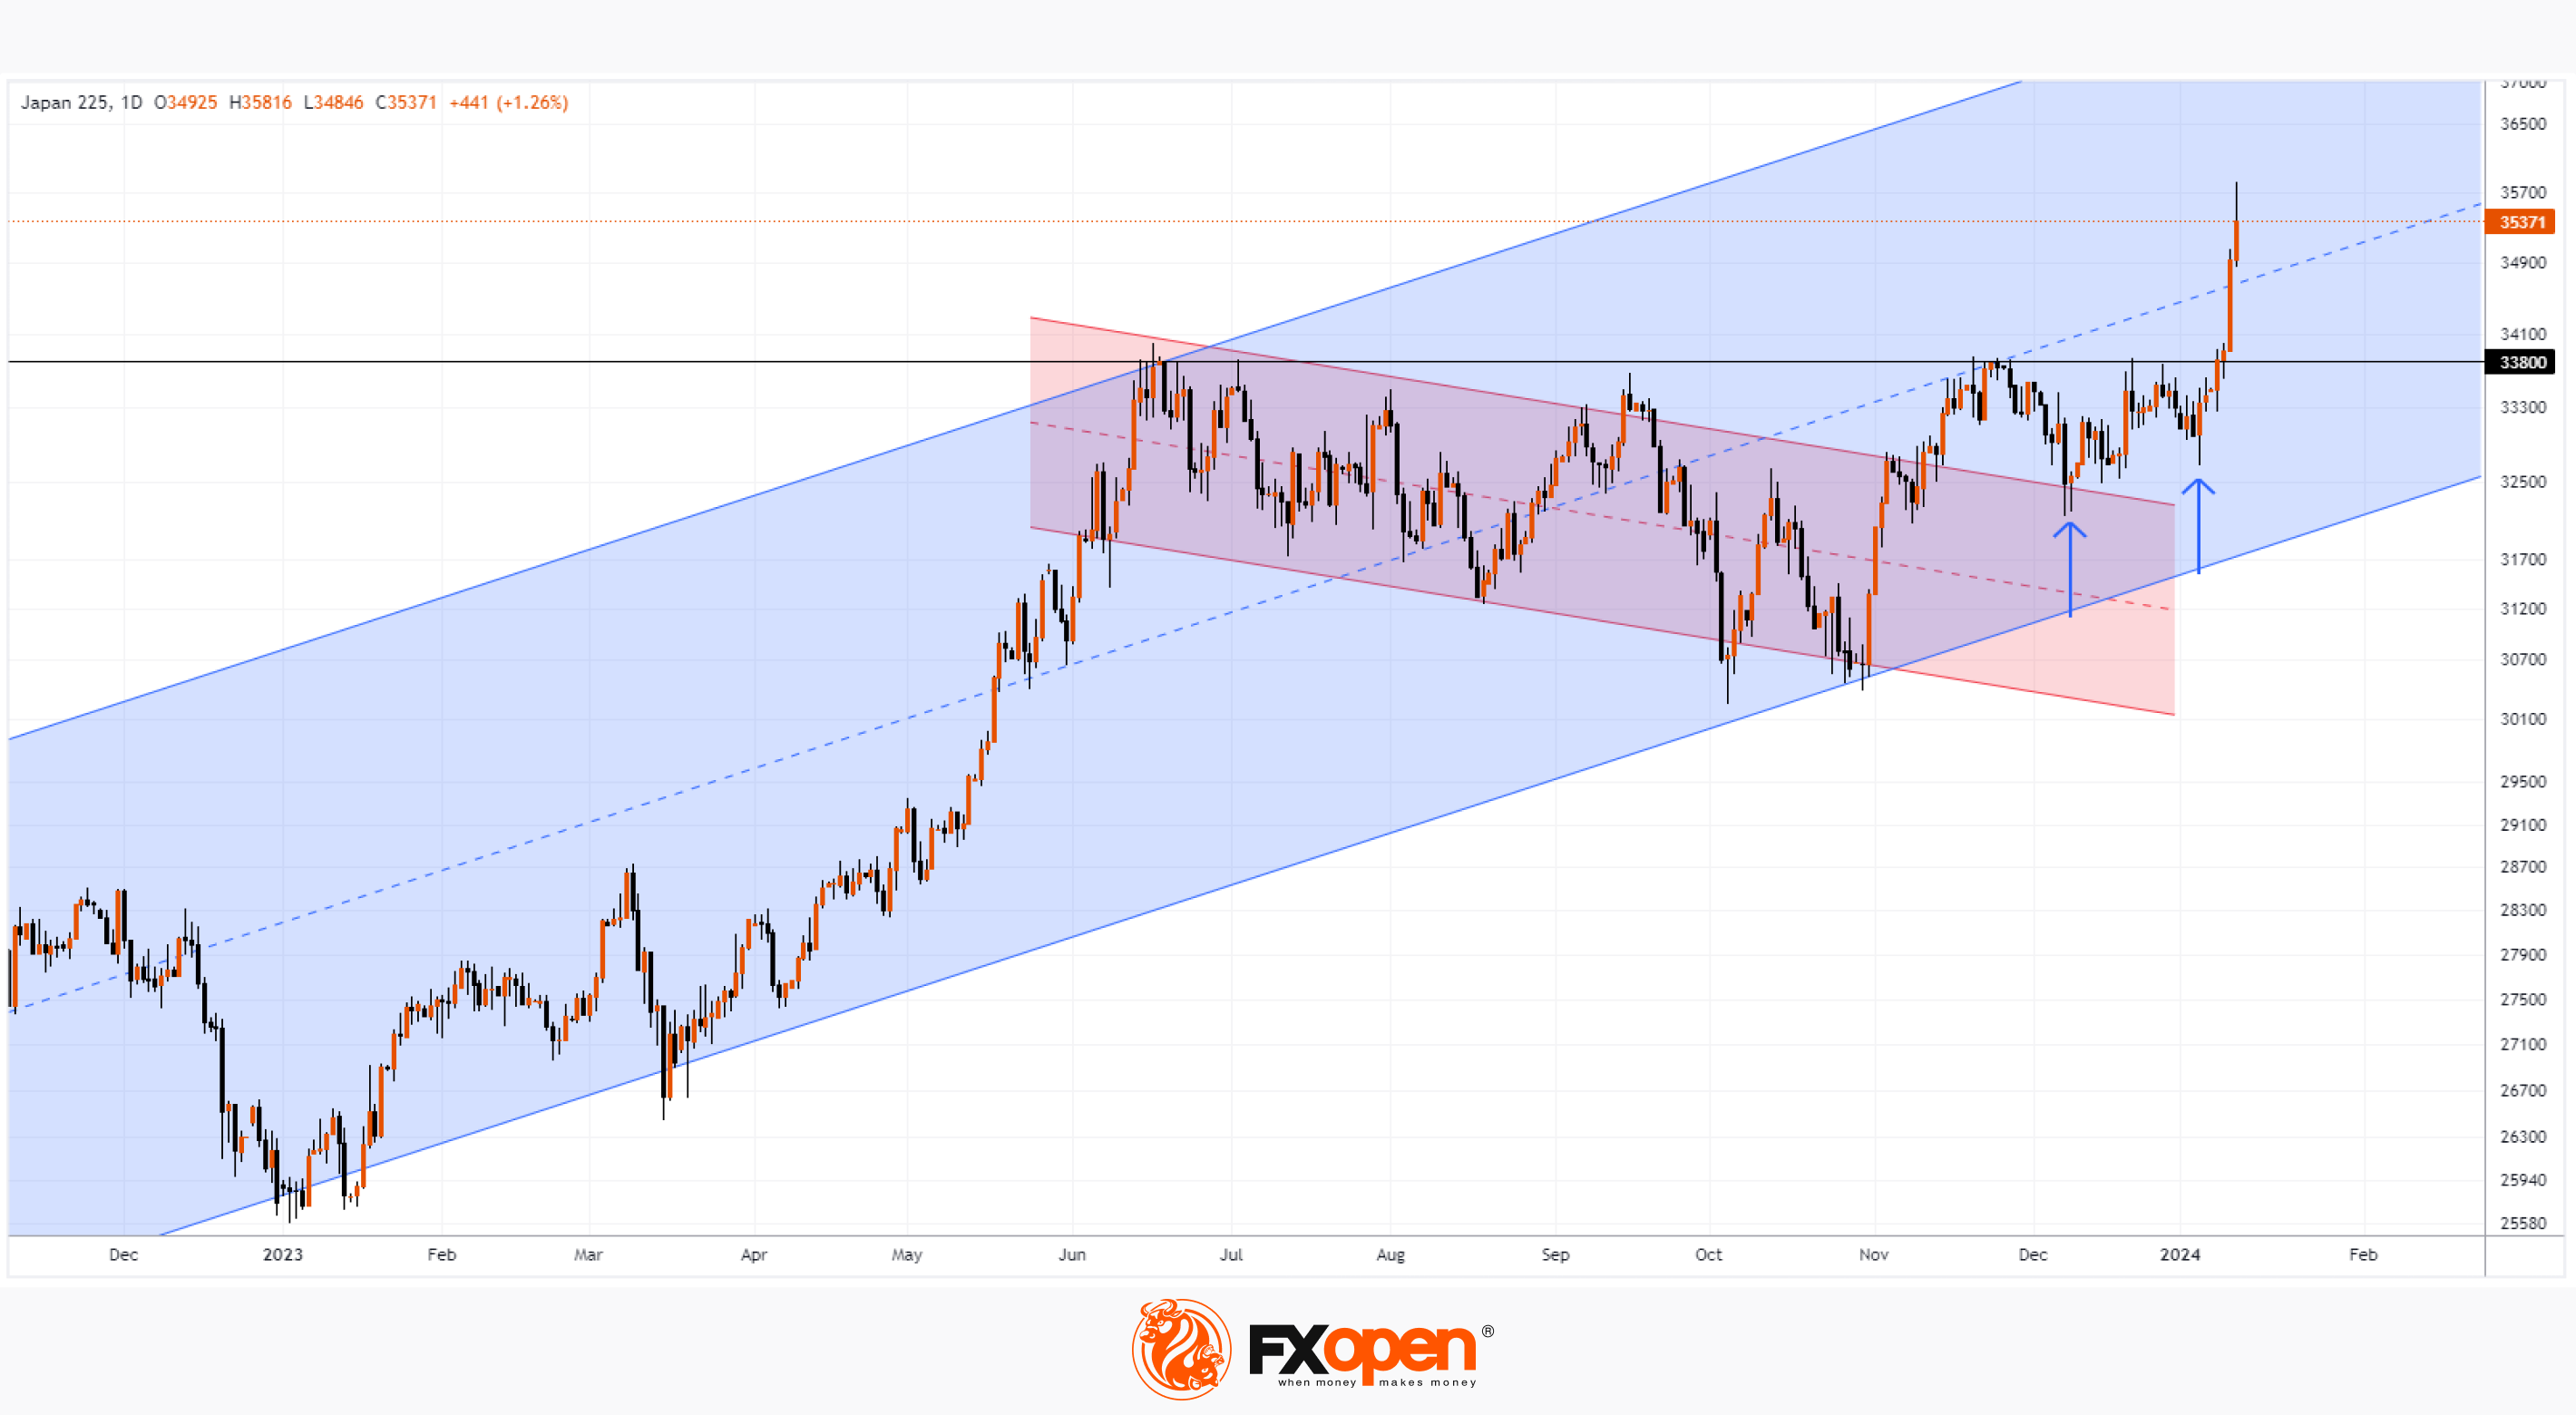
As the chart shows, this morning the Nikkei 225 price exceeded 35,700, its highest level in decades.
The Nikkei 225 index reached its all-time high on December 30, 1989, at 38,957.44 points. This was against the backdrop of Japan's economic boom, which began in the 1980s and continued until the early 1990s.
Nikkei 225 growth is supported by lower inflation:
→ in Japan: the latest data showed an annual inflation rate of 2.8% - lower than a series of more than 10 previous values, all of which were above 3%. This reduces fears that the Bank of Japan will raise interest rates and limit its current economic stimulus policies.
→ in the USA. Today, we remind you that at 16:30 GMT+3 inflation data in the USA will be published. They are also expected to show a slowdown in inflation. Therefore, market participants believe in a reduction in Fed rates, which can give impetus to the development of companies.
The NIKKEI chart shows that:
→ the price is in an upward trend (marked by a blue channel);
→ the price has overcome the correction period (marked by a red channel), which can be interpreted as a “flag” figure;
→ On December 7, the price tested the upper border of the “flag” (shown by the first arrow);
→ On January 4, the price formed a higher low (shown by the second arrow);
→ has overcome the median line of the channel (blue dotted line).
Indicators show overbought, the long upper shadow on the last candle indicates that the bears are activating, so a pullback should not come as a surprise. The median line could help the bulls consolidate their progress, and the 33800 level should now be regarded as important support.
To benefit from fluctuations in financial markets, use the services of a reliable broker FXOpen.
Nikkei 225 sets 21st century high
As the chart shows, this morning the Nikkei 225 price exceeded 35,700, its highest level in decades.
The Nikkei 225 index reached its all-time high on December 30, 1989, at 38,957.44 points. This was against the backdrop of Japan's economic boom, which began in the 1980s and continued until the early 1990s.
Nikkei 225 growth is supported by lower inflation:
→ in Japan: the latest data showed an annual inflation rate of 2.8% - lower than a series of more than 10 previous values, all of which were above 3%. This reduces fears that the Bank of Japan will raise interest rates and limit its current economic stimulus policies.
→ in the USA. Today, we remind you that at 16:30 GMT+3 inflation data in the USA will be published. They are also expected to show a slowdown in inflation. Therefore, market participants believe in a reduction in Fed rates, which can give impetus to the development of companies.
The NIKKEI chart shows that:
→ the price is in an upward trend (marked by a blue channel);
→ the price has overcome the correction period (marked by a red channel), which can be interpreted as a “flag” figure;
→ On December 7, the price tested the upper border of the “flag” (shown by the first arrow);
→ On January 4, the price formed a higher low (shown by the second arrow);
→ has overcome the median line of the channel (blue dotted line).
Indicators show overbought, the long upper shadow on the last candle indicates that the bears are activating, so a pullback should not come as a surprise. The median line could help the bulls consolidate their progress, and the 33800 level should now be regarded as important support.
To benefit from fluctuations in financial markets, use the services of a reliable broker FXOpen.
#MarketNews #inflation #marketanalysis
Inflation Data Changes Market Sentiment
US CPI data published yesterday did not meet expectations. Analysts predicted 3.2%, but in fact it turned out = 3.4% (value a month ago = 3.1%). This hardly means a reversal of the large-scale trend toward weakening inflation (a year ago CPI = 6.5%), but to some extent investors have become wary. According to FedWatch, expectations for a rate cut by the Federal Reserve in March dropped to about 65% (before the news was about 70%).
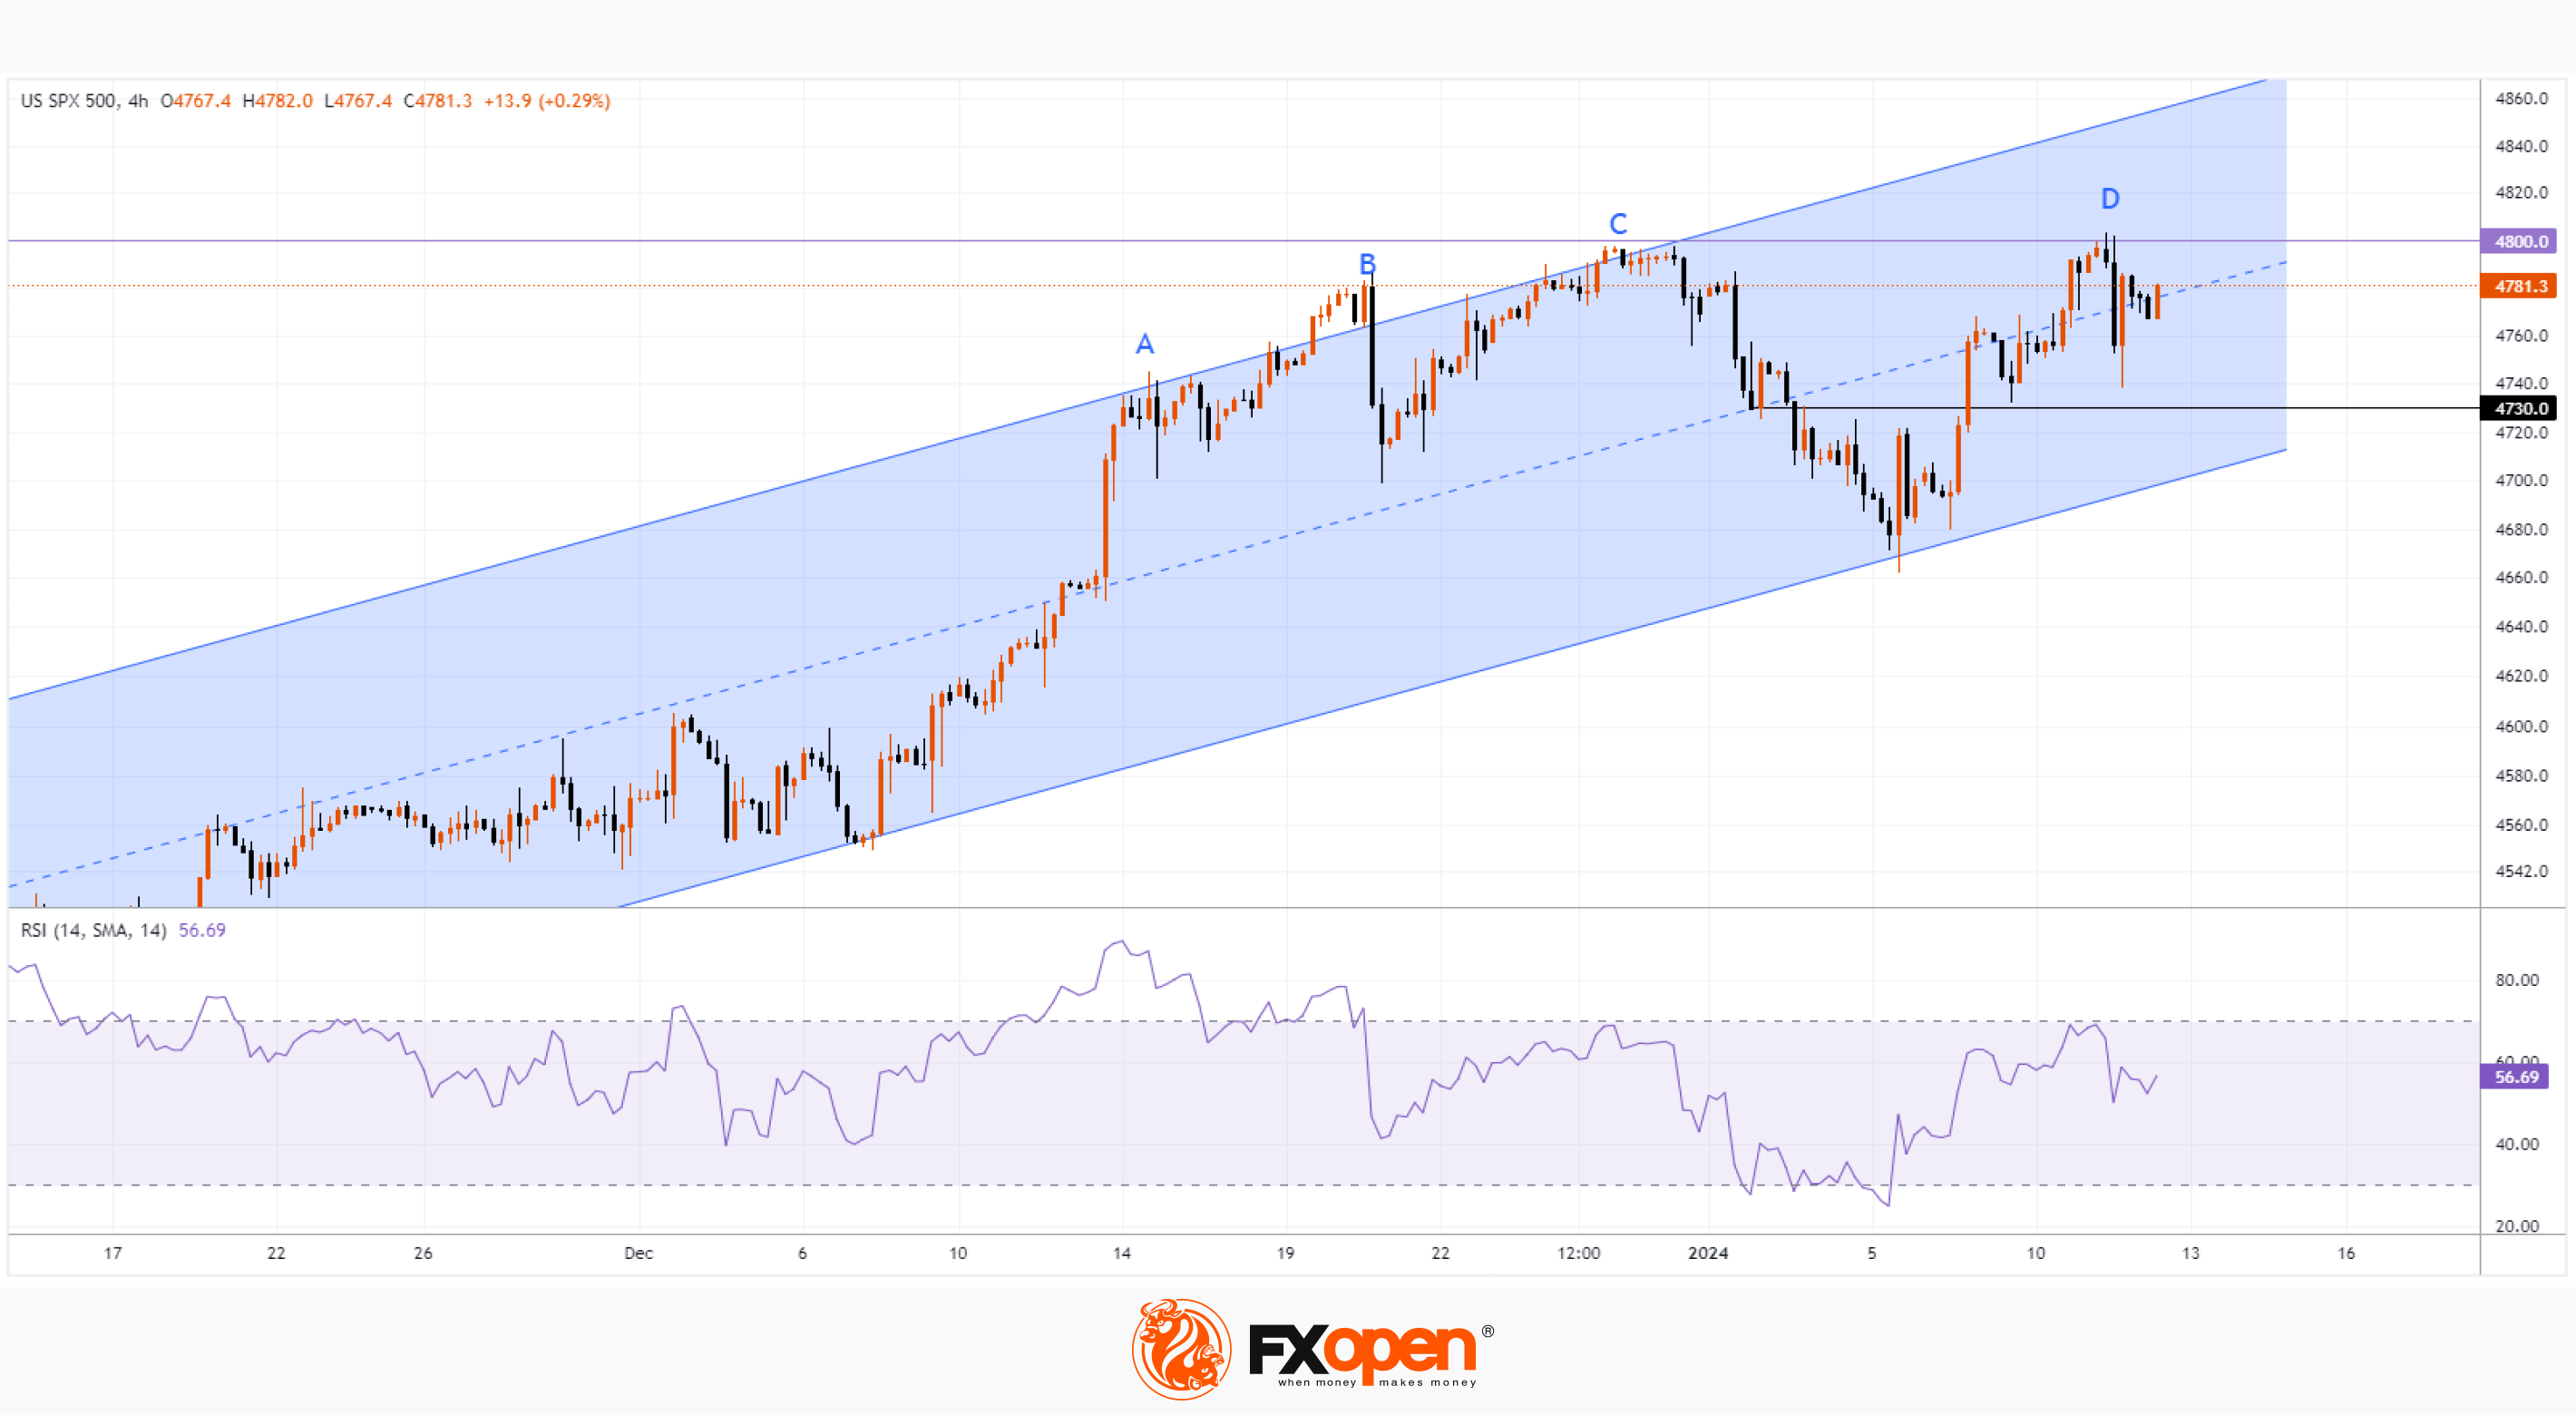
The publication of the news caused a noticeable surge in volatility in financial markets. Let's pay attention to the S&P 500 chart. The index price is within an uptrend (as shown by the blue channel), however, this trend may change:
→ Tops A-B-C form divergence with the RSI indicator — a sign of weakening demand near the upper border of the channel.
→ Yesterday, the price only slightly and briefly exceeded the A-B-C formation, forming top D. That is, a false bullish breakout was formed. This type of price behavior at top D confirms the activity of the bears at the level of 4,800.
Formally, the upward trend is still in force, but 4,800 may become an important test of the bulls’ perseverance. One marker could be today's PPI data (to be published at 16:30 GMT+3), as well as reaction to earnings reports from major banks, including JPMorgan Chase, Citigroup, Bank of America and Wells Fargo.
If they turn out to be disappointing, it is possible that the S&P 500 may fall to the lower border of the ascending channel.
To benefit from fluctuations in stock indices, consider enlisting the services of a trusted broker like FXOpen.
CFDs are complex instruments and come with a high risk of losing your money.
This article represents the opinion of the Companies operating under the FXOpen brand only. It is not to be construed as an offer, solicitation, or recommendation with respect to products and services provided by the Companies operating under the FXOpen brand, nor is it to be considered financial advice.
Inflation Data Changes Market Sentiment
US CPI data published yesterday did not meet expectations. Analysts predicted 3.2%, but in fact it turned out = 3.4% (value a month ago = 3.1%). This hardly means a reversal of the large-scale trend toward weakening inflation (a year ago CPI = 6.5%), but to some extent investors have become wary. According to FedWatch, expectations for a rate cut by the Federal Reserve in March dropped to about 65% (before the news was about 70%).
The publication of the news caused a noticeable surge in volatility in financial markets. Let's pay attention to the S&P 500 chart. The index price is within an uptrend (as shown by the blue channel), however, this trend may change:
→ Tops A-B-C form divergence with the RSI indicator — a sign of weakening demand near the upper border of the channel.
→ Yesterday, the price only slightly and briefly exceeded the A-B-C formation, forming top D. That is, a false bullish breakout was formed. This type of price behavior at top D confirms the activity of the bears at the level of 4,800.
Formally, the upward trend is still in force, but 4,800 may become an important test of the bulls’ perseverance. One marker could be today's PPI data (to be published at 16:30 GMT+3), as well as reaction to earnings reports from major banks, including JPMorgan Chase, Citigroup, Bank of America and Wells Fargo.
If they turn out to be disappointing, it is possible that the S&P 500 may fall to the lower border of the ascending channel.
To benefit from fluctuations in stock indices, consider enlisting the services of a trusted broker like FXOpen.
CFDs are complex instruments and come with a high risk of losing your money.
This article represents the opinion of the Companies operating under the FXOpen brand only. It is not to be construed as an offer, solicitation, or recommendation with respect to products and services provided by the Companies operating under the FXOpen brand, nor is it to be considered financial advice.
#bitcoin #cryptonews #stockmarket #bitcoinetf
Weekly Market Wrap With Gary Thomson: FTSE, NIKKEI, AUD/USD, BITCOIN ETFs
Get the latest scoop on the week's hottest headlines, all in one convenient video. Join Gary Thomson, the COO of -FXOpen UK, as he breaks down the most significant news reports and shares his expert insights.
🔸 High hopes for FTSE 100 deflate after first week of 2024
🔸Nikkei 225 sets 21st century high
🔸 Inflation in Australia continues to decline. AUD/USD tests important support #Inflation
🔸 Finally! The SEC approves all 11 applications for Bitcoin ETFs
Stay in the know and empower yourself with our short, yet power-packed video. Watch it now and stay updated with FXOpen. Don't miss out on this invaluable opportunity to sharpen your trading skills and make informed decisions.📈
https://cutt.ly/MwJAjYP8
To take advantage of price fluctuations in the foreign exchange markets, consider enlisting the services of a reliable broker like FXOpen.
⚠️
This forecast represents FXOpen Companies opinion only, it should not be construed as an offer, invitation or recommendation in respect to FXOpen Companies products and services or as financial advice
Weekly Market Wrap With Gary Thomson: FTSE, NIKKEI, AUD/USD, BITCOIN ETFs
Get the latest scoop on the week's hottest headlines, all in one convenient video. Join Gary Thomson, the COO of -FXOpen UK, as he breaks down the most significant news reports and shares his expert insights.
🔸 High hopes for FTSE 100 deflate after first week of 2024
🔸Nikkei 225 sets 21st century high
🔸 Inflation in Australia continues to decline. AUD/USD tests important support #Inflation
🔸 Finally! The SEC approves all 11 applications for Bitcoin ETFs
Stay in the know and empower yourself with our short, yet power-packed video. Watch it now and stay updated with FXOpen. Don't miss out on this invaluable opportunity to sharpen your trading skills and make informed decisions.📈
https://cutt.ly/MwJAjYP8
To take advantage of price fluctuations in the foreign exchange markets, consider enlisting the services of a reliable broker like FXOpen.
⚠️
This forecast represents FXOpen Companies opinion only, it should not be construed as an offer, invitation or recommendation in respect to FXOpen Companies products and services or as financial advice
YouTube
Weekly Market Wrap With Gary Thomson: FTSE, NIKKEI, AUD/USD, BITCOIN ETFs
Get the latest scoop on the week's hottest headlines, all in one convenient video. Join Gary Thomson, the COO of FXOpen UK, as he breaks down the most significant news reports and shares his expert insights.
00:30 High hopes for FTSE 100 deflate after…
00:30 High hopes for FTSE 100 deflate after…
#marketanalysis #bitcoin #crypto
BTC/USD price and the “Three Black Crows” pattern
On January 11, the highly publicized Bitcoin ETF began trading after it was officially approved by the SEC. On this day, the price of Bitcoin exceeded USD 48,800, as shown by the chart. Bloomberg writes that new US spot funds achieved net inflows of USD 819 million in the first two days of trading.
However, from the high on January 11, a dizzying fall began, and already at the low on January 12, Bitcoin was worth less than USD 41,800. This dynamic may illustrate the “buy the rumors, sell the facts” strategy, which we wrote about on January 3 when predicting the price of Bitcoin in 2024.
News of the ETF's approval sent the ATR above 1,100 on the 4-hour chart, the last time it did so was in mid-June 2022. The market was overly active, and what is important is that three bearish candles (marked with an arrow) summed up this activity. They can be interpreted as the three black crows pattern.
According to statistics from Tim Bulkowski, this pattern works in 78% of cases and means a trend change from bullish to bearish. According to CandleScanner statistics for 20 years, collected on the S&P 500 index market, the pattern turned out to be false only in 18.6% of cases out of 543 occurrences.
Does this mean that the statistics will work on the Bitcoin price chart?
So far, the price is still within the bullish trend (shown as a channel).
The nearest support levels: 41,500, 40,600, the lower border of the channel.
The nearest resistance levels: 44,800, the median line of the channel.
Let’s assume that the beginning of the week will show a continued influx of capital into the Bitcoin ETF. At the same time, it is possible that the price will form a rebound from one of the support lines. But what if these investors also fall into the trap that those who bought Bitcoin on January 11-12 are now in? Then we may witness a breakdown of the lower border of the blue channel, which will confirm the importance of the three black crows pattern.
To benefit from the rise and fall of prices in the cryptocurrency markets, consider enlisting the services of a trusted broker like FXOpen.
CFDs are complex instruments and come with a high risk of losing your money.
This article represents the opinion of the Companies operating under the FXOpen brand only. It is not to be construed as an offer, solicitation, or recommendation with respect to products and services provided by the Companies operating under the FXOpen brand, nor is it to be considered financial advice.
At FXOpen UK and FXOpen AU, Cryptocurrency CFDs are only available for trading by those clients categorised as Professional clients under FCA Rules and Professional clients under ASIC Rules, respectively. They are not available for trading by Retail clients.
BTC/USD price and the “Three Black Crows” pattern
On January 11, the highly publicized Bitcoin ETF began trading after it was officially approved by the SEC. On this day, the price of Bitcoin exceeded USD 48,800, as shown by the chart. Bloomberg writes that new US spot funds achieved net inflows of USD 819 million in the first two days of trading.
However, from the high on January 11, a dizzying fall began, and already at the low on January 12, Bitcoin was worth less than USD 41,800. This dynamic may illustrate the “buy the rumors, sell the facts” strategy, which we wrote about on January 3 when predicting the price of Bitcoin in 2024.
News of the ETF's approval sent the ATR above 1,100 on the 4-hour chart, the last time it did so was in mid-June 2022. The market was overly active, and what is important is that three bearish candles (marked with an arrow) summed up this activity. They can be interpreted as the three black crows pattern.
According to statistics from Tim Bulkowski, this pattern works in 78% of cases and means a trend change from bullish to bearish. According to CandleScanner statistics for 20 years, collected on the S&P 500 index market, the pattern turned out to be false only in 18.6% of cases out of 543 occurrences.
Does this mean that the statistics will work on the Bitcoin price chart?
So far, the price is still within the bullish trend (shown as a channel).
The nearest support levels: 41,500, 40,600, the lower border of the channel.
The nearest resistance levels: 44,800, the median line of the channel.
Let’s assume that the beginning of the week will show a continued influx of capital into the Bitcoin ETF. At the same time, it is possible that the price will form a rebound from one of the support lines. But what if these investors also fall into the trap that those who bought Bitcoin on January 11-12 are now in? Then we may witness a breakdown of the lower border of the blue channel, which will confirm the importance of the three black crows pattern.
To benefit from the rise and fall of prices in the cryptocurrency markets, consider enlisting the services of a trusted broker like FXOpen.
CFDs are complex instruments and come with a high risk of losing your money.
This article represents the opinion of the Companies operating under the FXOpen brand only. It is not to be construed as an offer, solicitation, or recommendation with respect to products and services provided by the Companies operating under the FXOpen brand, nor is it to be considered financial advice.
At FXOpen UK and FXOpen AU, Cryptocurrency CFDs are only available for trading by those clients categorised as Professional clients under FCA Rules and Professional clients under ASIC Rules, respectively. They are not available for trading by Retail clients.
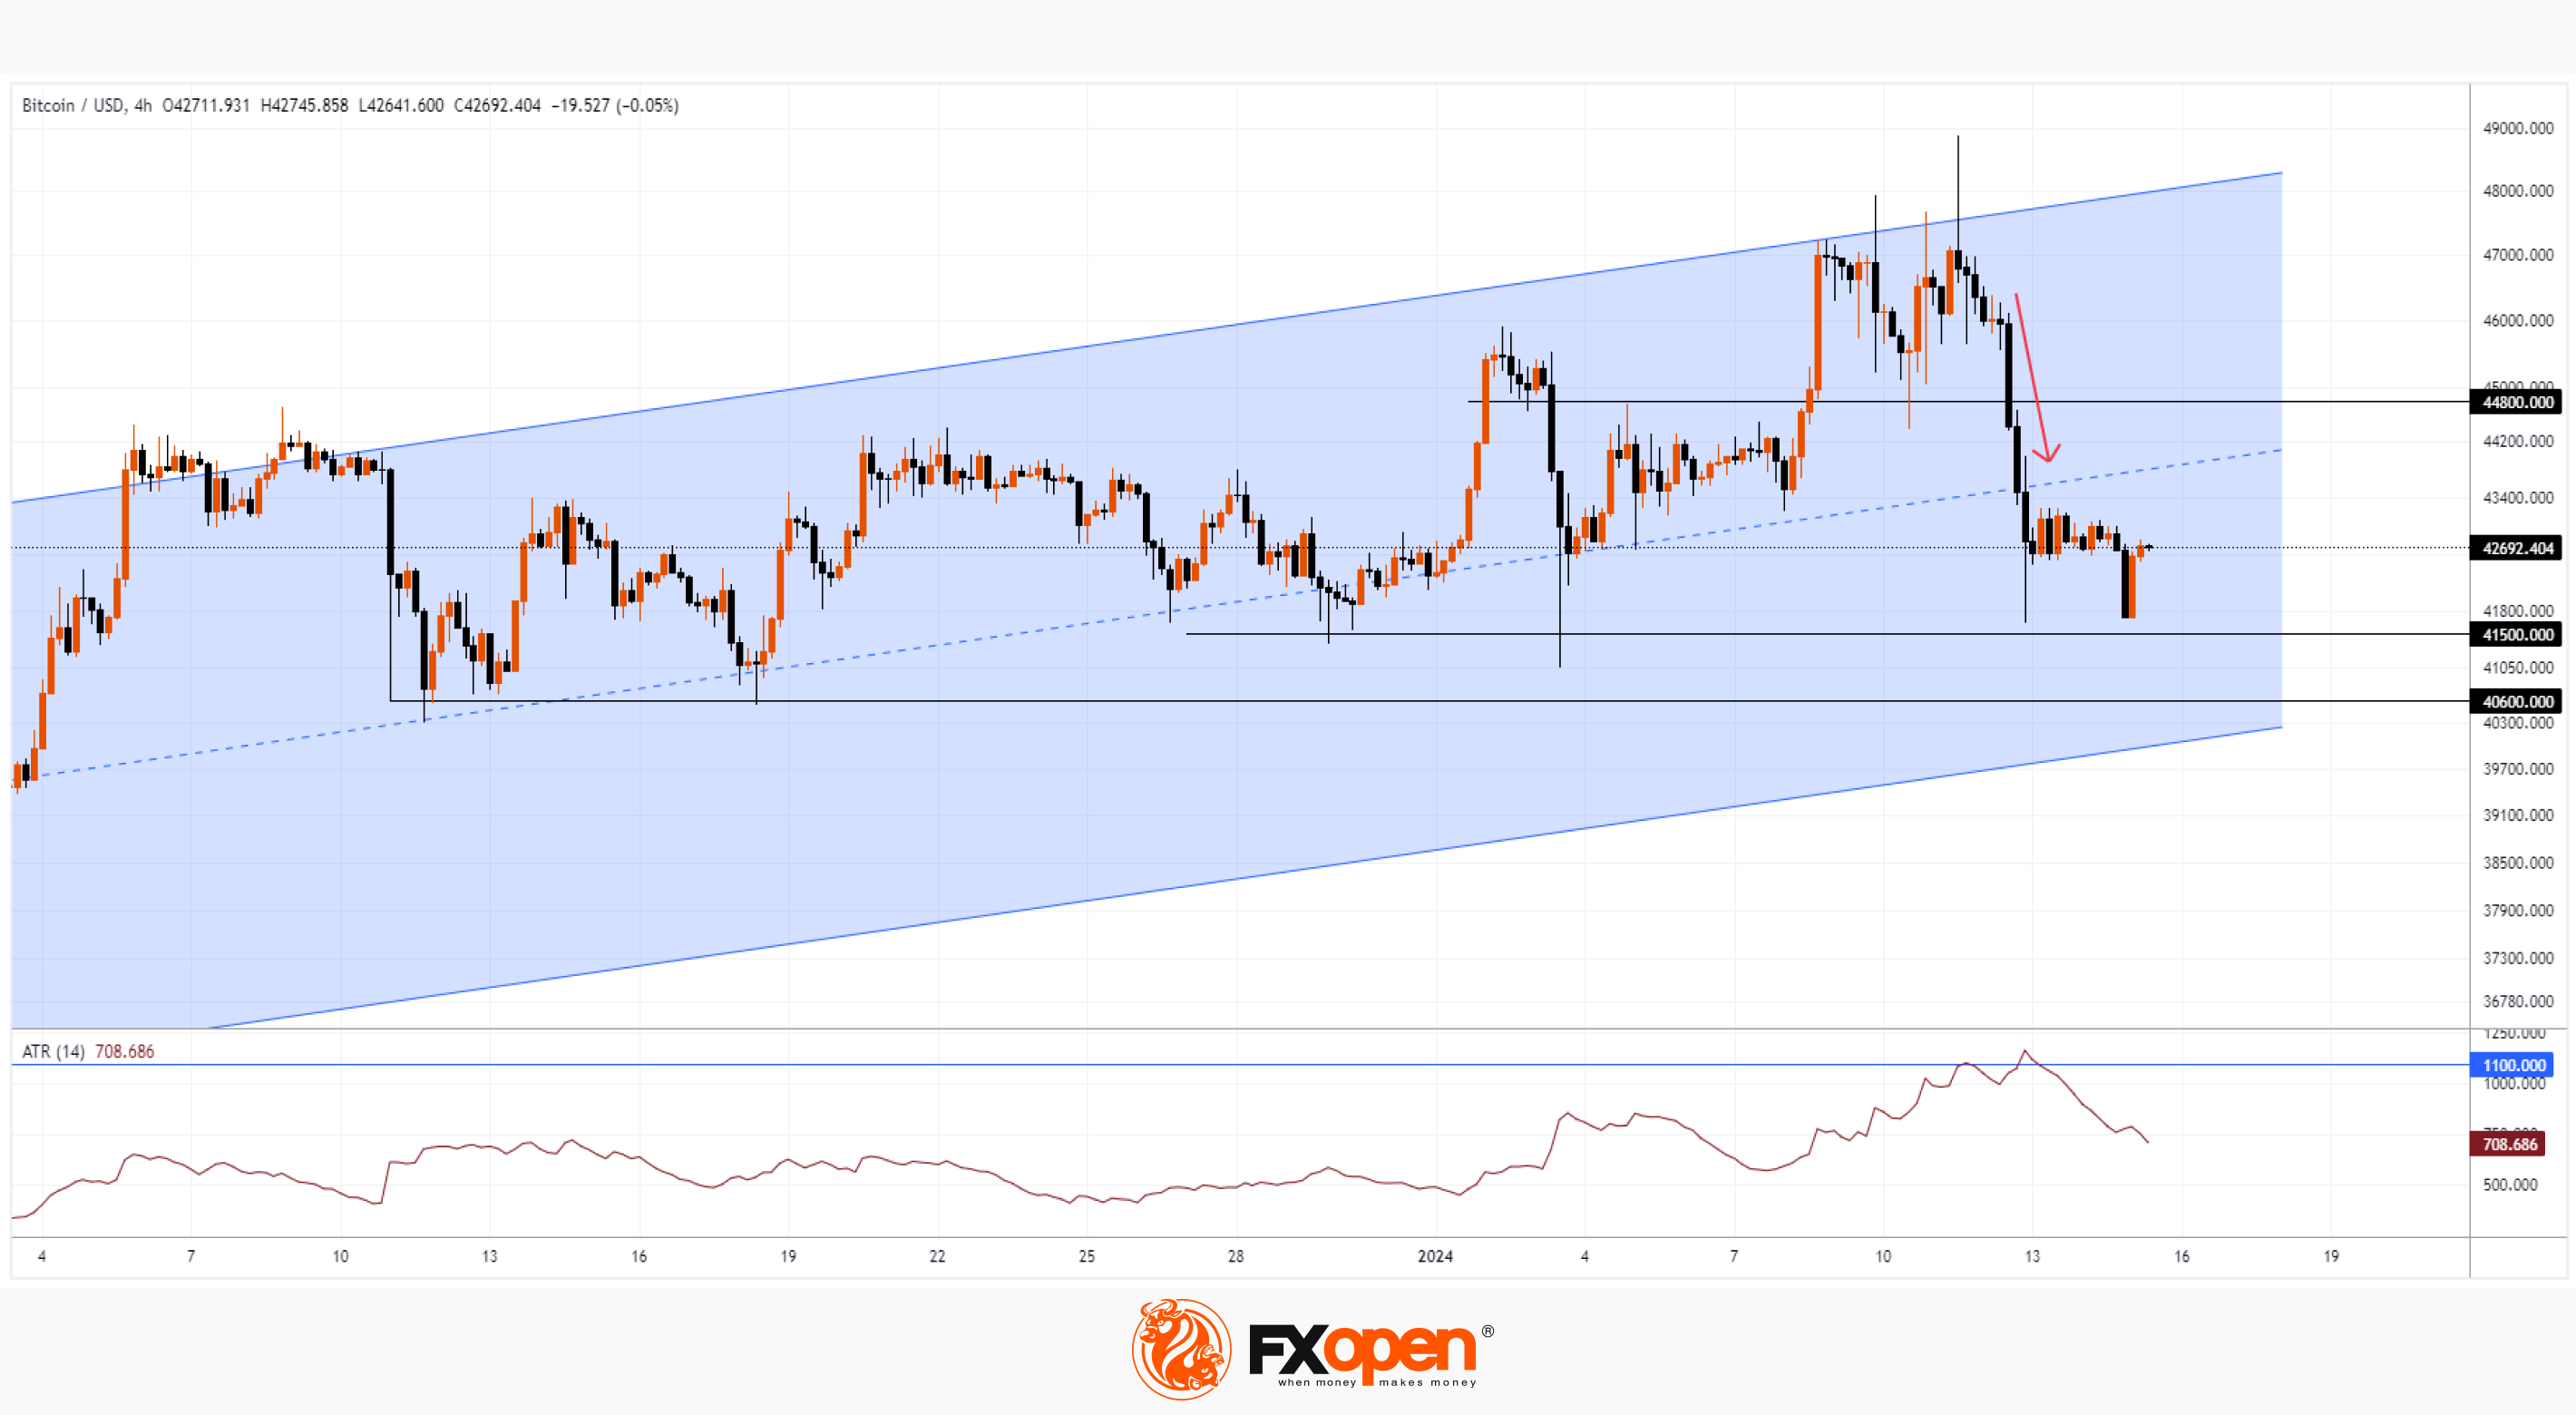
#MarketNews #stockmarket #MSFT #AAPL
Microsoft Becomes the Most Expensive Company in the World, Surpassing Apple
According to the results of trading shares of AAPL and MSFT yesterday, the market capitalization is:
→ Apple: USD 2.875 trillion.
→ Microsoft: USD 2.887 trillion.
This is facilitated by:
→ positive expectations of investors in shares of MSFT, connected with the leading positions of the company in the field of artificial intelligence;
→ negative sentiments regarding AAPL and demand for its products (as we wrote on January 4). Moreover, the New York Times writes that the Justice Department is preparing to initiate a large-scale antitrust case against Apple because of the dominant position of Apple's devices on the market and the measures that the company used to protect against threats to its business.
MarketWatch provides FactSet statistics on analysts' forecasts:
→ AAPL: +6% for the next 12 months, MSFT: +9%.
→ MSFT has such ratings: "buy": 90%, "neutral": 10%, "sell": 0%.
→ AAPL has such ratings: "buy": 57%, "neutral": 34%, "sell": 9%.
While the price of AAPL is below the maximum of 2023 by approximately 6%, the price of MSFT shares managed to renew the historical record in 2024: at the peak on January 11, MSFT gave more than 390 USD per share.
On January 31, data will be published on Microsoft’s Q4. It is not excluded that while waiting for positive figures, the price of the stock will increase, approaching the psychological level of 400 USD.
The MSFT chart shows that:
→ the price is in an upward trend (shown by the blue channel), moving upwards;
→ the figure of consolidation А-В was broken by bulls, which demonstrates their intentions to set new historical records;
→ at the same time, the acceleration of the growth can make the stock overbought (the RSI indicator is near the level = 70).
To take advantage of fluctuating prices of shares of popular companies, consider enlisting the services of a trusted broker like FXOpen.
CFDs are complex instruments and come with a high risk of losing your money.
This article represents the opinion of the Companies operating under the FXOpen brand only. It is not to be construed as an offer, solicitation, or recommendation with respect to products and services provided by the Companies operating under the FXOpen brand, nor is it to be considered financial advice.
Microsoft Becomes the Most Expensive Company in the World, Surpassing Apple
According to the results of trading shares of AAPL and MSFT yesterday, the market capitalization is:
→ Apple: USD 2.875 trillion.
→ Microsoft: USD 2.887 trillion.
This is facilitated by:
→ positive expectations of investors in shares of MSFT, connected with the leading positions of the company in the field of artificial intelligence;
→ negative sentiments regarding AAPL and demand for its products (as we wrote on January 4). Moreover, the New York Times writes that the Justice Department is preparing to initiate a large-scale antitrust case against Apple because of the dominant position of Apple's devices on the market and the measures that the company used to protect against threats to its business.
MarketWatch provides FactSet statistics on analysts' forecasts:
→ AAPL: +6% for the next 12 months, MSFT: +9%.
→ MSFT has such ratings: "buy": 90%, "neutral": 10%, "sell": 0%.
→ AAPL has such ratings: "buy": 57%, "neutral": 34%, "sell": 9%.
While the price of AAPL is below the maximum of 2023 by approximately 6%, the price of MSFT shares managed to renew the historical record in 2024: at the peak on January 11, MSFT gave more than 390 USD per share.
On January 31, data will be published on Microsoft’s Q4. It is not excluded that while waiting for positive figures, the price of the stock will increase, approaching the psychological level of 400 USD.
The MSFT chart shows that:
→ the price is in an upward trend (shown by the blue channel), moving upwards;
→ the figure of consolidation А-В was broken by bulls, which demonstrates their intentions to set new historical records;
→ at the same time, the acceleration of the growth can make the stock overbought (the RSI indicator is near the level = 70).
To take advantage of fluctuating prices of shares of popular companies, consider enlisting the services of a trusted broker like FXOpen.
CFDs are complex instruments and come with a high risk of losing your money.
This article represents the opinion of the Companies operating under the FXOpen brand only. It is not to be construed as an offer, solicitation, or recommendation with respect to products and services provided by the Companies operating under the FXOpen brand, nor is it to be considered financial advice.
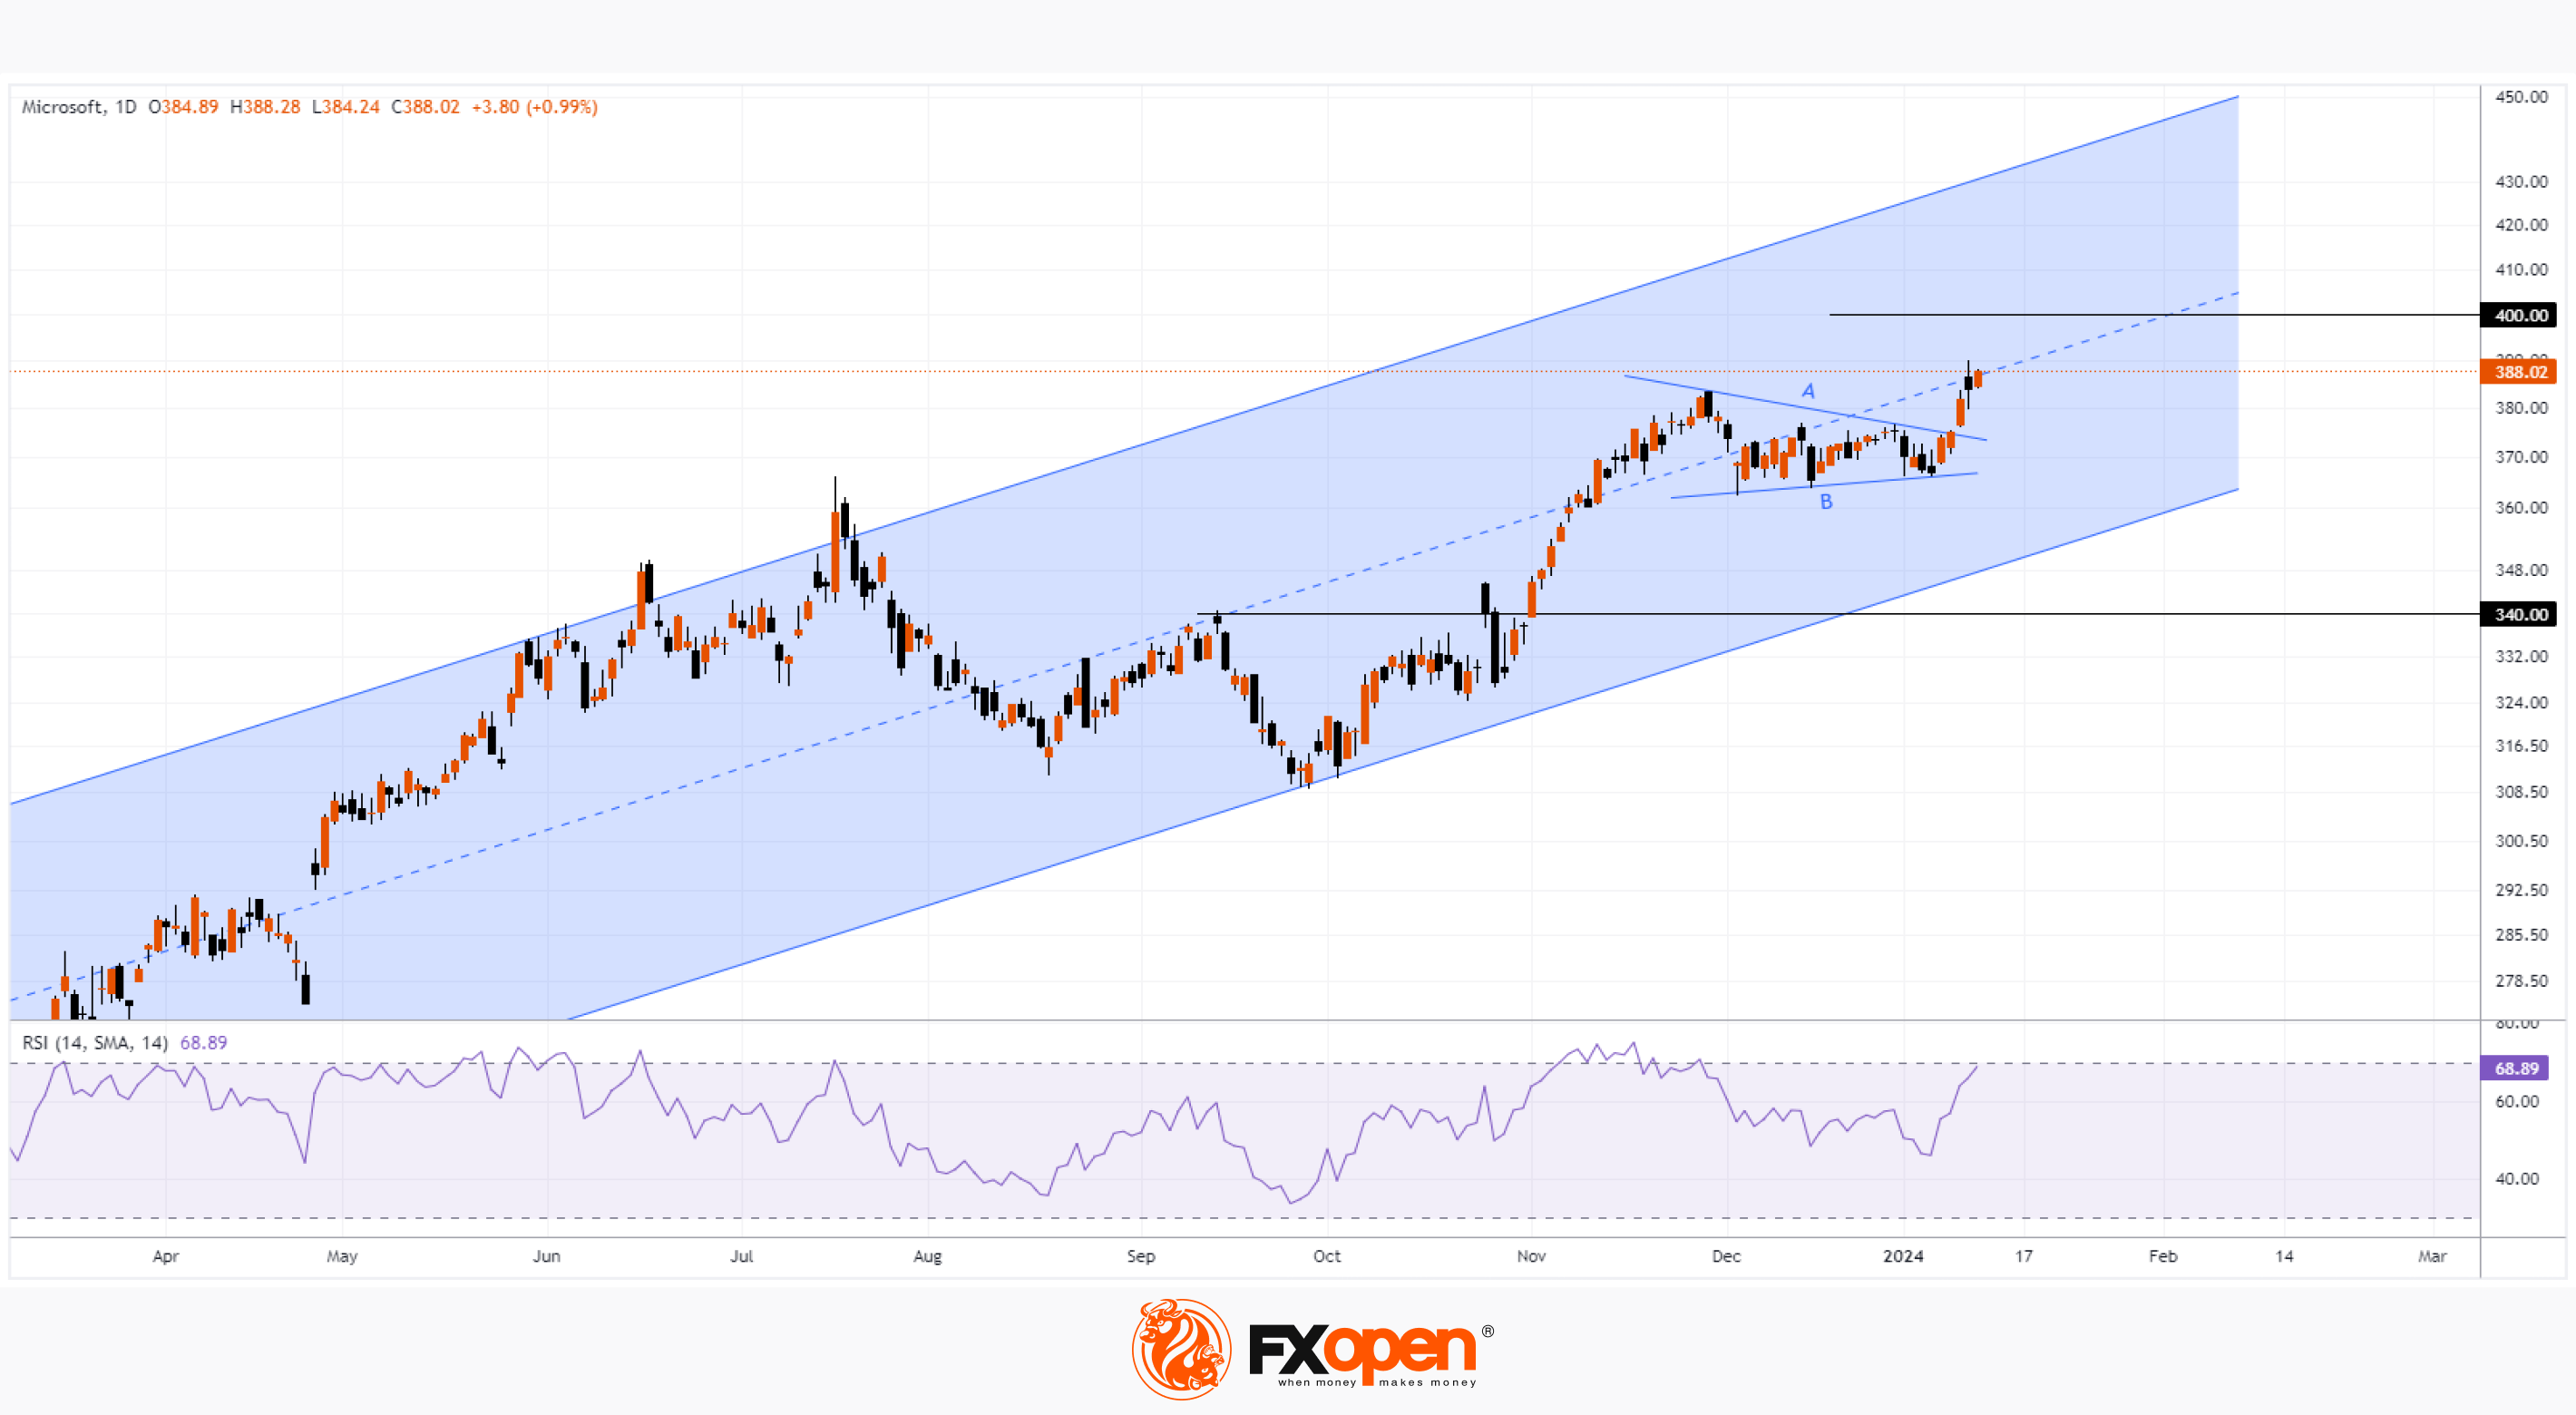
#marketanalysis #usdollar #MarketNews
The Dollar Continues to Strengthen since the Beginning of the Year
The dollar index is hovering at a one-month high against a basket of currencies as remarks from Federal Reserve Chairman Christopher Waller dampened expectations of a March rate cut.
He said that while the U.S. is "within striking distance" of the Fed's 2% inflation target, the Fed should not rush to cut its benchmark interest rate until it is clear that lower inflation will be sustainable.
Market expectations for a rate cut in March fell to 62.2%, down from a forecast of 76.9% in the previous session, according to CME's FedWatch Tool.
The EUR/USD chart today shows that:
→ The rate dropped below the important psychological mark of 1.09 euros per dollar. Now (in case of testing) this level can serve as resistance.
→ The decline in EUR/USD from the peak at the end of December 2023 has already exceeded 2.3%. Will the trend continue?
Technical analysis of EUR/USD suggests that the strengthening of the US dollar may slow down, as the price is near important support — namely the lower boundary of the ascending channel that has been in effect since the end of last year (the channel is plotted along the turning points indicated by the arrows). It is possible that we will see a rebound from the lower border and by its nature we will be able to judge what the chances of the bulls are to keep the price within the channel.
Today at 16:30 GMT+3, US retail sales data will be published, be prepared for spikes in volatility.
To take advantage of price fluctuations in the foreign exchange markets, consider enlisting the services of a trusted broker like FXOpen.
CFDs are complex instruments and come with a high risk of losing your money.
This article represents the opinion of the Companies operating under the FXOpen brand only. It is not to be construed as an offer, solicitation, or recommendation with respect to products and services provided by the Companies operating under the FXOpen brand, nor is it to be considered financial advice.
The Dollar Continues to Strengthen since the Beginning of the Year
The dollar index is hovering at a one-month high against a basket of currencies as remarks from Federal Reserve Chairman Christopher Waller dampened expectations of a March rate cut.
He said that while the U.S. is "within striking distance" of the Fed's 2% inflation target, the Fed should not rush to cut its benchmark interest rate until it is clear that lower inflation will be sustainable.
Market expectations for a rate cut in March fell to 62.2%, down from a forecast of 76.9% in the previous session, according to CME's FedWatch Tool.
The EUR/USD chart today shows that:
→ The rate dropped below the important psychological mark of 1.09 euros per dollar. Now (in case of testing) this level can serve as resistance.
→ The decline in EUR/USD from the peak at the end of December 2023 has already exceeded 2.3%. Will the trend continue?
Technical analysis of EUR/USD suggests that the strengthening of the US dollar may slow down, as the price is near important support — namely the lower boundary of the ascending channel that has been in effect since the end of last year (the channel is plotted along the turning points indicated by the arrows). It is possible that we will see a rebound from the lower border and by its nature we will be able to judge what the chances of the bulls are to keep the price within the channel.
Today at 16:30 GMT+3, US retail sales data will be published, be prepared for spikes in volatility.
To take advantage of price fluctuations in the foreign exchange markets, consider enlisting the services of a trusted broker like FXOpen.
CFDs are complex instruments and come with a high risk of losing your money.
This article represents the opinion of the Companies operating under the FXOpen brand only. It is not to be construed as an offer, solicitation, or recommendation with respect to products and services provided by the Companies operating under the FXOpen brand, nor is it to be considered financial advice.
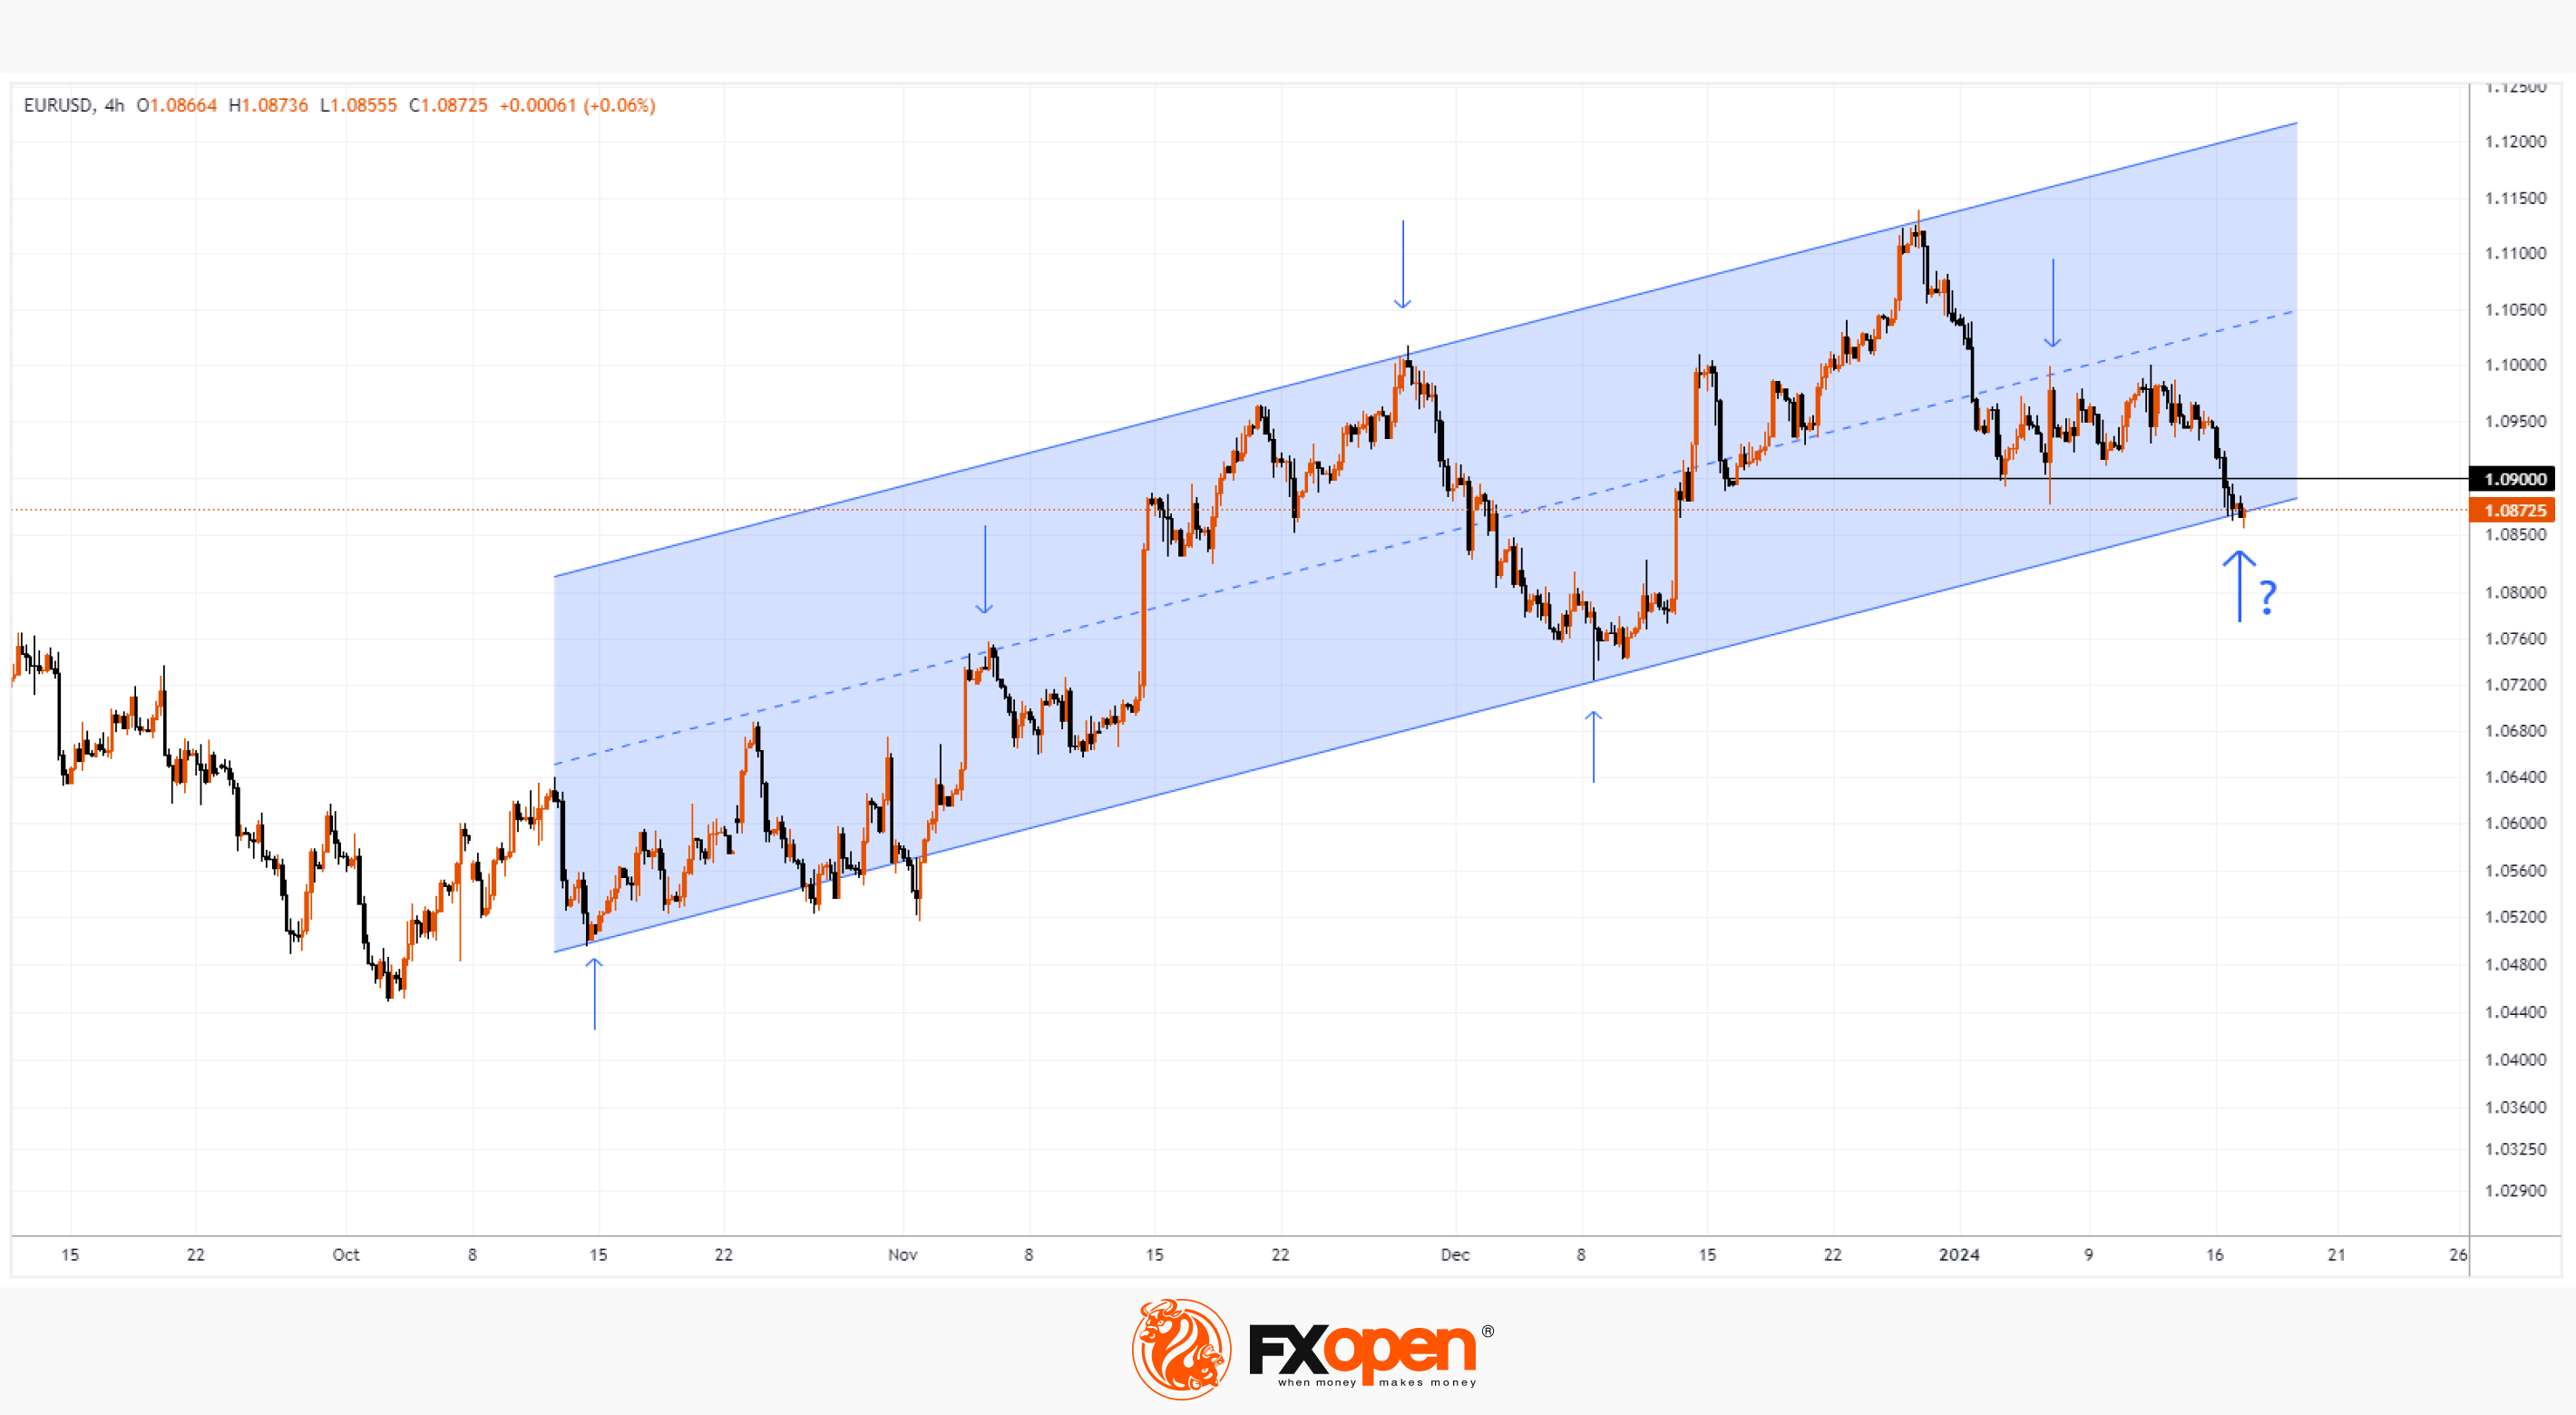
#marketanalysis #stockmarket #stocks
The UK100 price plummeted after the publication of inflation data
Yesterday, the stock market in the United Kingdom experienced a sharp decline following the release of new inflation data. The UK100 price, reflecting the leading British stock index FTSE, dropped approximately 1.5%. Moreover, the RSI indicator on the 4-hour chart fell below the value of 18 for the first time since July 2023.
Analysts attribute this decline to the published inflation data, which not only failed to meet economists' expectations but also indicated a possible strengthening of inflationary pressure in the country. CPI values: actual = 4.0%, expected = 3.8%, previous value = 3.9%.
This raised concerns among investors regarding the Bank of England's future steps in managing interest rates and the potential slowdown in the country's economic growth.
Sectors most sensitive to changes in interest rates, such as real estate and finance, showed the greatest decline. Significant decreases were also observed in the stocks of companies in the retail and consumer goods sectors, reflecting growing concerns about consumer confidence and spending.
The UK100 chart shows that:
→ the price dropped to the lower boundary of the channel, indicated in blue;
→ market weakness could be inferred from the inability of the UK100 price to stay above the September maximum in December, as well as price action around the 7665 level, which switched roles from support to resistance.
If new negative news emerges for the stock market, support from the lower boundary of the channel may be breached. In that case, it is not excluded that the UK100 stock index will decline to the level of 7300, which served as strong support throughout 2023.
Trade global indices with zero commission and tight spreads with FXOpen. Open your account now or learn more about trading index CFDs with FXOpen.
CFDs are complex instruments and come with a high risk of losing your money.
This article represents the opinion of the Companies operating under the FXOpen brand only. It is not to be construed as an offer, solicitation, or recommendation with respect to products and services provided by the Companies operating under the FXOpen brand, nor is it to be considered financial advice.
The UK100 price plummeted after the publication of inflation data
Yesterday, the stock market in the United Kingdom experienced a sharp decline following the release of new inflation data. The UK100 price, reflecting the leading British stock index FTSE, dropped approximately 1.5%. Moreover, the RSI indicator on the 4-hour chart fell below the value of 18 for the first time since July 2023.
Analysts attribute this decline to the published inflation data, which not only failed to meet economists' expectations but also indicated a possible strengthening of inflationary pressure in the country. CPI values: actual = 4.0%, expected = 3.8%, previous value = 3.9%.
This raised concerns among investors regarding the Bank of England's future steps in managing interest rates and the potential slowdown in the country's economic growth.
Sectors most sensitive to changes in interest rates, such as real estate and finance, showed the greatest decline. Significant decreases were also observed in the stocks of companies in the retail and consumer goods sectors, reflecting growing concerns about consumer confidence and spending.
The UK100 chart shows that:
→ the price dropped to the lower boundary of the channel, indicated in blue;
→ market weakness could be inferred from the inability of the UK100 price to stay above the September maximum in December, as well as price action around the 7665 level, which switched roles from support to resistance.
If new negative news emerges for the stock market, support from the lower boundary of the channel may be breached. In that case, it is not excluded that the UK100 stock index will decline to the level of 7300, which served as strong support throughout 2023.
Trade global indices with zero commission and tight spreads with FXOpen. Open your account now or learn more about trading index CFDs with FXOpen.
CFDs are complex instruments and come with a high risk of losing your money.
This article represents the opinion of the Companies operating under the FXOpen brand only. It is not to be construed as an offer, solicitation, or recommendation with respect to products and services provided by the Companies operating under the FXOpen brand, nor is it to be considered financial advice.