#marketanalysis #goldprice #XAUUSD
Market Analysis: Price of Gold Stabilises Near Its 5-month Highs
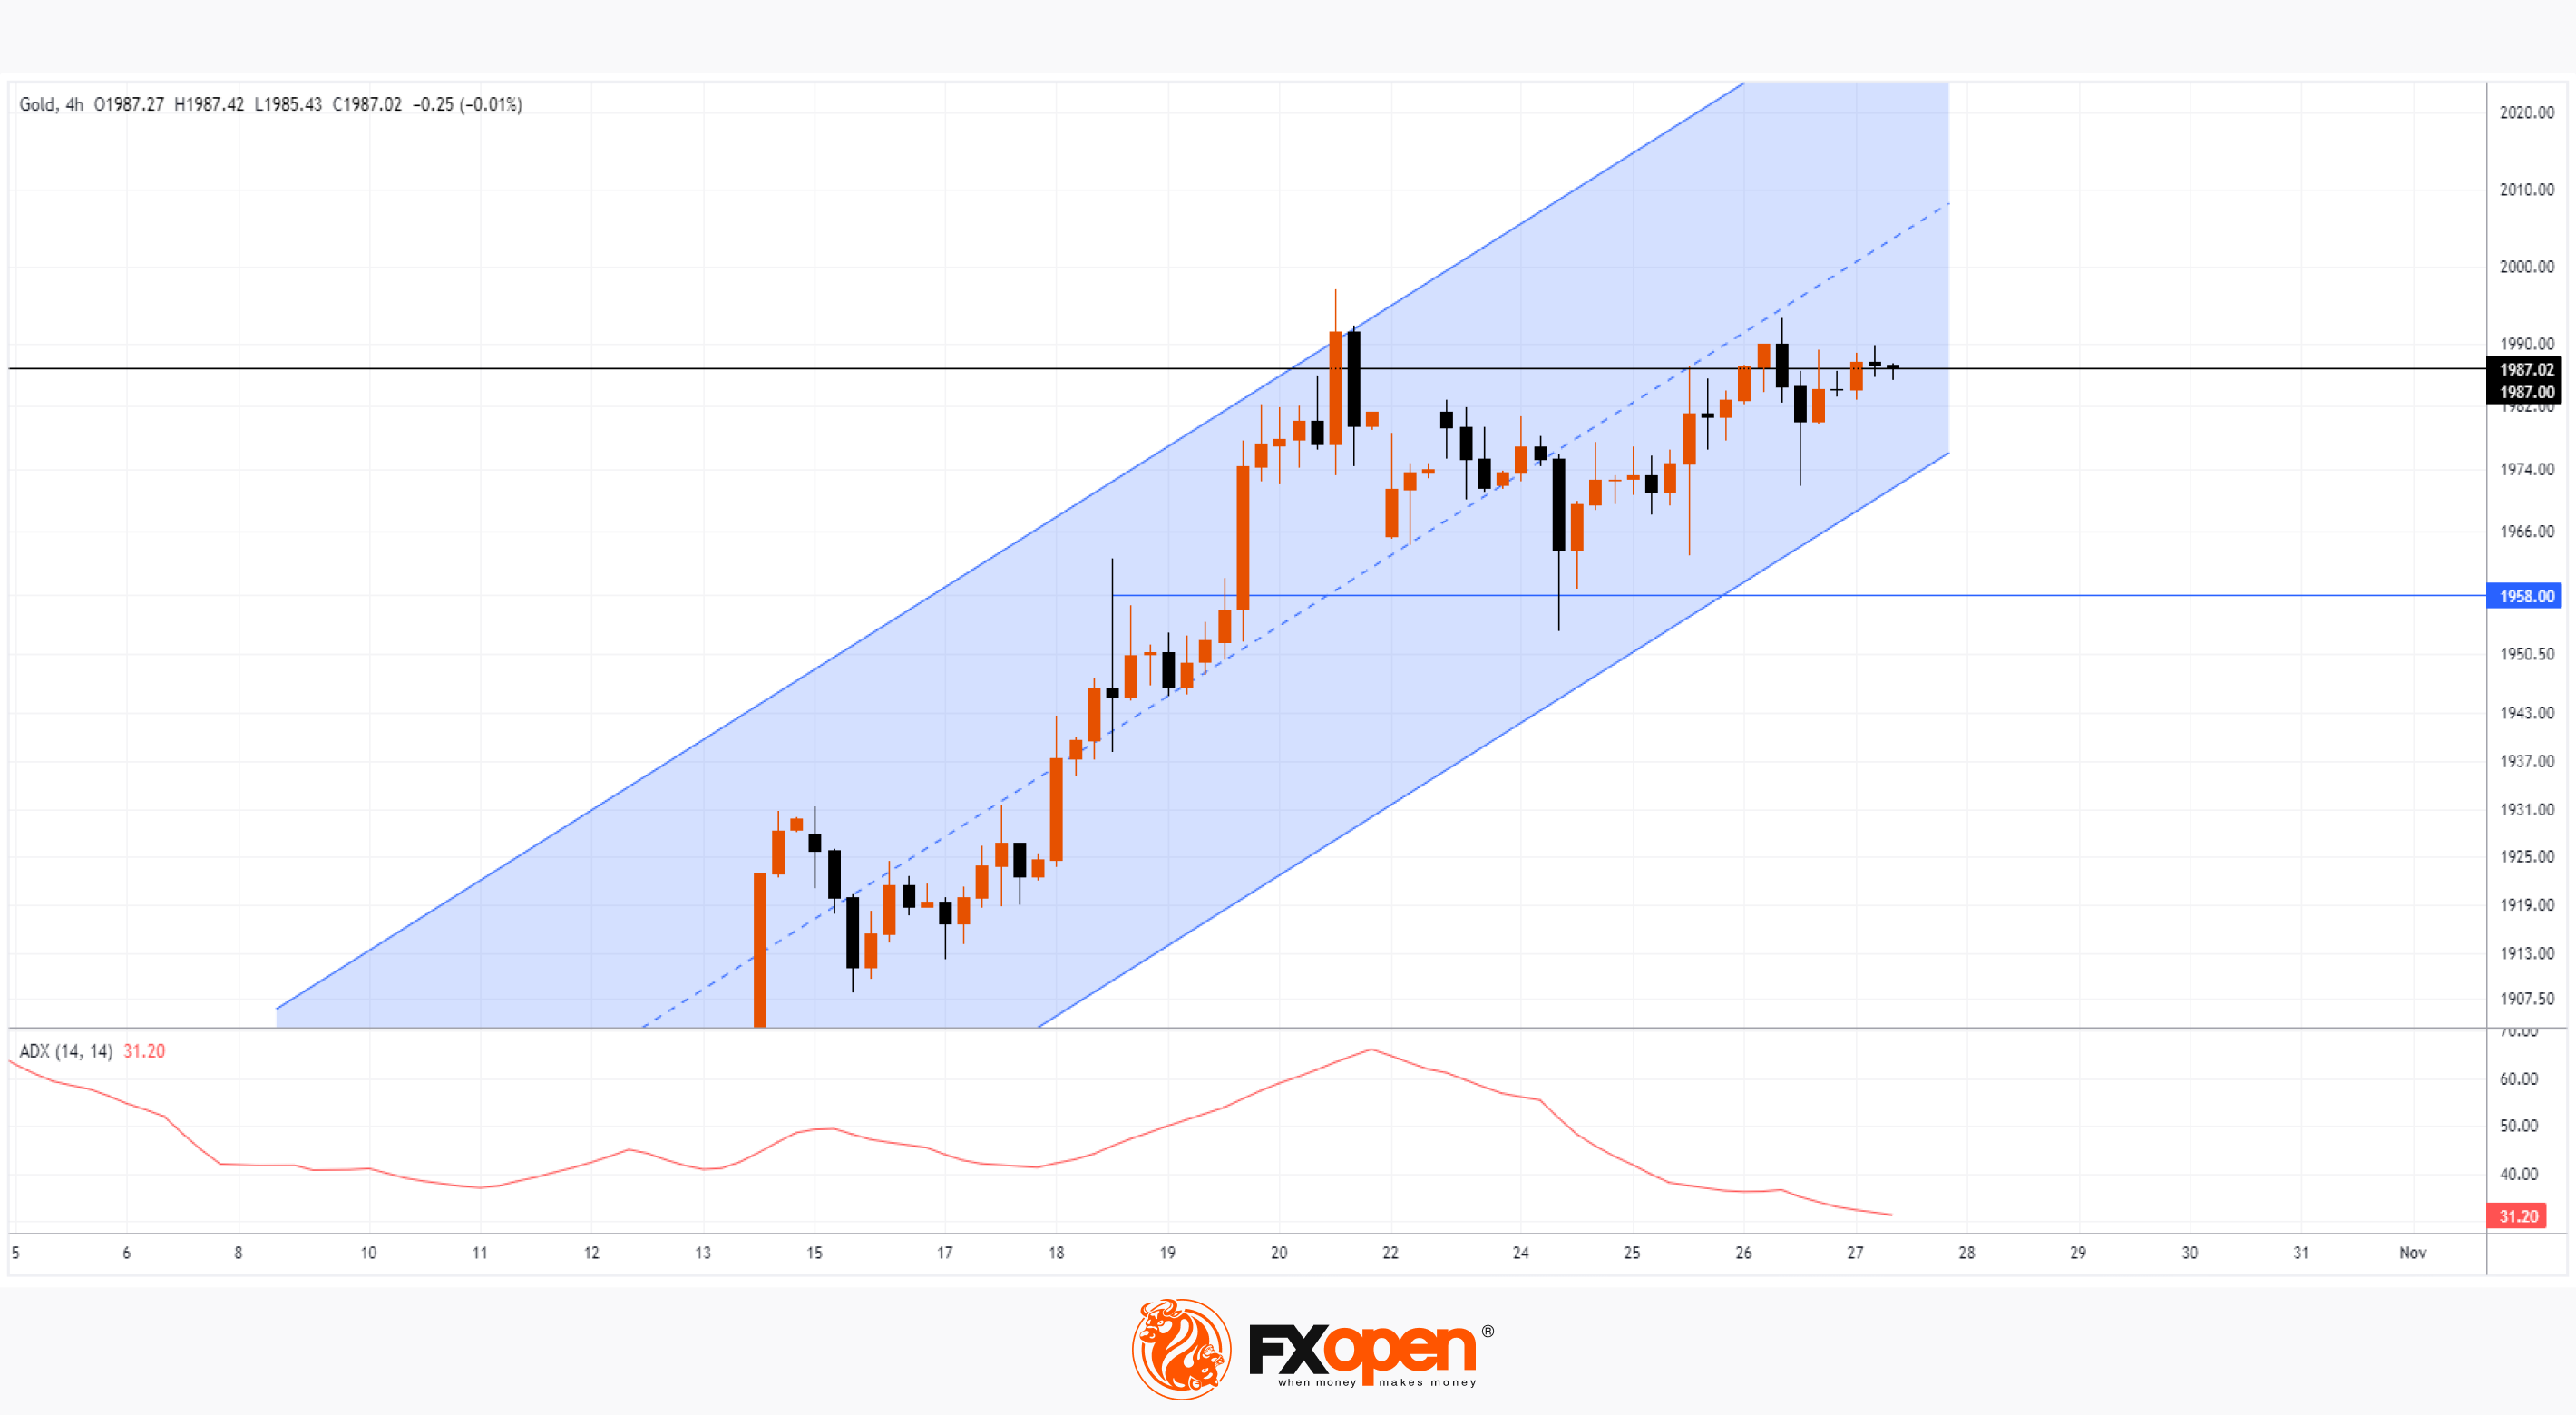
The XAU/USD rate fluctuates around $1,987 – the July high was formed around this price. And having overcome it, the market stabilized, as evidenced by the ADX indicator, which dropped to its minimum for the month.
Gold is up about 9% in three weeks on war fears. Moreover, if we take the year 2023, then gold has become a more profitable investment than the stock market, since according to Dow Jones Market Data, as of Thursday's close, the S&P 500 SPX index has gained 7.8% since January 1, at that time as front-month gold futures gained 9.2% over the same period.
On Friday, gold traders are focused on the release of US Core PCE Price Index values at 15:30 GMT+3. News about inflation could cause significant turbulence in the gold market.
The chart shows that the upside momentum within the ascending channel is fading around the USD 1,978 level as the price moves away from the upper boundary and the median line shows signs of resistance. Although the long lower shadows at the lows of October 24-26 indicate that gold is being actively bought up on declines.
Technical support for the market can be provided by:
→ lower border of the channel;
→ level 1,958, which previously served as resistance, but has now changed its role.
The current stabilization of prices can be explained by the proximity of the psychological level of USD 2,000. News of the escalation from the Middle East could push the price beyond a round figure.
To benefit from the rise and fall of gold prices, consider enlisting the services of a trusted broker like FXOpen.
CFDs are complex instruments and come with a high risk of losing your money.
This article represents the opinion of the Companies operating under the FXOpen brand only. It is not to be construed as an offer, solicitation, or recommendation with respect to products and services provided by the Companies operating under the FXOpen brand, nor is it to be considered financial advice.
Market Analysis: Price of Gold Stabilises Near Its 5-month Highs
The XAU/USD rate fluctuates around $1,987 – the July high was formed around this price. And having overcome it, the market stabilized, as evidenced by the ADX indicator, which dropped to its minimum for the month.
Gold is up about 9% in three weeks on war fears. Moreover, if we take the year 2023, then gold has become a more profitable investment than the stock market, since according to Dow Jones Market Data, as of Thursday's close, the S&P 500 SPX index has gained 7.8% since January 1, at that time as front-month gold futures gained 9.2% over the same period.
On Friday, gold traders are focused on the release of US Core PCE Price Index values at 15:30 GMT+3. News about inflation could cause significant turbulence in the gold market.
The chart shows that the upside momentum within the ascending channel is fading around the USD 1,978 level as the price moves away from the upper boundary and the median line shows signs of resistance. Although the long lower shadows at the lows of October 24-26 indicate that gold is being actively bought up on declines.
Technical support for the market can be provided by:
→ lower border of the channel;
→ level 1,958, which previously served as resistance, but has now changed its role.
The current stabilization of prices can be explained by the proximity of the psychological level of USD 2,000. News of the escalation from the Middle East could push the price beyond a round figure.
To benefit from the rise and fall of gold prices, consider enlisting the services of a trusted broker like FXOpen.
CFDs are complex instruments and come with a high risk of losing your money.
This article represents the opinion of the Companies operating under the FXOpen brand only. It is not to be construed as an offer, solicitation, or recommendation with respect to products and services provided by the Companies operating under the FXOpen brand, nor is it to be considered financial advice.
#NASDAQ #goldprices #stockmarket #GOOGL
Weekly Market Wrap With Gary Thomson: THE YEN WEAKENS, NASDAQ ENTERS CORRECTION, GOLD STABILISES, GOOGLE SHARES FALL
Get the latest scoop on the week's hottest headlines, all in one convenient video. Join Gary Thomson, the COO of FXOpen UK, as he breaks down the most significant news reports and shares his expert insights.
🔸 USD/JPY: New High of the Year
🔸 The NASDAQ Index Officially Enters Correction
🔸 Price of Gold Stabilises Near Its 5-month Highs
🔸Google report crashes stock price
Stay in the know and empower yourself with our short, yet power-packed video. Watch it now and stay updated with FXOpen.
Don't miss out on this invaluable opportunity to sharpen your trading skills and make informed decisions.
https://cutt.ly/swEbWELs
To take advantage of price fluctuations in the foreign exchange markets, consider enlisting the services of a reliable broker like FXOpen.
⚠️
This forecast represents FXOpen Companies opinion only, it should not be construed as an offer, invitation or recommendation in respect to FXOpen Companies products and services or as financial advice
Weekly Market Wrap With Gary Thomson: THE YEN WEAKENS, NASDAQ ENTERS CORRECTION, GOLD STABILISES, GOOGLE SHARES FALL
Get the latest scoop on the week's hottest headlines, all in one convenient video. Join Gary Thomson, the COO of FXOpen UK, as he breaks down the most significant news reports and shares his expert insights.
🔸 USD/JPY: New High of the Year
🔸 The NASDAQ Index Officially Enters Correction
🔸 Price of Gold Stabilises Near Its 5-month Highs
🔸Google report crashes stock price
Stay in the know and empower yourself with our short, yet power-packed video. Watch it now and stay updated with FXOpen.
Don't miss out on this invaluable opportunity to sharpen your trading skills and make informed decisions.
https://cutt.ly/swEbWELs
To take advantage of price fluctuations in the foreign exchange markets, consider enlisting the services of a reliable broker like FXOpen.
⚠️
This forecast represents FXOpen Companies opinion only, it should not be construed as an offer, invitation or recommendation in respect to FXOpen Companies products and services or as financial advice
YouTube
Weekly Market Wrap With Gary Thomson: THE YEN WEAKENS, NASDAQ ENTERS CORRECTION, GOLD STABILISES
Get the latest scoop on the week's hottest headlines, all in one convenient video. Join Gary Thomson, the COO of FXOpen UK, as he breaks down the most significant news reports and shares his expert insights.
- USD/JPY: New High of the Year #usdjpy
- The…
- USD/JPY: New High of the Year #usdjpy
- The…
#marketanalysis #oilprices #oilindustry
Market Analysis: Price of Oil in Tense Anticipation
Monday's opening came without any surprises. Despite the news that the Israeli army is moving to a new phase of the operation in Gaza, the price of Brent oil did not change much, trading started around the middle of the Friday candle.
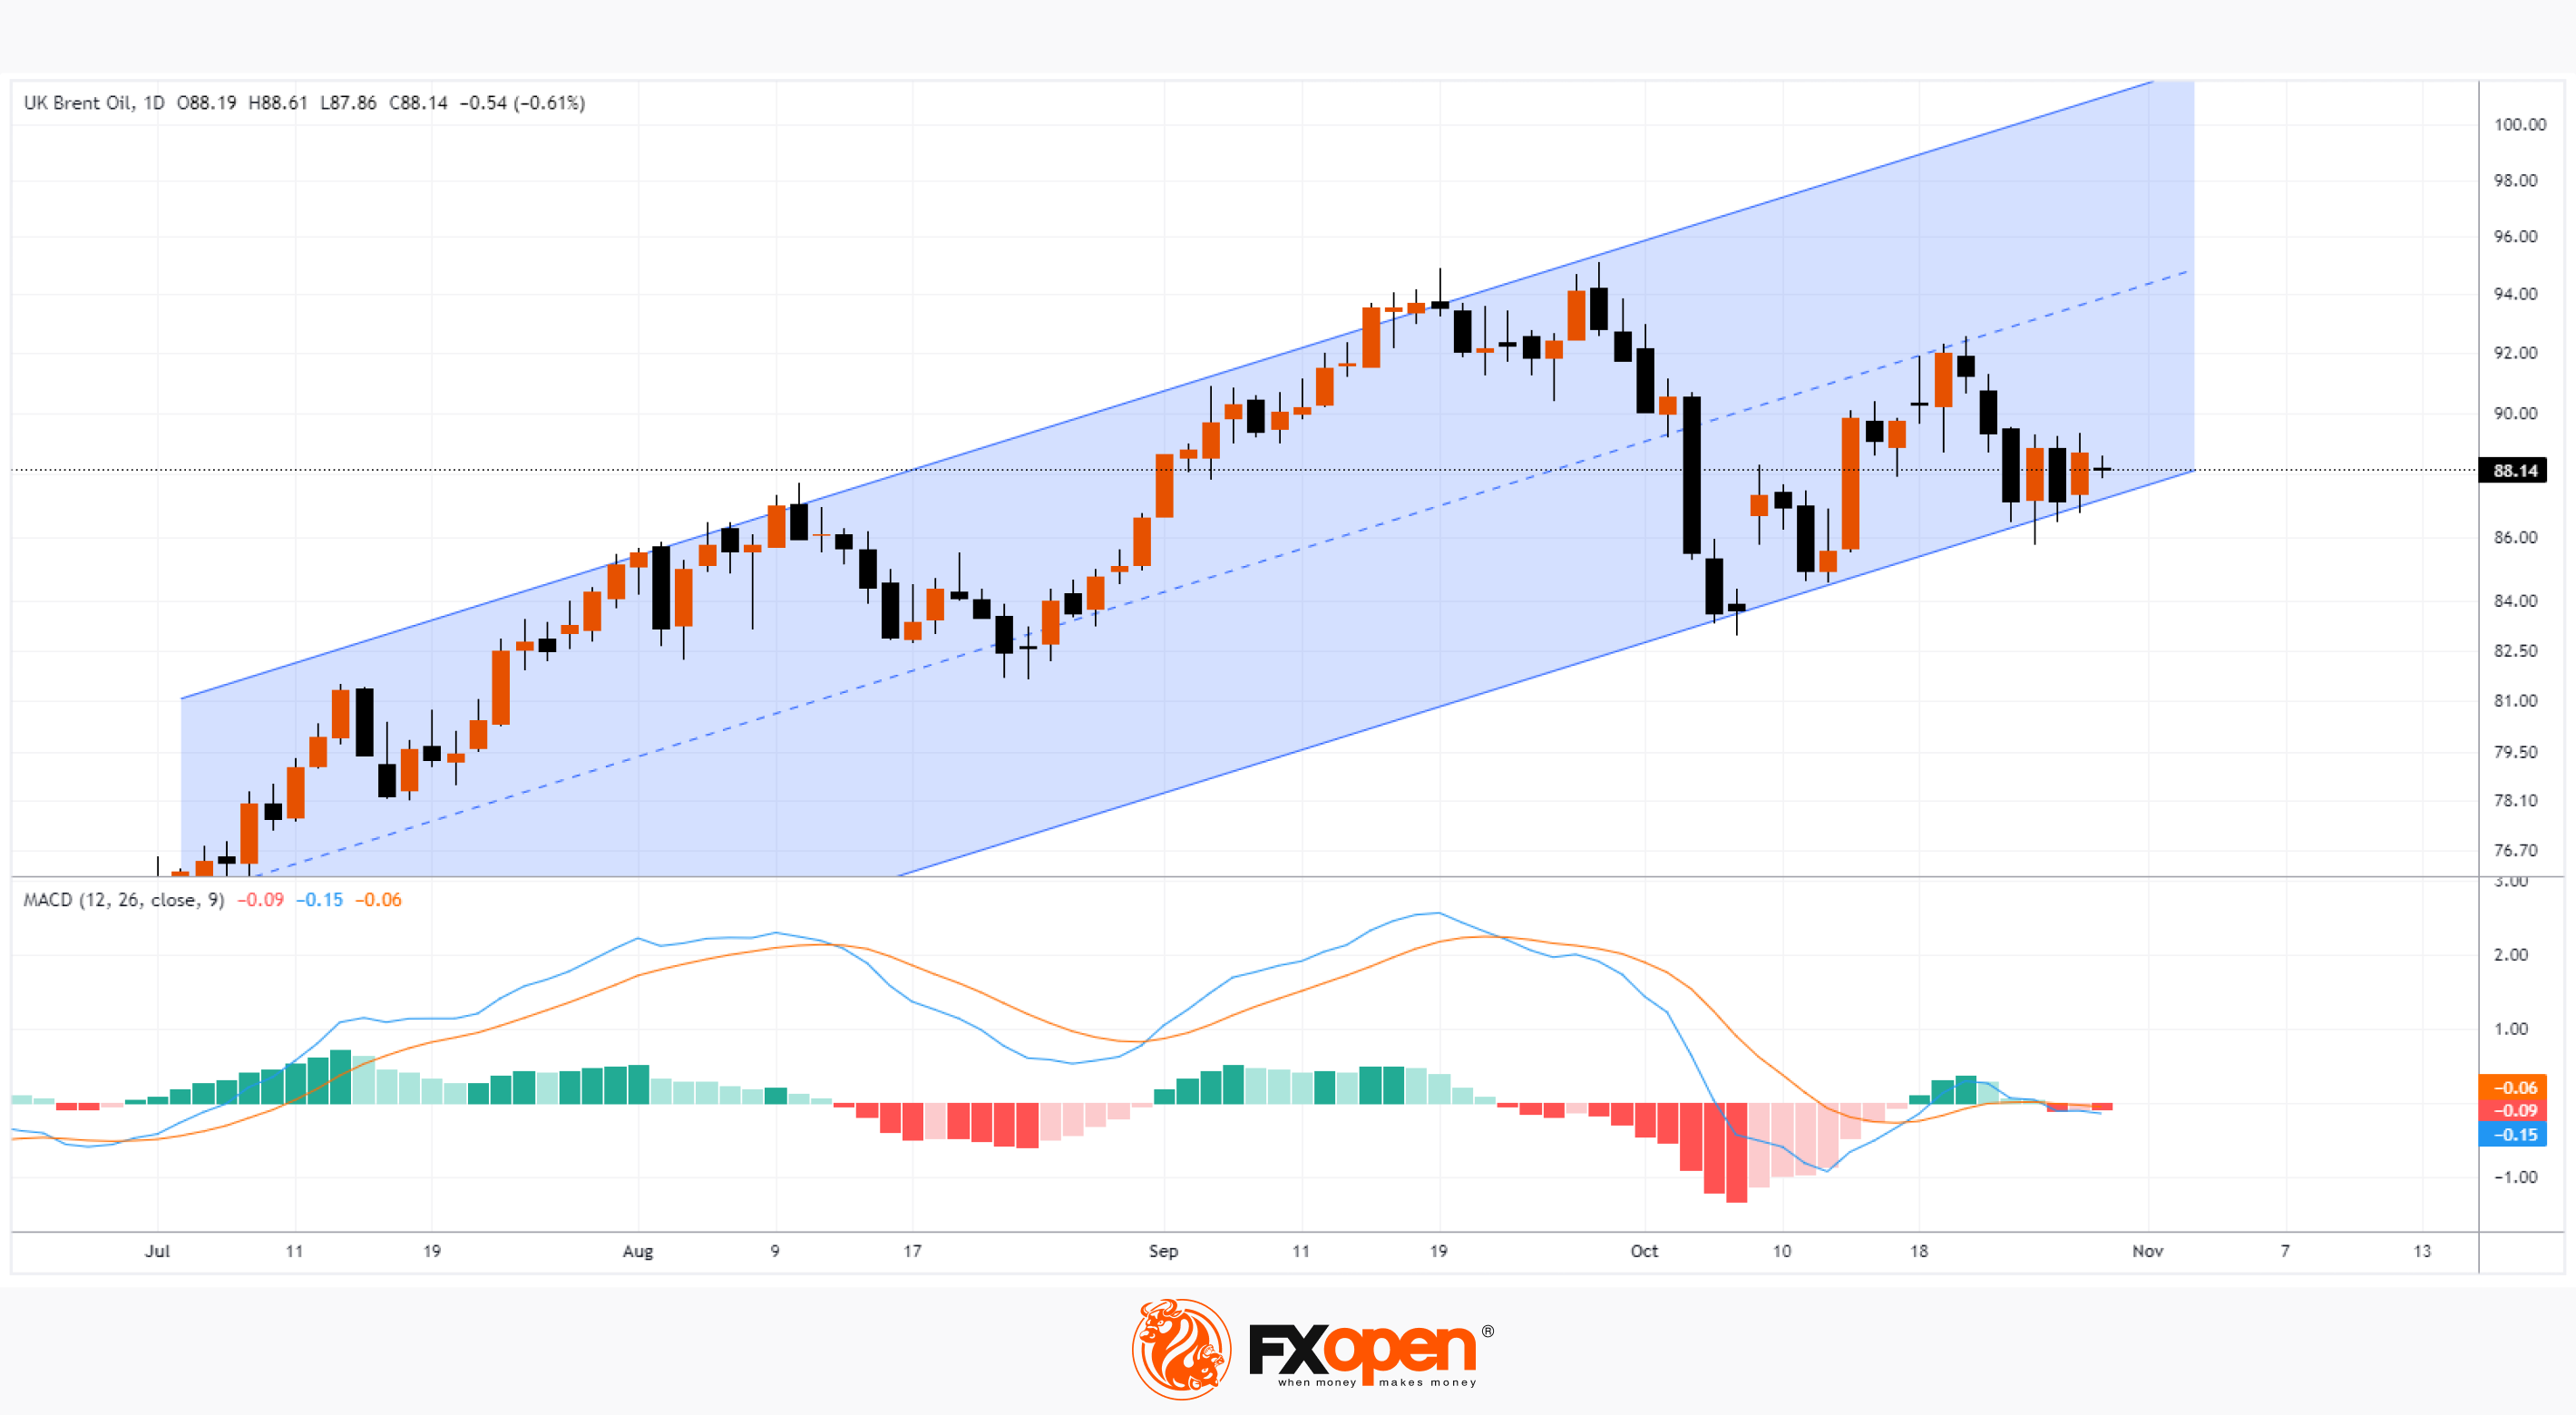
The chart shows that the price of Brent oil has fluctuated between USD 86.60 and USD 89.10 since October 24th. At the same time, the MACD indicator shrank near the zero line, which is typical for flat markets. However, it can hardly be said that bidders are calm.
On the one hand, they are closely monitoring news from the Middle East, where escalation could provoke supply disruptions and sharply increase the price of oil. On Sunday, US national security adviser Jake Sullivan said the US sees an increased risk of the conflict spreading to other parts of the Middle East region.
On the other hand, the Federal Reserve is expected to make a decision on interest rates this week. The event is scheduled for Wednesday evening, and it can greatly change the current balance of supply and demand.
The basis of the plan for the week can be the expectation of an impulse with the price leaving the specified range (similar to the inside bar strategy), which can develop into a new significant trend.
In this case, if the price goes out of the range:
→ in the upward direction will mean an attack by the bulls on the psychological level of USD 90;
→ in a downward direction will mean an attempt to break through an important ascending channel (shown in blue);
→ since the level of emotional stress is high, it can be assumed that the market is especially vulnerable to false movements.
To benefit from trends in the oil and gas markets, consider enlisting the services of a trusted broker like FXOpen.
CFDs are complex instruments and come with a high risk of losing your money.
This article represents the opinion of the Companies operating under the FXOpen brand only. It is not to be construed as an offer, solicitation, or recommendation with respect to products and services provided by the Companies operating under the FXOpen brand, nor is it to be considered financial advice.
Market Analysis: Price of Oil in Tense Anticipation
Monday's opening came without any surprises. Despite the news that the Israeli army is moving to a new phase of the operation in Gaza, the price of Brent oil did not change much, trading started around the middle of the Friday candle.
The chart shows that the price of Brent oil has fluctuated between USD 86.60 and USD 89.10 since October 24th. At the same time, the MACD indicator shrank near the zero line, which is typical for flat markets. However, it can hardly be said that bidders are calm.
On the one hand, they are closely monitoring news from the Middle East, where escalation could provoke supply disruptions and sharply increase the price of oil. On Sunday, US national security adviser Jake Sullivan said the US sees an increased risk of the conflict spreading to other parts of the Middle East region.
On the other hand, the Federal Reserve is expected to make a decision on interest rates this week. The event is scheduled for Wednesday evening, and it can greatly change the current balance of supply and demand.
The basis of the plan for the week can be the expectation of an impulse with the price leaving the specified range (similar to the inside bar strategy), which can develop into a new significant trend.
In this case, if the price goes out of the range:
→ in the upward direction will mean an attack by the bulls on the psychological level of USD 90;
→ in a downward direction will mean an attempt to break through an important ascending channel (shown in blue);
→ since the level of emotional stress is high, it can be assumed that the market is especially vulnerable to false movements.
To benefit from trends in the oil and gas markets, consider enlisting the services of a trusted broker like FXOpen.
CFDs are complex instruments and come with a high risk of losing your money.
This article represents the opinion of the Companies operating under the FXOpen brand only. It is not to be construed as an offer, solicitation, or recommendation with respect to products and services provided by the Companies operating under the FXOpen brand, nor is it to be considered financial advice.
👍1
#marketanalysis #tradingforex #USDJPY
USD/JPY Analysis: Playing with Fire Continues
Yesterday, the Nikkei newspaper reported that the Bank of Japan is considering adjusting its yield curve control (YCC) policy.
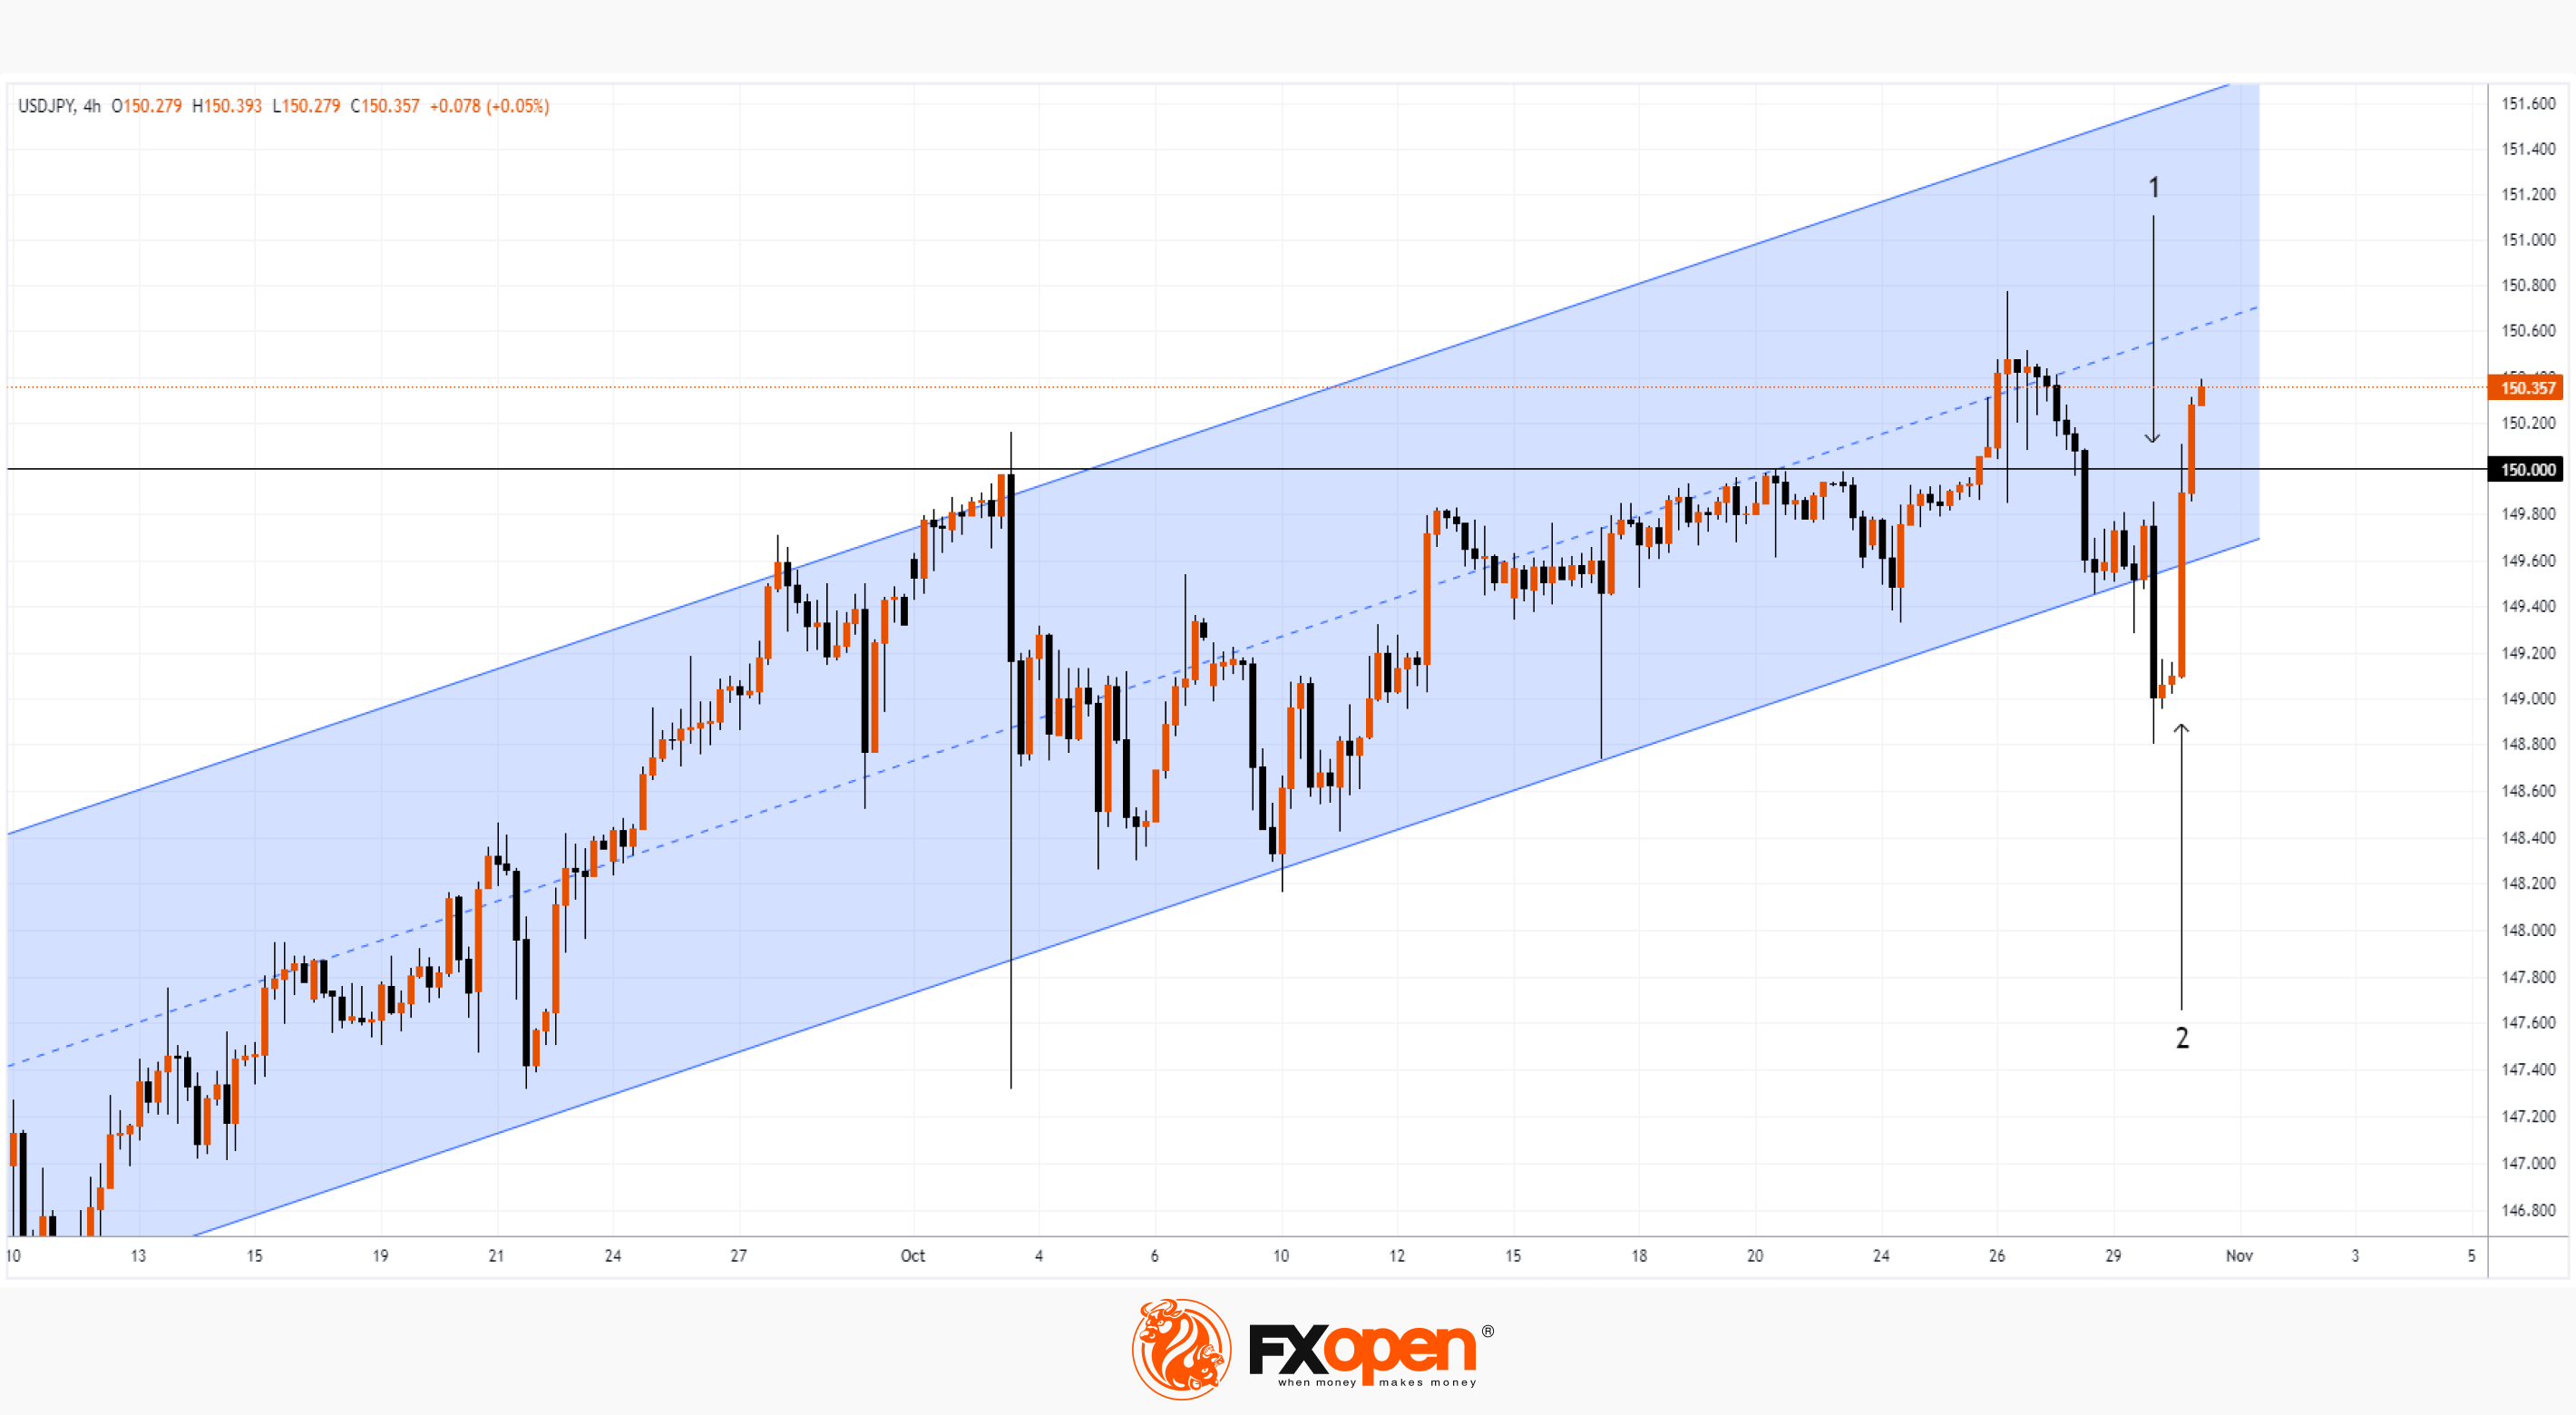
This provoked a strengthening of the yen (1). The USD/JPY rate dropped to a two-week extreme of 148.8 per US dollar in anticipation of news from the Bank of Japan.
The news followed this morning (2). The Bank of Japan kept interest rates at -0.1% and also said the 1% ceiling on the benchmark 10-year yield would be an upper bound rather than a hard limit.
As a result of the Bank's decision, the USD/JPY rate returned to the area above 150 yen per US dollar.
Wherein:
the price formed a false breakout of the ascending channel (shown in blue). The decline to the level of USD 149 formed a trap for the bears, who are forced to come out of losses today, thereby pushing USD/JPY even higher;
if the momentum continues, the price may reach the channel median line.
Thus, the upward trend may develop, the main danger for which will be (usually unexpected) statements by officials from the Ministry of Finance and/or the Bank of Japan, which could provoke sharp fluctuations like what has happened in recent days.
To benefit from trends in the foreign exchange markets, consider enlisting the services of a trusted broker like FXOpen.
CFDs are complex instruments and come with a high risk of losing your money.
This article represents the opinion of the Companies operating under the FXOpen brand only. It is not to be construed as an offer, solicitation, or recommendation with respect to products and services provided by the Companies operating under the FXOpen brand, nor is it to be considered financial advice.
USD/JPY Analysis: Playing with Fire Continues
Yesterday, the Nikkei newspaper reported that the Bank of Japan is considering adjusting its yield curve control (YCC) policy.
This provoked a strengthening of the yen (1). The USD/JPY rate dropped to a two-week extreme of 148.8 per US dollar in anticipation of news from the Bank of Japan.
The news followed this morning (2). The Bank of Japan kept interest rates at -0.1% and also said the 1% ceiling on the benchmark 10-year yield would be an upper bound rather than a hard limit.
As a result of the Bank's decision, the USD/JPY rate returned to the area above 150 yen per US dollar.
Wherein:
the price formed a false breakout of the ascending channel (shown in blue). The decline to the level of USD 149 formed a trap for the bears, who are forced to come out of losses today, thereby pushing USD/JPY even higher;
if the momentum continues, the price may reach the channel median line.
Thus, the upward trend may develop, the main danger for which will be (usually unexpected) statements by officials from the Ministry of Finance and/or the Bank of Japan, which could provoke sharp fluctuations like what has happened in recent days.
To benefit from trends in the foreign exchange markets, consider enlisting the services of a trusted broker like FXOpen.
CFDs are complex instruments and come with a high risk of losing your money.
This article represents the opinion of the Companies operating under the FXOpen brand only. It is not to be construed as an offer, solicitation, or recommendation with respect to products and services provided by the Companies operating under the FXOpen brand, nor is it to be considered financial advice.
#marketanalysis #stockmarket #NASDAQ
Market Analysis: AMZN Pulls NASDAQ Up, Expecting Help from AAPL
Amazon's quarterly report provided a ray of light in a gloomy environment for the tech-heavy US stock market, as the NASDAQ index fell last week to levels last seen in May.
→ AMZN EPS: actual = USD 0.94, expected = USD 0.58
→ Gross revenue: actual = $143.5 billion, expected = $141 billion
→ For the Q4, AMZN expects revenue of USD 160-167 billion
→ Revenue from Amazon Web Services grew by 12.3% year on year
→ Advertising revenue increased by 26%
However, the AMZN chart shows that:
→ the price pushed off from the lower border of the parallel channel;
→ the breakdown of the psychological level of USD 120 per share turned into a trap for the bears;
→ the price is approaching the resistance zone, which is formed by the median line of the channel and the level of USD 135.
AMZN is acting as a leader among NASDAQ stocks, but that may not be enough for the index to show positive sentiment in a market under pressure from high Fed rates.
While a report from AAPL could add some good news, it is expected on November 2, after the market closes. On the eve of the report, Apple (AAPL) presented new 3-nanometer M3 chips, as well as an updated family of MacBook Pro laptops: a 14-inch MacBook Pro for USD 1,599, and 16-inch laptops will start at USD 2,499.
Also on the radar for stock traders is the Fed meeting on November 1st.
To benefit from stock market fluctuations, consider enlisting the services of a trusted broker like FXOpen.
CFDs are complex instruments and come with a high risk of losing your money.
This article represents the opinion of the Companies operating under the FXOpen brand only. It is not to be construed as an offer, solicitation, or recommendation with respect to products and services provided by the Companies operating under the FXOpen brand, nor is it to be considered financial advice.
Market Analysis: AMZN Pulls NASDAQ Up, Expecting Help from AAPL
Amazon's quarterly report provided a ray of light in a gloomy environment for the tech-heavy US stock market, as the NASDAQ index fell last week to levels last seen in May.
→ AMZN EPS: actual = USD 0.94, expected = USD 0.58
→ Gross revenue: actual = $143.5 billion, expected = $141 billion
→ For the Q4, AMZN expects revenue of USD 160-167 billion
→ Revenue from Amazon Web Services grew by 12.3% year on year
→ Advertising revenue increased by 26%
However, the AMZN chart shows that:
→ the price pushed off from the lower border of the parallel channel;
→ the breakdown of the psychological level of USD 120 per share turned into a trap for the bears;
→ the price is approaching the resistance zone, which is formed by the median line of the channel and the level of USD 135.
AMZN is acting as a leader among NASDAQ stocks, but that may not be enough for the index to show positive sentiment in a market under pressure from high Fed rates.
While a report from AAPL could add some good news, it is expected on November 2, after the market closes. On the eve of the report, Apple (AAPL) presented new 3-nanometer M3 chips, as well as an updated family of MacBook Pro laptops: a 14-inch MacBook Pro for USD 1,599, and 16-inch laptops will start at USD 2,499.
Also on the radar for stock traders is the Fed meeting on November 1st.
To benefit from stock market fluctuations, consider enlisting the services of a trusted broker like FXOpen.
CFDs are complex instruments and come with a high risk of losing your money.
This article represents the opinion of the Companies operating under the FXOpen brand only. It is not to be construed as an offer, solicitation, or recommendation with respect to products and services provided by the Companies operating under the FXOpen brand, nor is it to be considered financial advice.

#marketanalysis #tradingforex #tradingtips
USD/CAD Analysis: New High of the Year
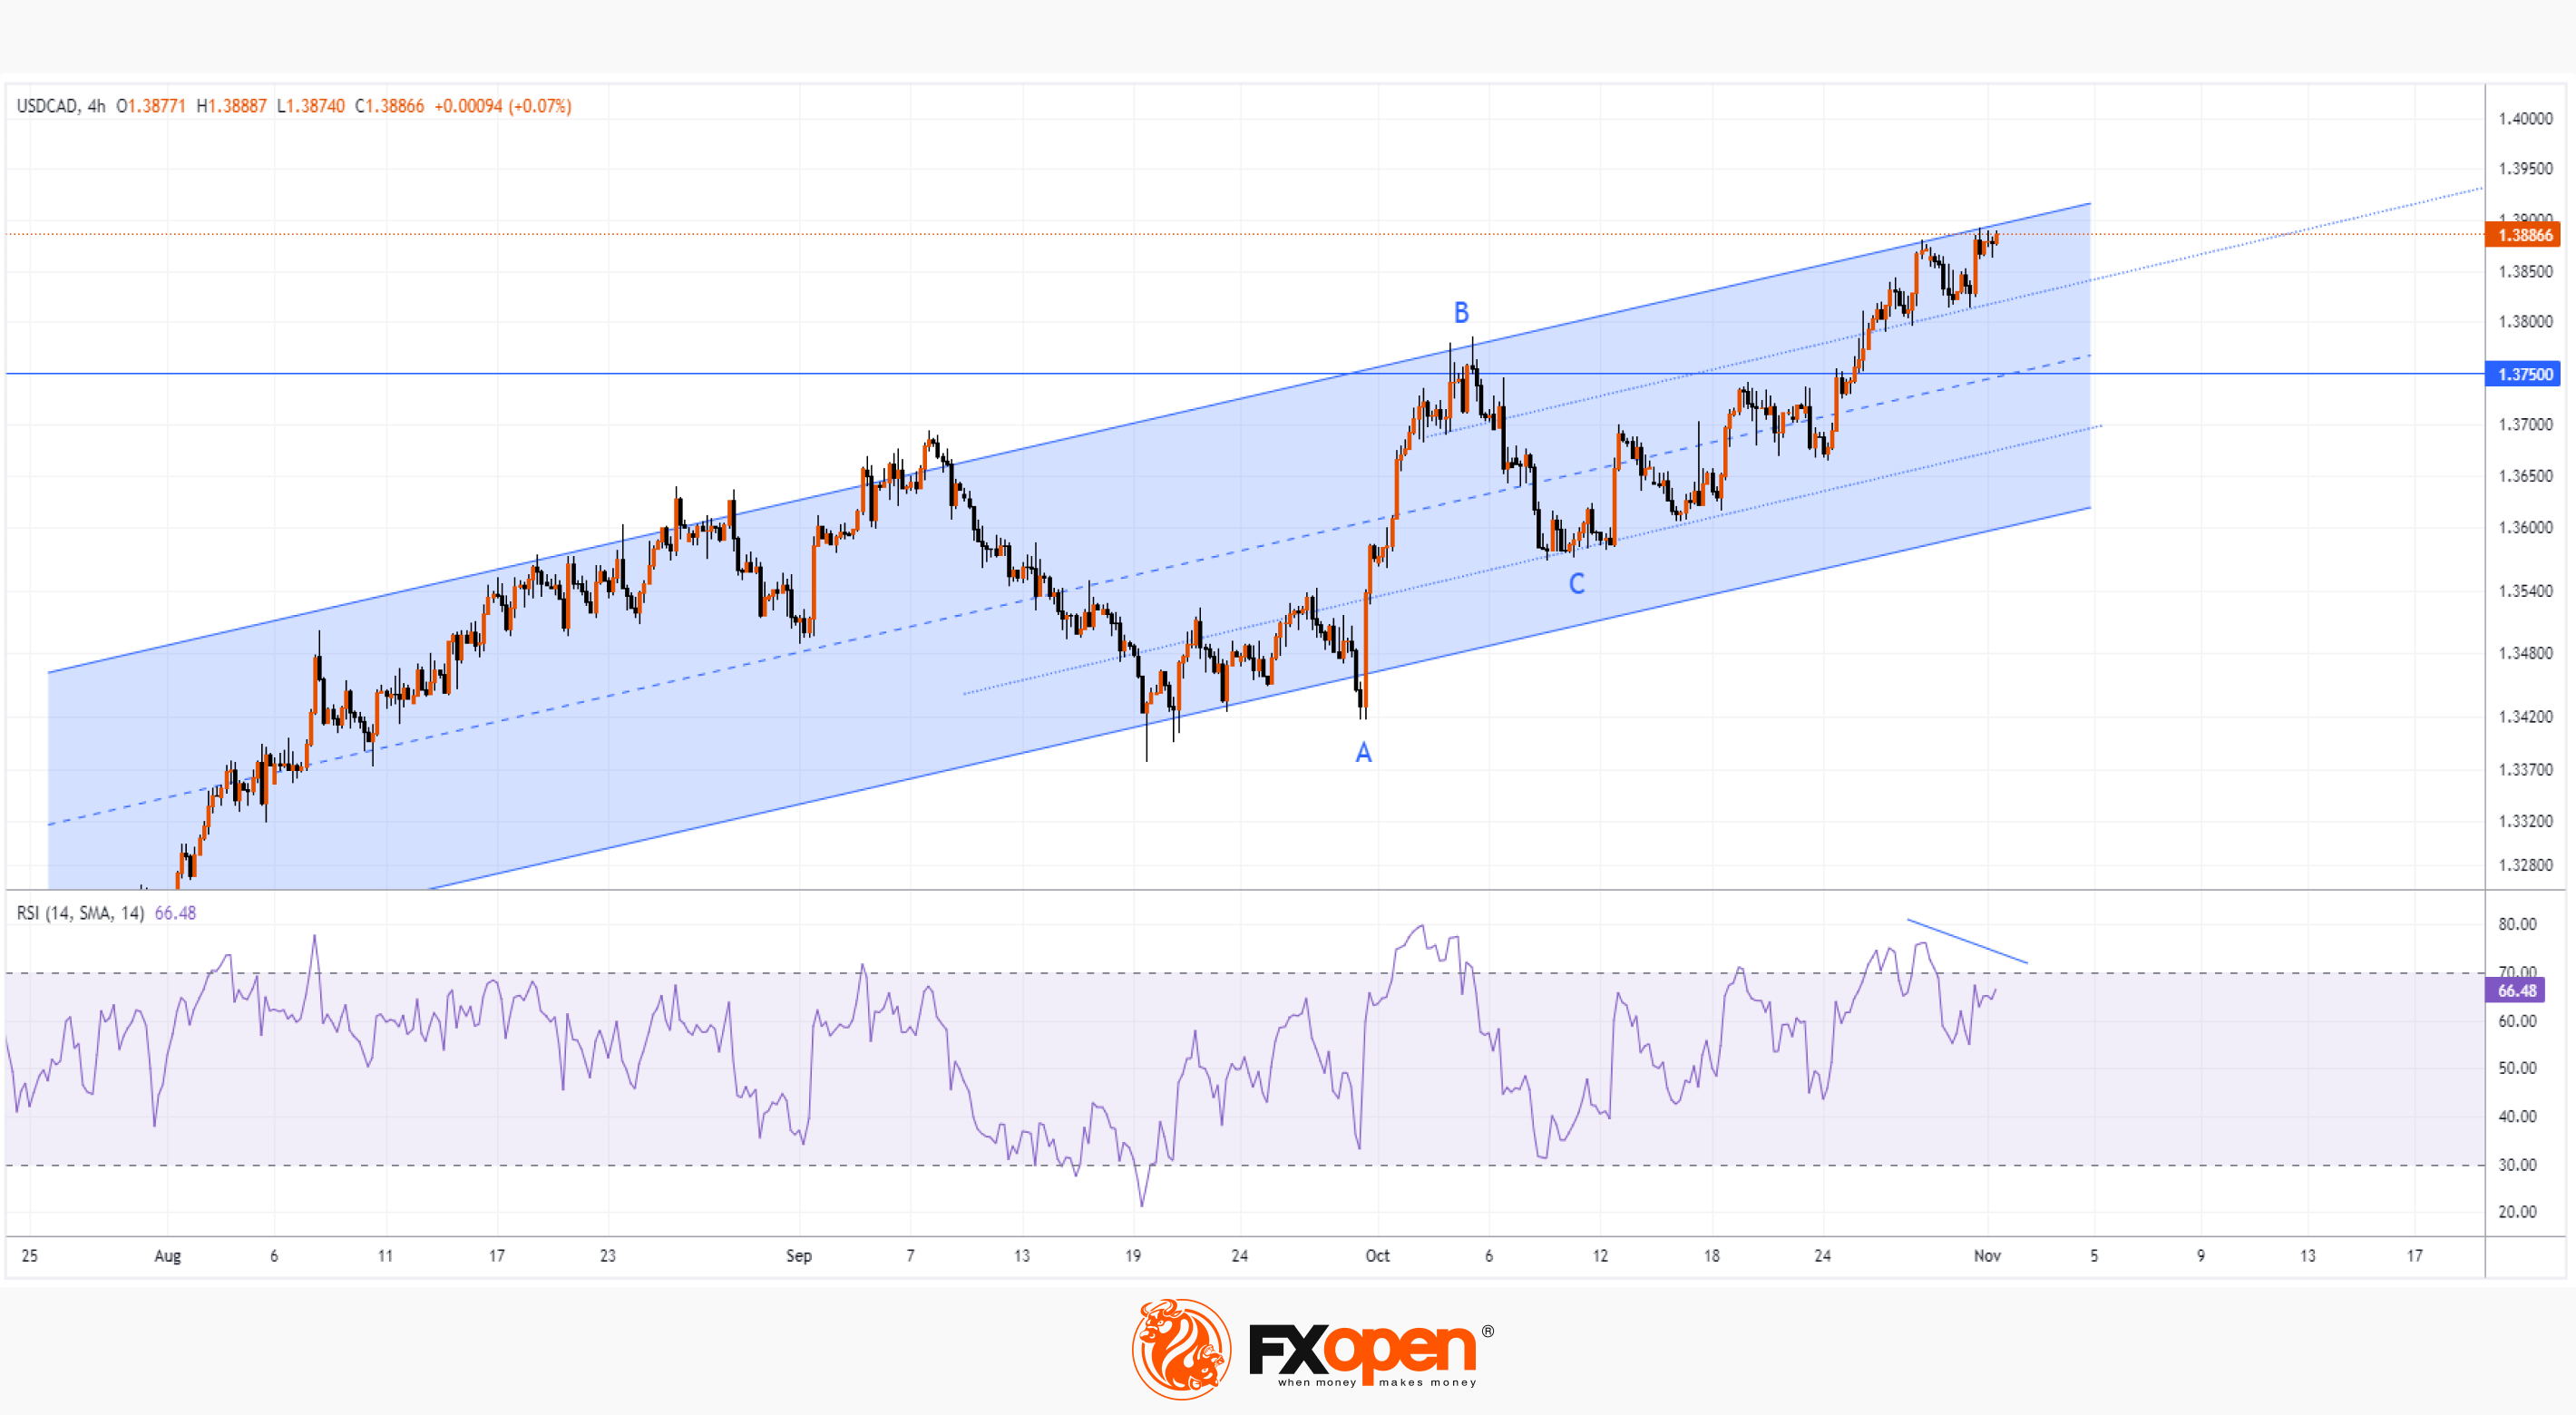
As the chart shows, yesterday, the USD/CAD rate exceeded 1.389 for the first time in 2023. This happened against the backdrop of news regarding the economies of the USA and Canada:
→ Statistics Canada estimates that GDP contracted in the third quarter. Technically, it can be stated that the Canadian economy has entered a technical recession, as this is the second consecutive negative change in GDP for the quarter.
→ The US Employment Cost Index rose 1.1% in the third quarter after rising 1.0% in the second quarter, the Labour Department reported Tuesday. This is a sign of a strong labour market, but at the same time, it indicates the preconditions for rising inflation, since the costs to the employer may fall on the consumer.
How the Fed assesses inflation will become known today at 21:30 GMT+3 from Powell’s speech. Also, volatility in the USD/CAD market may increase the speech of Bank of Canada Governor Tiff Macklem at 23:15 GMT+3.
The chart shows that the USD/CAD rate is in an upward trend because:
→ exchange rate dynamics develop within the channel shown in blue — the strength of the USD relative to the CAD suggests that the US economy is in a stronger state than the Canadian one;
→ the magnitude of the B-C rollback is about 50% of the growth progress of A-B.
Since the USD/CAD price is near the upper boundary of the channel, this means that the market is vulnerable to a pullback. This probability is also indicated by potential price divergence with the RSI indicator.
If a rollback occurs, it may be shallow, for example, to the support zone formed by the median line of the blue channel and the level of 1.375, which previously served as an important resistance.
Be prepared for a spike in volatility tonight.
To benefit from currency fluctuations, consider enlisting the services of a trusted broker like FXOpen.
CFDs are complex instruments and come with a high risk of losing your money.
This article represents the opinion of the Companies operating under the FXOpen brand only. It is not to be construed as an offer, solicitation, or recommendation with respect to products and services provided by the Companies operating under the FXOpen brand, nor is it to be considered financial advice.
USD/CAD Analysis: New High of the Year
As the chart shows, yesterday, the USD/CAD rate exceeded 1.389 for the first time in 2023. This happened against the backdrop of news regarding the economies of the USA and Canada:
→ Statistics Canada estimates that GDP contracted in the third quarter. Technically, it can be stated that the Canadian economy has entered a technical recession, as this is the second consecutive negative change in GDP for the quarter.
→ The US Employment Cost Index rose 1.1% in the third quarter after rising 1.0% in the second quarter, the Labour Department reported Tuesday. This is a sign of a strong labour market, but at the same time, it indicates the preconditions for rising inflation, since the costs to the employer may fall on the consumer.
How the Fed assesses inflation will become known today at 21:30 GMT+3 from Powell’s speech. Also, volatility in the USD/CAD market may increase the speech of Bank of Canada Governor Tiff Macklem at 23:15 GMT+3.
The chart shows that the USD/CAD rate is in an upward trend because:
→ exchange rate dynamics develop within the channel shown in blue — the strength of the USD relative to the CAD suggests that the US economy is in a stronger state than the Canadian one;
→ the magnitude of the B-C rollback is about 50% of the growth progress of A-B.
Since the USD/CAD price is near the upper boundary of the channel, this means that the market is vulnerable to a pullback. This probability is also indicated by potential price divergence with the RSI indicator.
If a rollback occurs, it may be shallow, for example, to the support zone formed by the median line of the blue channel and the level of 1.375, which previously served as an important resistance.
Be prepared for a spike in volatility tonight.
To benefit from currency fluctuations, consider enlisting the services of a trusted broker like FXOpen.
CFDs are complex instruments and come with a high risk of losing your money.
This article represents the opinion of the Companies operating under the FXOpen brand only. It is not to be construed as an offer, solicitation, or recommendation with respect to products and services provided by the Companies operating under the FXOpen brand, nor is it to be considered financial advice.
#sp500 #marketanalysis #stocktrading
S&P 500 Analysis: Powell Adds Bullish Momentum
As expected, the Fed left the rate unchanged. Market participants' attention was focused on Powell's press conference, as he said:
→ Risks have now become almost balanced;
→ Inflation expectations are at a good level.
The media publishes the opinions of experts who generally agree that although Jerome Powell has not ruled out the possibility of another rate increase, he does not seem to be very supportive of this idea. So the Fed is not as aggressive as it could be.
As a result, the probability of a rate hike in December has dropped to 20%, and the probability that the rate hike cycle has ended is at 70%.
The S&P 500 stock index reacted positively – the price rose at the end of trading. However, how long will the bullish momentum based on Powell's words last?
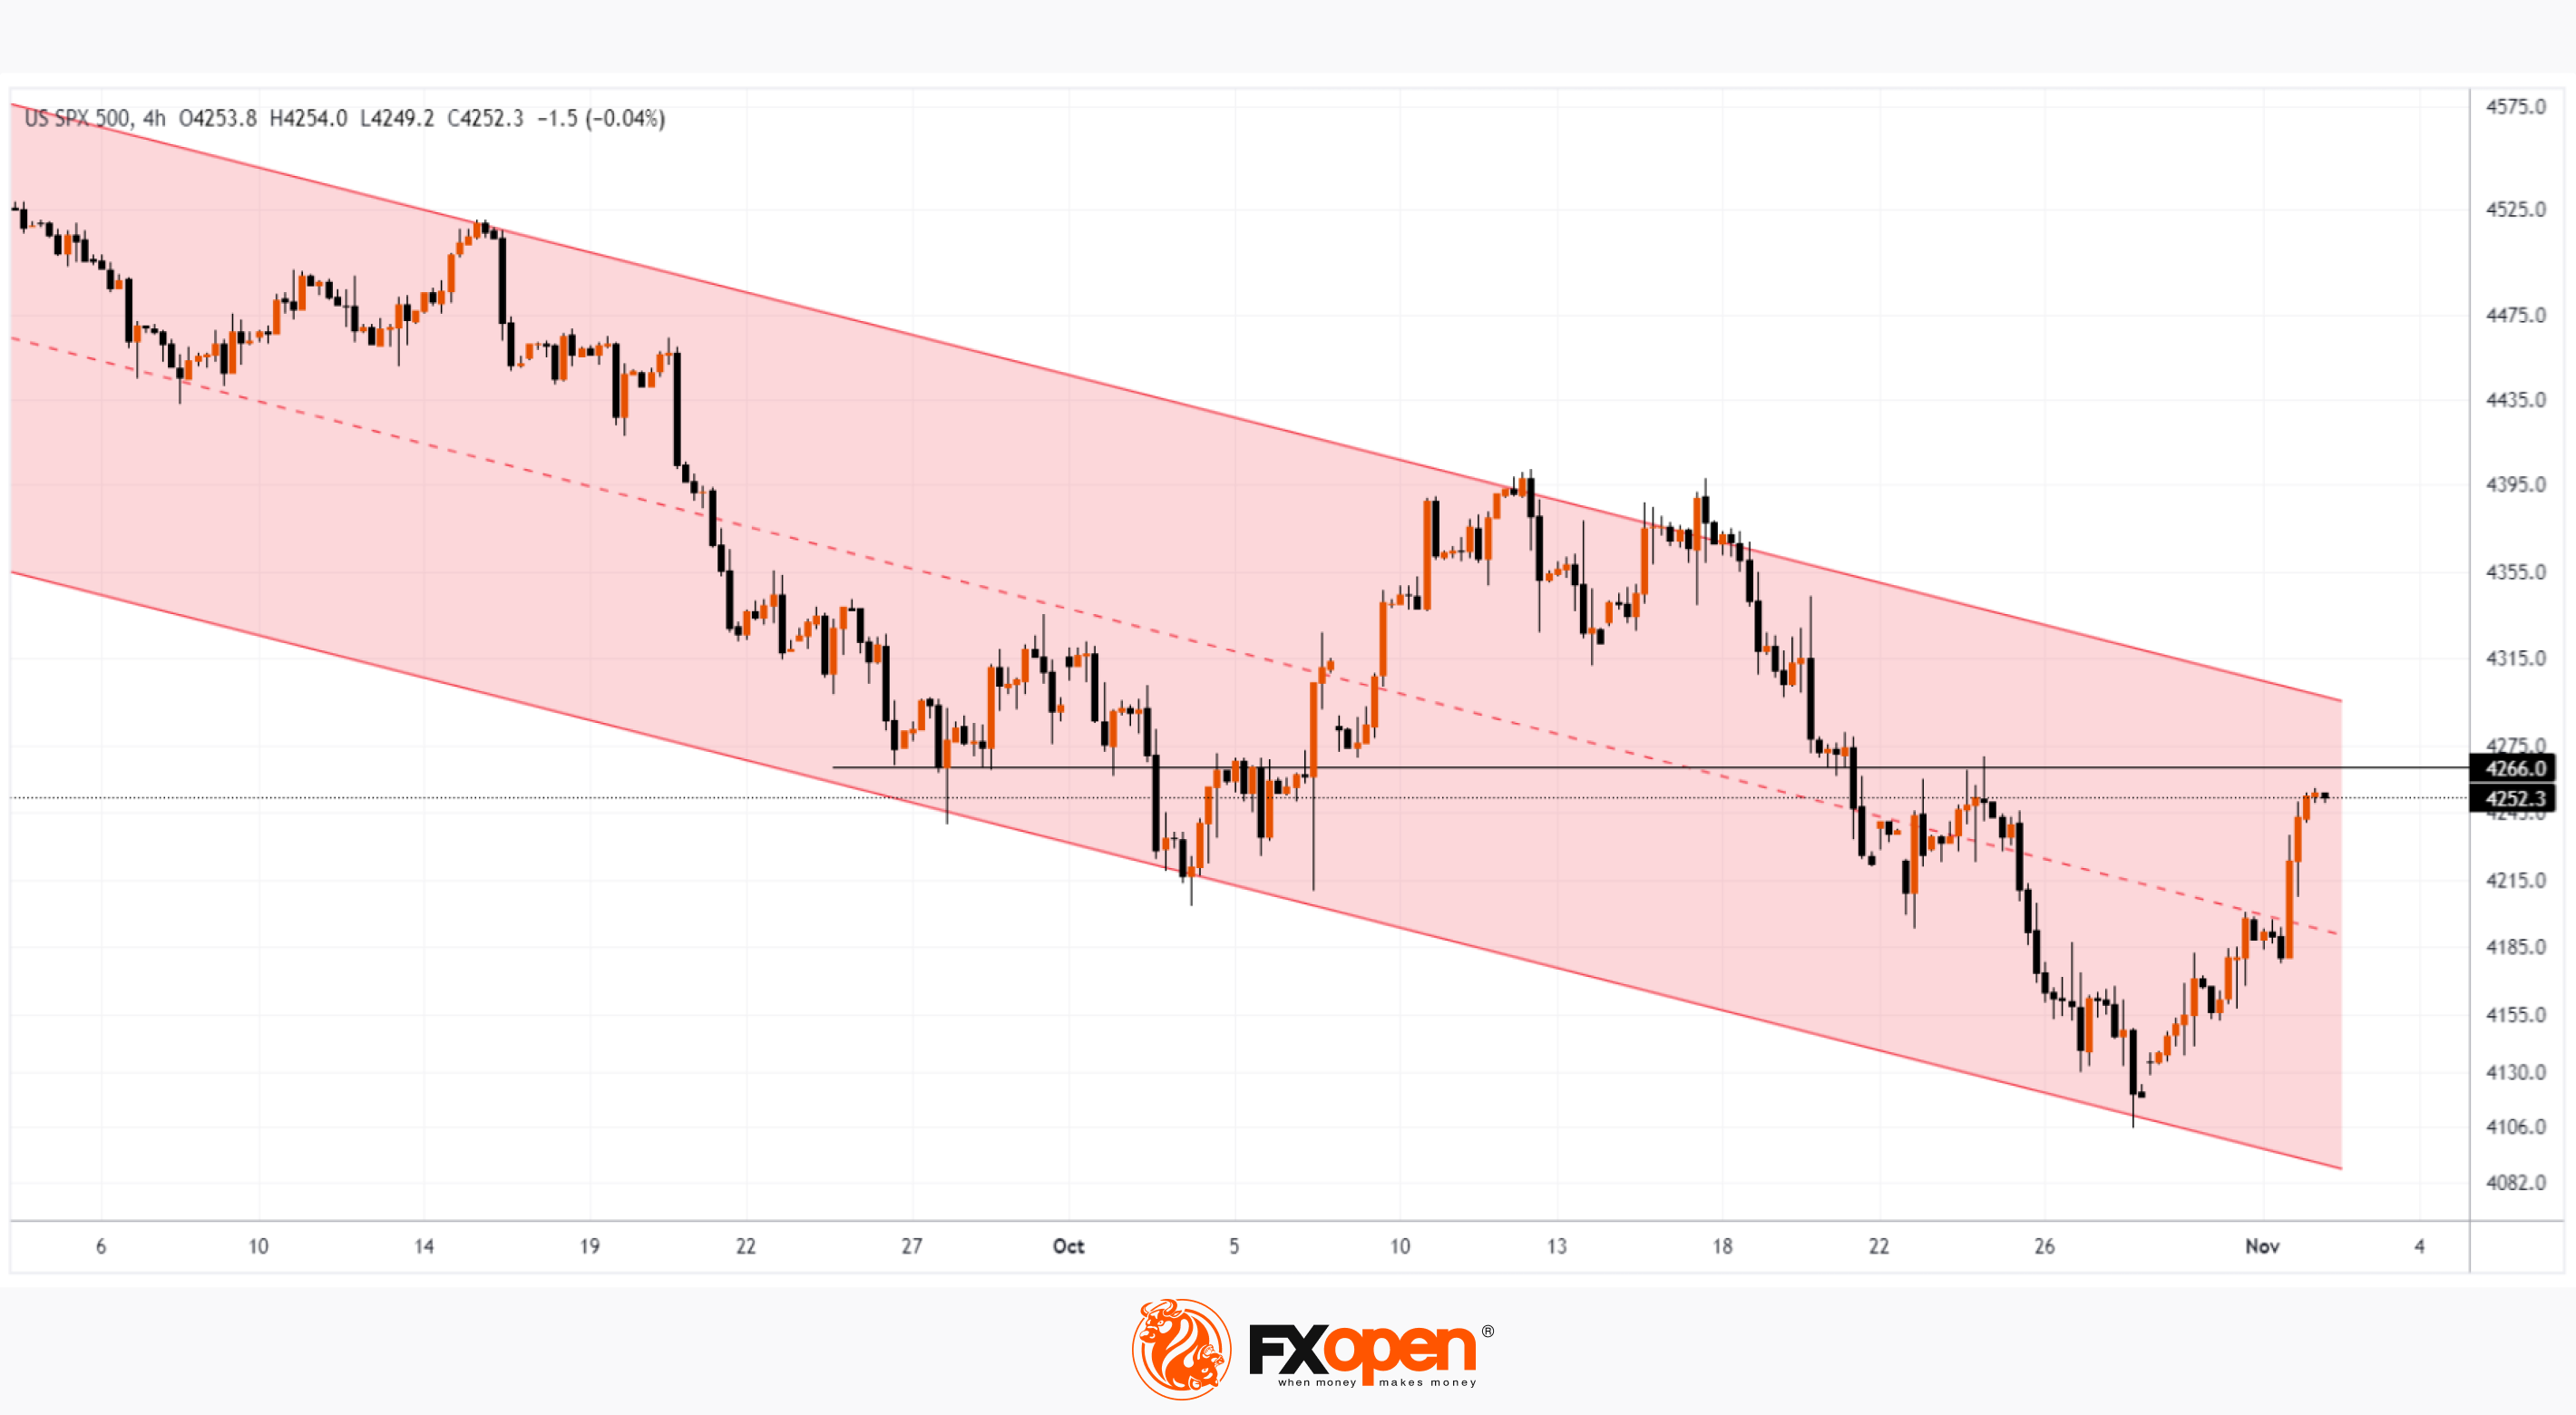
The graph shows that:
→ the price of the S&P 500 is still in a downward trend, judging by the channel (shown in red), and the upper limit of the channel, where we should expect the bears to intensify their efforts, is already close;
→ the price has risen to the important technical level 4,266, which has repeatedly affected it — perhaps now it will provide resistance;
→ tapering bullish candles late yesterday indicate that buyer activity may be drying up.
Today, as we note, a report on the activities of Apple, the largest company by capitalization, will be released. If it turns out to be worse than expected (for example, due to the dynamics of sales of the 15th iPhone), then the positivity from Powell’s words can be significantly (if not completely) won back by the bears.
To benefit from the rise and fall of stock market indices, consider enlisting the services of a trusted broker like FXOpen.
CFDs are complex instruments and come with a high risk of losing your money.
This article represents the opinion of the Companies operating under the FXOpen brand only. It is not to be construed as an offer, solicitation, or recommendation with respect to products and services provided by the Companies operating under the FXOpen brand, nor is it to be considered financial advice.
S&P 500 Analysis: Powell Adds Bullish Momentum
As expected, the Fed left the rate unchanged. Market participants' attention was focused on Powell's press conference, as he said:
→ Risks have now become almost balanced;
→ Inflation expectations are at a good level.
The media publishes the opinions of experts who generally agree that although Jerome Powell has not ruled out the possibility of another rate increase, he does not seem to be very supportive of this idea. So the Fed is not as aggressive as it could be.
As a result, the probability of a rate hike in December has dropped to 20%, and the probability that the rate hike cycle has ended is at 70%.
The S&P 500 stock index reacted positively – the price rose at the end of trading. However, how long will the bullish momentum based on Powell's words last?
The graph shows that:
→ the price of the S&P 500 is still in a downward trend, judging by the channel (shown in red), and the upper limit of the channel, where we should expect the bears to intensify their efforts, is already close;
→ the price has risen to the important technical level 4,266, which has repeatedly affected it — perhaps now it will provide resistance;
→ tapering bullish candles late yesterday indicate that buyer activity may be drying up.
Today, as we note, a report on the activities of Apple, the largest company by capitalization, will be released. If it turns out to be worse than expected (for example, due to the dynamics of sales of the 15th iPhone), then the positivity from Powell’s words can be significantly (if not completely) won back by the bears.
To benefit from the rise and fall of stock market indices, consider enlisting the services of a trusted broker like FXOpen.
CFDs are complex instruments and come with a high risk of losing your money.
This article represents the opinion of the Companies operating under the FXOpen brand only. It is not to be construed as an offer, solicitation, or recommendation with respect to products and services provided by the Companies operating under the FXOpen brand, nor is it to be considered financial advice.
#marketanalysis #bitcoin #crypto
Market Analysis: Bitcoin Updates Its Maximum for the Year
The cryptocurrency market showed a correlation with the stock market, gaining bullish momentum amid softening rhetoric from the Federal Reserve.
The price of the main cryptocurrency reached USD 35,900 for the first time in 18 months.
Wherein:
→ the positivity is also due to expectations that the US Securities and Exchange Commission will approve a Bitcoin ETF. According to analysts at Bernstein (an asset management firm), this could happen by the first quarter of 2024.
→ according to the same analysts, the price of Bitcoin could reach USD 150k by 2025;
→ Jurrien Timmer, director of global macroeconomics at Fidelity, called bitcoin a commodity currency or exponential gold that aims to be a store of value and a hedge against monetary depreciation.
Are the bullish sentiments that strong?
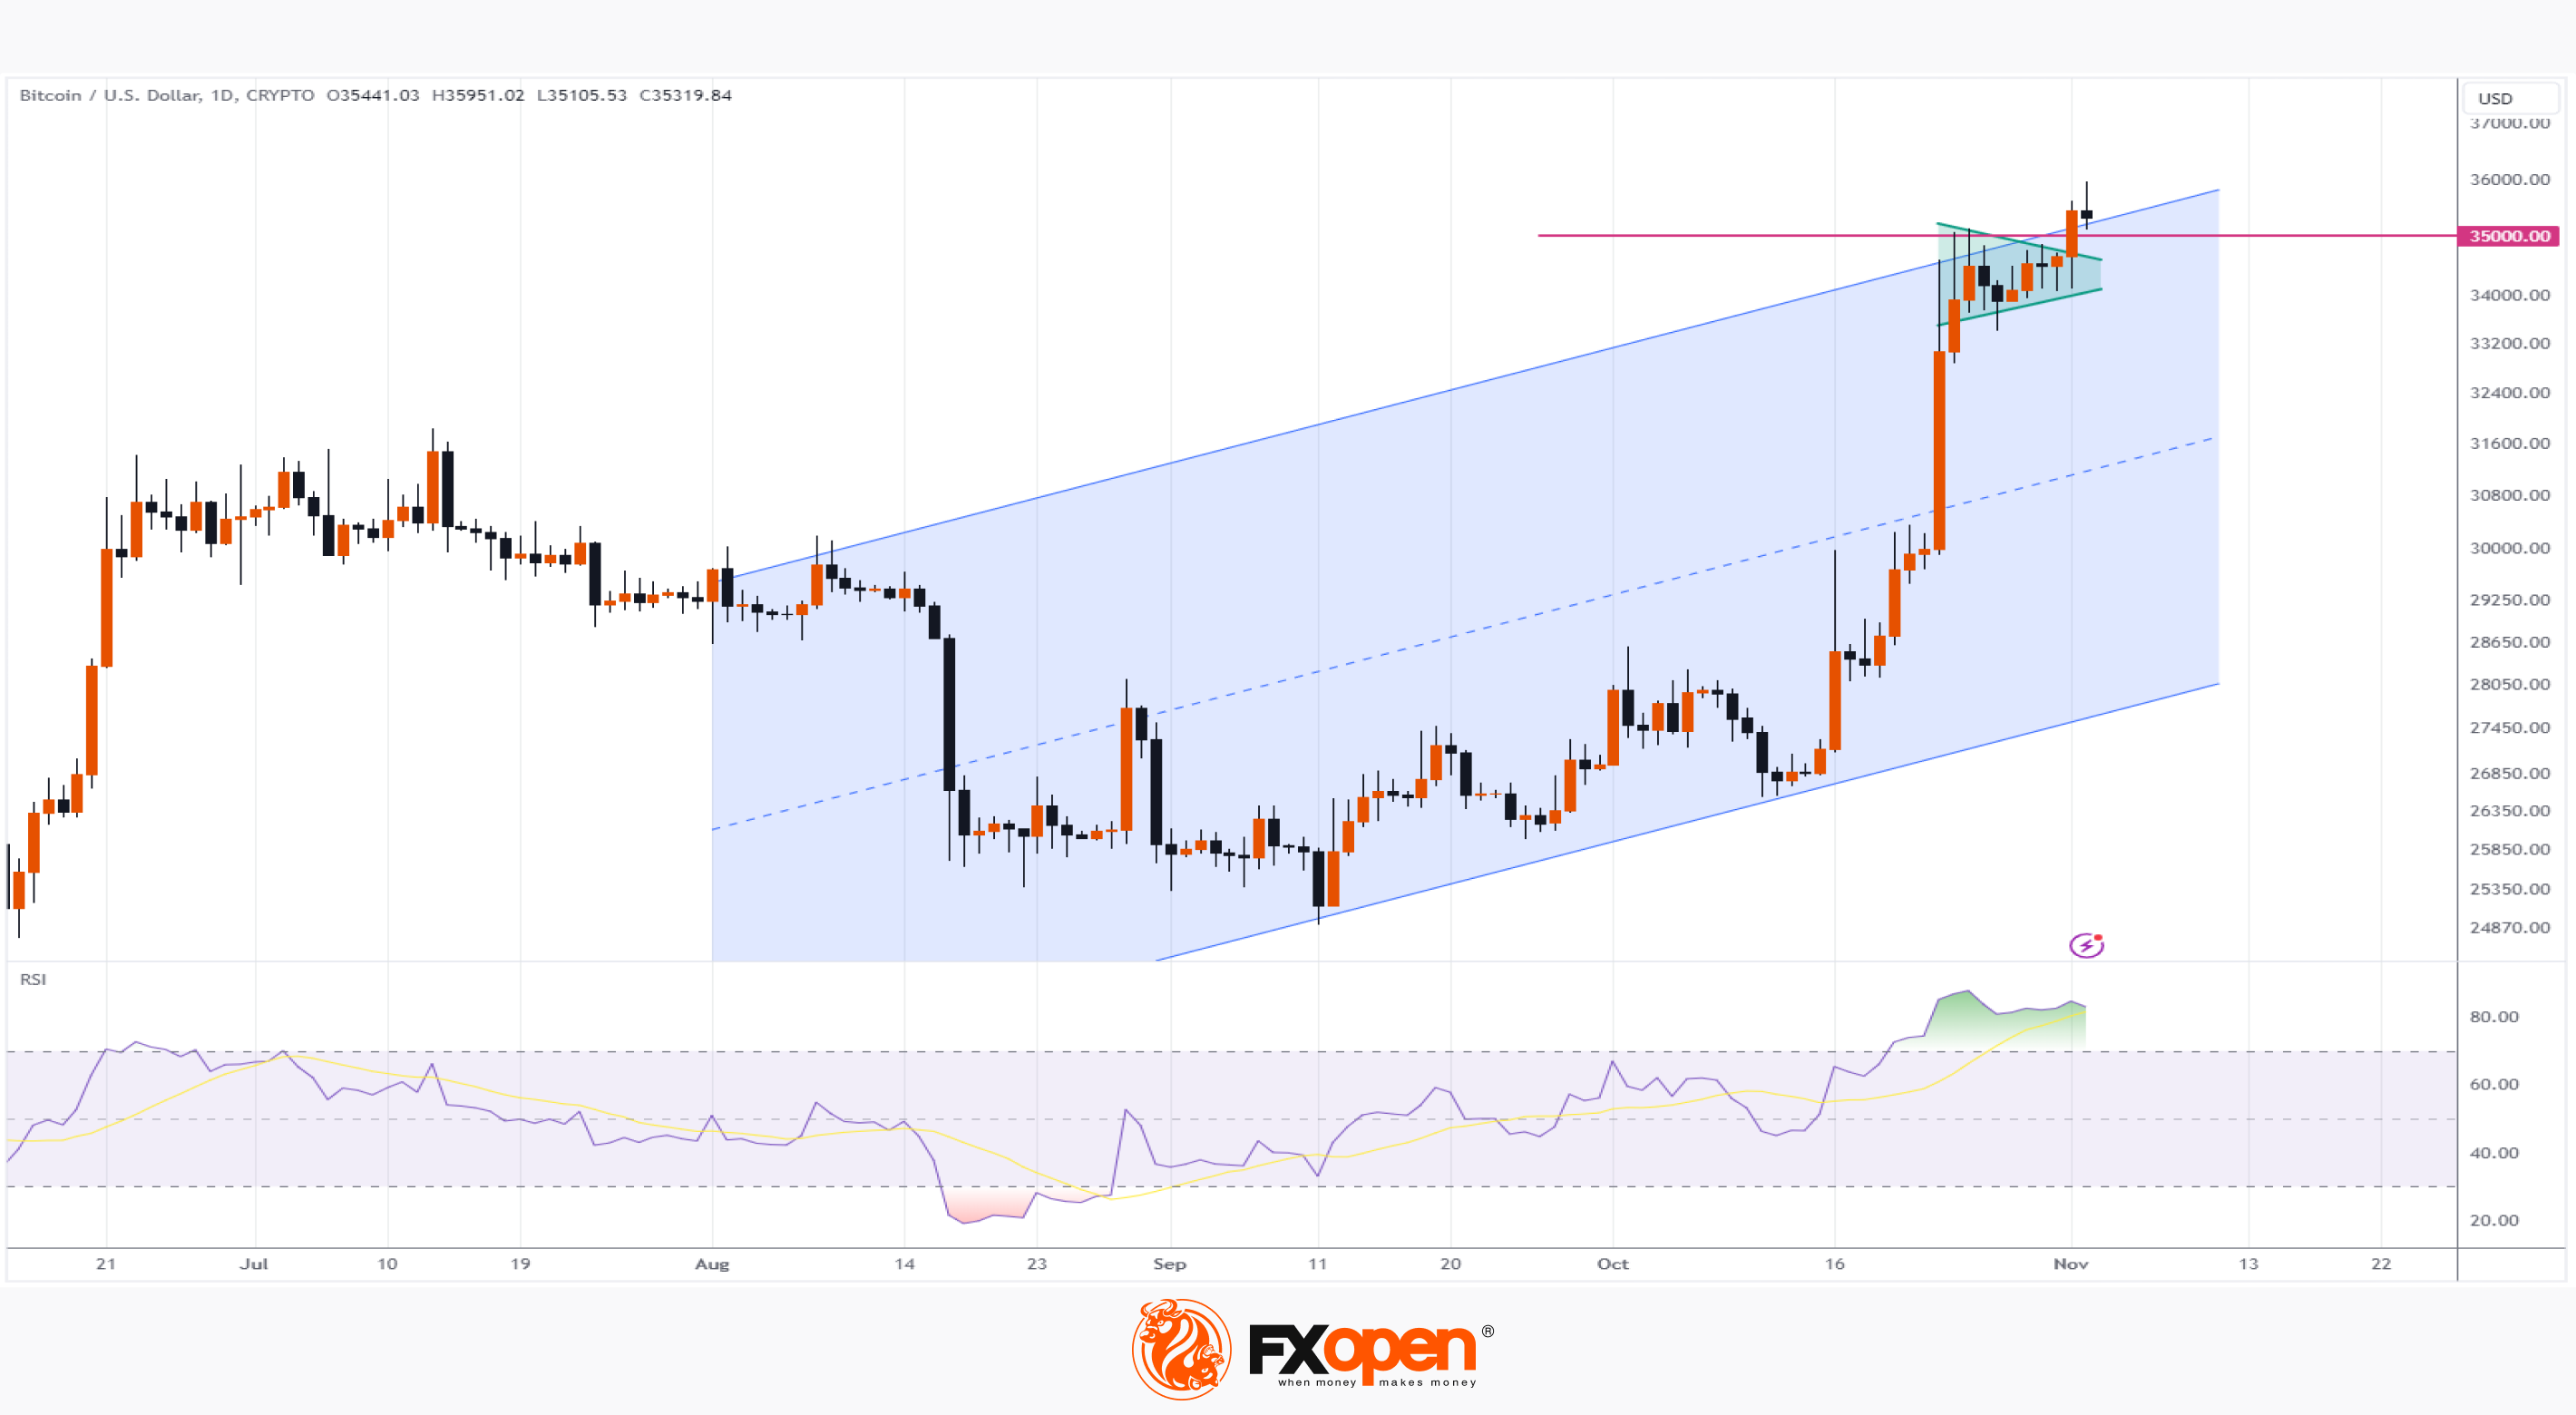
The chart provides information to help maintain an unbiased view of the market:
→ the price of BTC/USD is slightly above the upper border of the ascending channel. And this is a sign of overbought;
→ the price dynamics of BTC/USD forms a divergence with the RSI indicator, which is also in the overbought zone — which ultimately indicates the market’s vulnerability to a rollback;
→ the price is above the psychological level of 35,000 – and an analysis of the past behavior of the bitcoin price relative to round levels shows that false punctures are a common practice;
→ BTC/USD price has moved out of the consolidation zone (shown by the green triangle), but a breakout of the consolidation zone could be followed by a ton of buyers — and it is possible that they will find themselves locked in losses if a pullback does occur. A price return to the green triangle area will motivate them to close positions, thereby exerting even more selling pressure.
While ETF approval seems imminent and could attract significant capital to the bitcoin market over the long term, technically, the BTC/USD price could pull back from overbought territory.
To benefit from the rise and fall of cryptocurrency prices, consider enlisting the services of a trusted broker like FXOpen.
CFDs are complex instruments and come with a high risk of losing your money.
This article represents the opinion of the Companies operating under the FXOpen brand only. It is not to be construed as an offer, solicitation, or recommendation with respect to products and services provided by the Companies operating under the FXOpen brand, nor is it to be considered financial advice.
At FXOpen UK and FXOpen AU, Cryptocurrency CFDs are only available for trading by those clients categorised as Professional clients under FCA Rules and Professional clients under ASIC Rules, respectively. They are not available for trading by Retail clients.
Market Analysis: Bitcoin Updates Its Maximum for the Year
The cryptocurrency market showed a correlation with the stock market, gaining bullish momentum amid softening rhetoric from the Federal Reserve.
The price of the main cryptocurrency reached USD 35,900 for the first time in 18 months.
Wherein:
→ the positivity is also due to expectations that the US Securities and Exchange Commission will approve a Bitcoin ETF. According to analysts at Bernstein (an asset management firm), this could happen by the first quarter of 2024.
→ according to the same analysts, the price of Bitcoin could reach USD 150k by 2025;
→ Jurrien Timmer, director of global macroeconomics at Fidelity, called bitcoin a commodity currency or exponential gold that aims to be a store of value and a hedge against monetary depreciation.
Are the bullish sentiments that strong?
The chart provides information to help maintain an unbiased view of the market:
→ the price of BTC/USD is slightly above the upper border of the ascending channel. And this is a sign of overbought;
→ the price dynamics of BTC/USD forms a divergence with the RSI indicator, which is also in the overbought zone — which ultimately indicates the market’s vulnerability to a rollback;
→ the price is above the psychological level of 35,000 – and an analysis of the past behavior of the bitcoin price relative to round levels shows that false punctures are a common practice;
→ BTC/USD price has moved out of the consolidation zone (shown by the green triangle), but a breakout of the consolidation zone could be followed by a ton of buyers — and it is possible that they will find themselves locked in losses if a pullback does occur. A price return to the green triangle area will motivate them to close positions, thereby exerting even more selling pressure.
While ETF approval seems imminent and could attract significant capital to the bitcoin market over the long term, technically, the BTC/USD price could pull back from overbought territory.
To benefit from the rise and fall of cryptocurrency prices, consider enlisting the services of a trusted broker like FXOpen.
CFDs are complex instruments and come with a high risk of losing your money.
This article represents the opinion of the Companies operating under the FXOpen brand only. It is not to be construed as an offer, solicitation, or recommendation with respect to products and services provided by the Companies operating under the FXOpen brand, nor is it to be considered financial advice.
At FXOpen UK and FXOpen AU, Cryptocurrency CFDs are only available for trading by those clients categorised as Professional clients under FCA Rules and Professional clients under ASIC Rules, respectively. They are not available for trading by Retail clients.
#marketanalysis #MarketNews #forextrading
Market Analysis:The Franc May Continue to Strengthen amid Low Inflation
Today it became known about the level of inflation in Switzerland. Compared to the US, UK, and other countries, Switzerland can boast of a CPI of only 0.1%. The minimal increase in prices is due to an increase in fuel costs due to the rise in oil prices in the second half of the year. Thus, the country’s economy provides more arguments in favor of the protected harbor status.
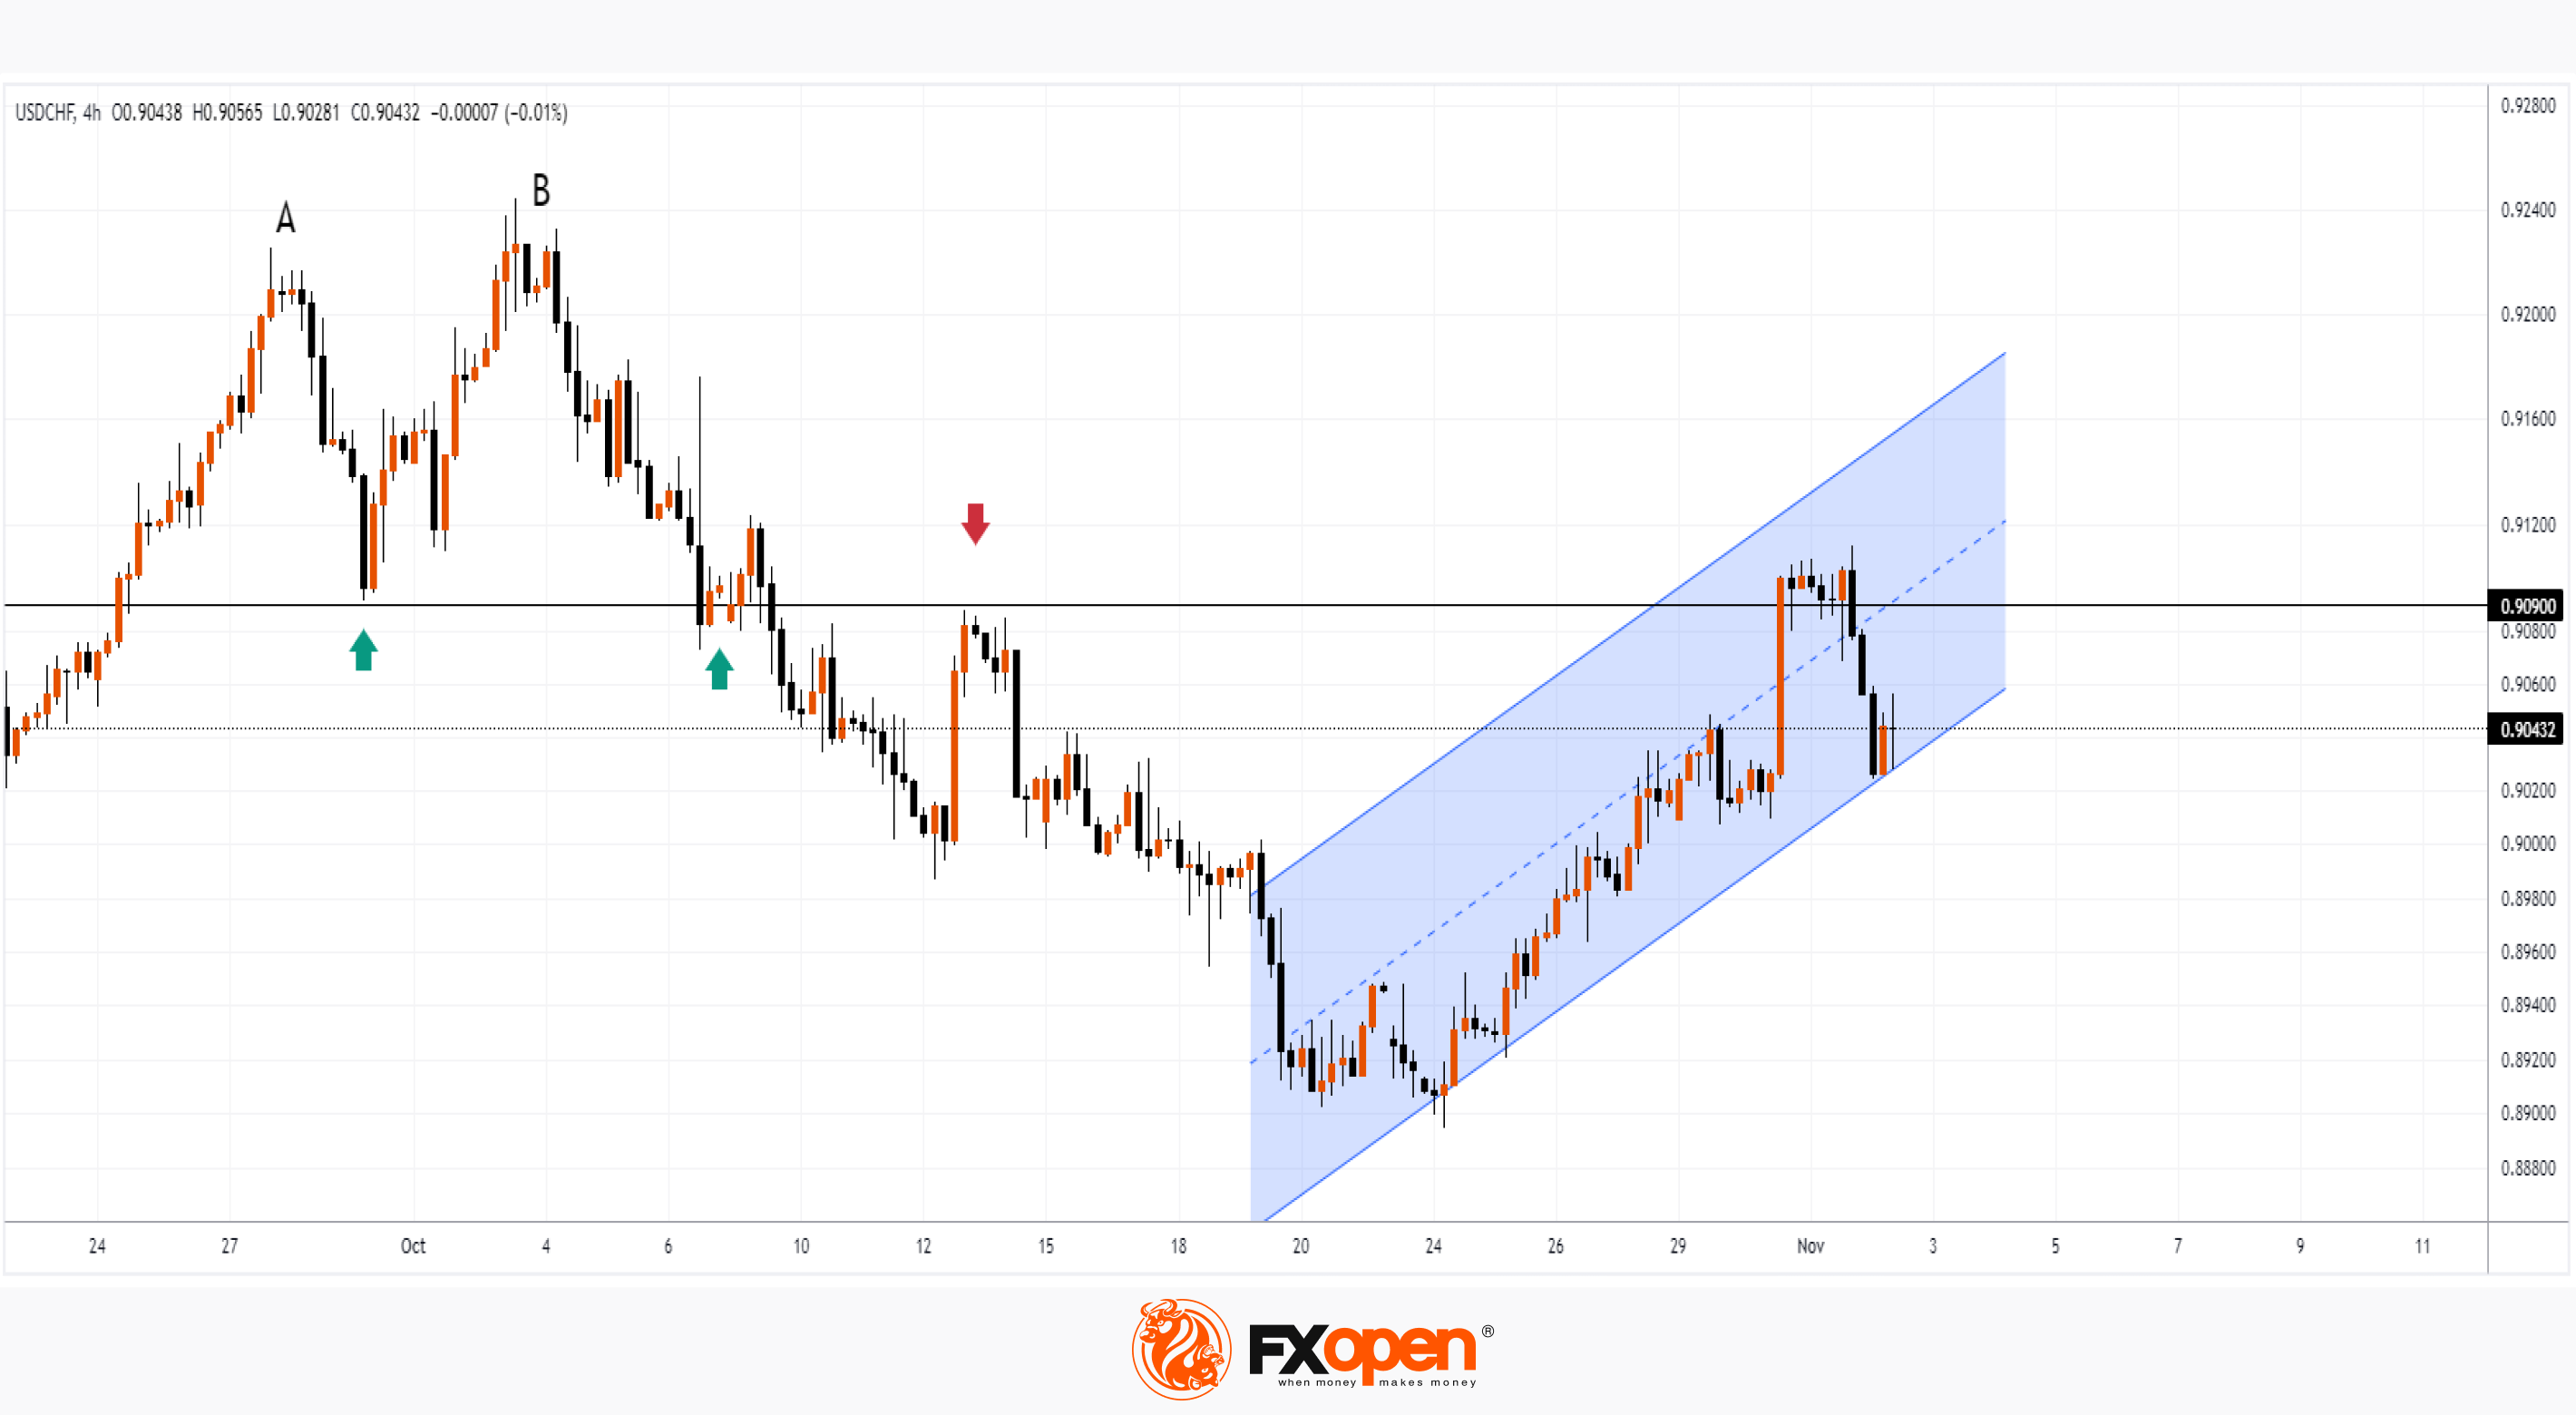
On October 5, we wrote that the Swiss franc was near an important resistance, forming an AB double top. After this, the rate fell by 2.5% to form the October low, and now the chart provides a new piece of information for analysis, in particular about the 0.909 level, which acts as an important resistance.
The USD/CHF price has interacted with it before (as shown by the arrows), but note:
→ the level was able to stop the sharp increase on October 31;
→ did not allow the price to reach the upper boundary of the ascending channel (shown in blue);
→ the price only briefly stayed higher. The bulls were unable to gain a foothold above 0.909, and the rate fell to the lower border of the channel.
On November 2-3, rebounds form from the lower border of the channel, which looks like a logical development of the situation, but the progress of the rebounds has not approached 50% of the decline from the November highs, so this can hardly be considered a successful resumption of the bullish trend. But the bears seem determined to firmly seize the initiative, given the strength and confidence of the Swiss economy and the CHF's ability to be protected from inflation.
To benefit from currency fluctuations, consider enlisting the services of a trusted broker like FXOpen.
CFDs are complex instruments and come with a high risk of losing your money.
This article represents the opinion of the Companies operating under the FXOpen brand only. It is not to be construed as an offer, solicitation, or recommendation with respect to products and services provided by the Companies operating under the FXOpen brand, nor is it to be considered financial advice.
Market Analysis:The Franc May Continue to Strengthen amid Low Inflation
Today it became known about the level of inflation in Switzerland. Compared to the US, UK, and other countries, Switzerland can boast of a CPI of only 0.1%. The minimal increase in prices is due to an increase in fuel costs due to the rise in oil prices in the second half of the year. Thus, the country’s economy provides more arguments in favor of the protected harbor status.
On October 5, we wrote that the Swiss franc was near an important resistance, forming an AB double top. After this, the rate fell by 2.5% to form the October low, and now the chart provides a new piece of information for analysis, in particular about the 0.909 level, which acts as an important resistance.
The USD/CHF price has interacted with it before (as shown by the arrows), but note:
→ the level was able to stop the sharp increase on October 31;
→ did not allow the price to reach the upper boundary of the ascending channel (shown in blue);
→ the price only briefly stayed higher. The bulls were unable to gain a foothold above 0.909, and the rate fell to the lower border of the channel.
On November 2-3, rebounds form from the lower border of the channel, which looks like a logical development of the situation, but the progress of the rebounds has not approached 50% of the decline from the November highs, so this can hardly be considered a successful resumption of the bullish trend. But the bears seem determined to firmly seize the initiative, given the strength and confidence of the Swiss economy and the CHF's ability to be protected from inflation.
To benefit from currency fluctuations, consider enlisting the services of a trusted broker like FXOpen.
CFDs are complex instruments and come with a high risk of losing your money.
This article represents the opinion of the Companies operating under the FXOpen brand only. It is not to be construed as an offer, solicitation, or recommendation with respect to products and services provided by the Companies operating under the FXOpen brand, nor is it to be considered financial advice.
#marketanalysis #stockmarket #stocktrading #AAPL
Market Analysis: AAPL Shares Fall after Strong Report
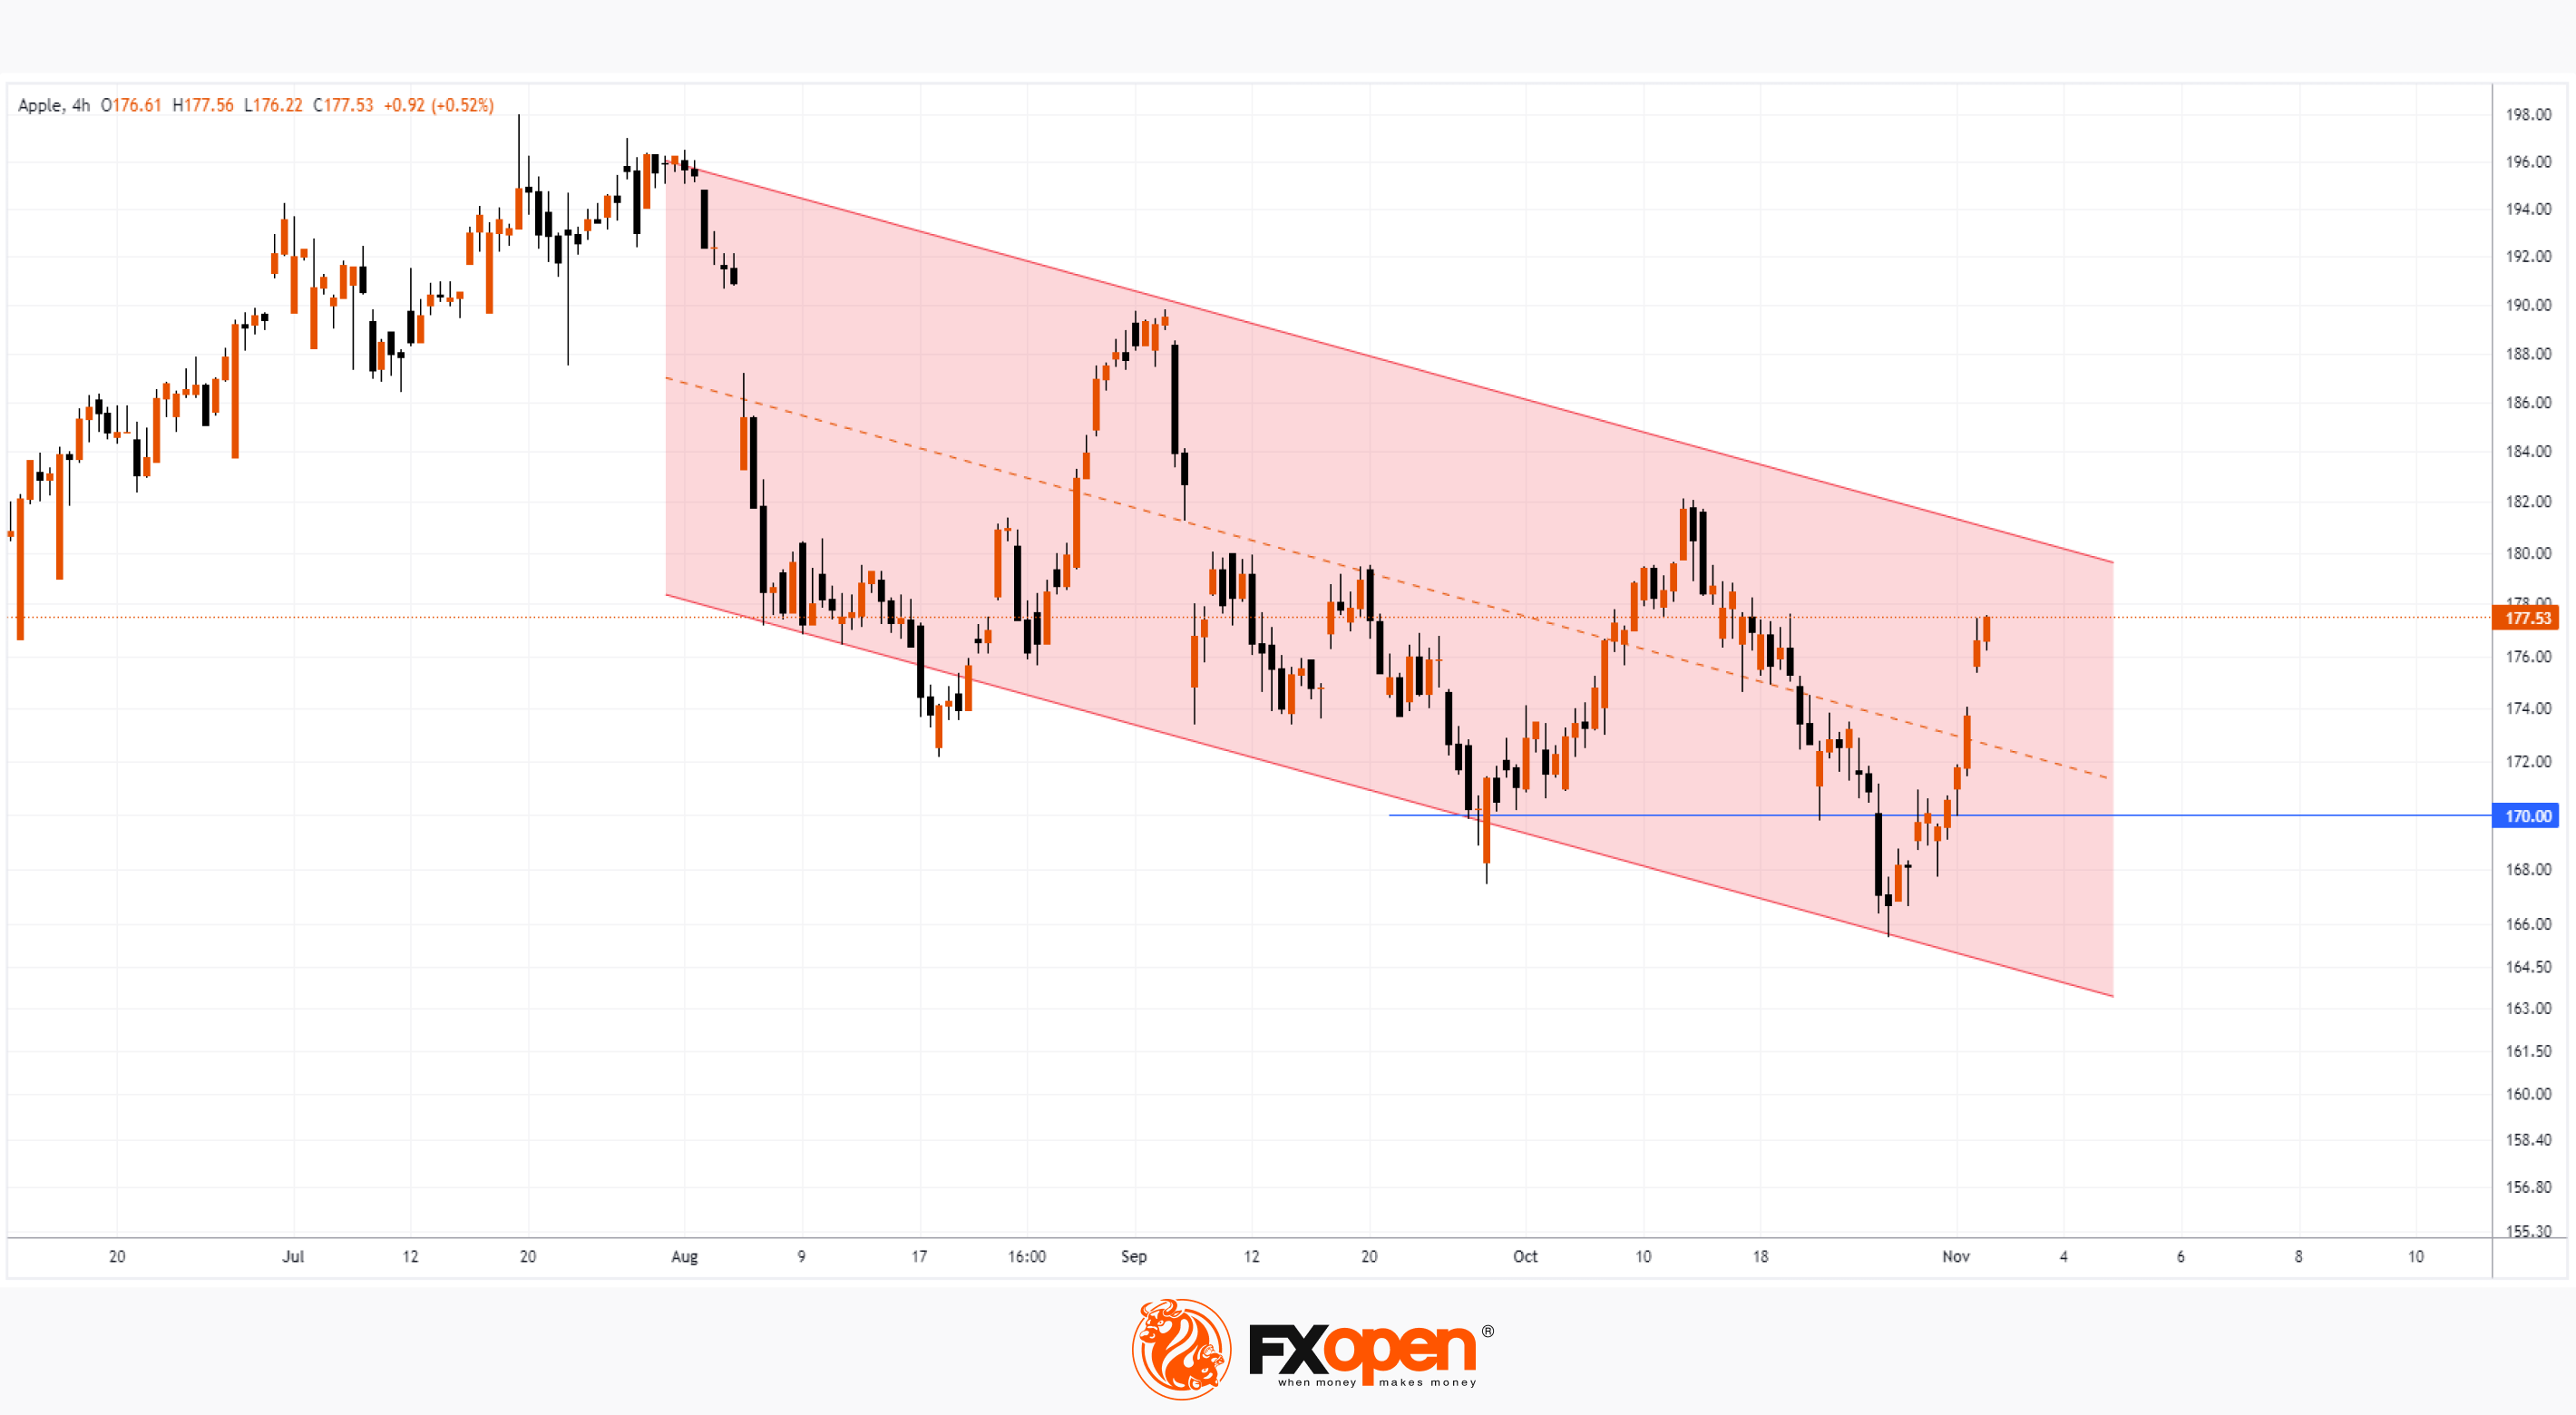
AAPL shares rose approximately 1.2% during the session yesterday in anticipation of a strong Q3 report. It actually turned out better than predicted:
→ earnings per share: actual = USD 1.46; forecast = USD 1.39;
→ gross income: actual = USD 89.49 billion; forecast = USD 89.34 billion.
However, as a result, the price of AAPL shares decreased; in the pre-market on Friday, the share price was about USD 171.50, although yesterday it closed at USD 177.78 according to the NASDAQ exchange (minus 3.50%).
The reason is the company's disappointing plans for the future.
Tim Cook refused to answer a question about Apple's investments in AI. And Apple Chief Financial Officer Luca Maestri failed to reassure investors that there would be a surge in sales over the holiday period, saying gross revenue would be similar to what it was a year ago. So analysts can expect the company to continue to show a decline in sales, which already looks like a trend for 2023.
AAPL stock price performance shows that the stock market is largely a reflection of hopes, emotions and belief in rumors. In fact:
→ the price continues to move in a downward trend (shown by the blue channel);
→ growth to its upper limit in the hope of a positive report turned into a collapse;
→ the opening of trading today may take place at the bottom of the channel;
→ bears may attack the psychological level of USD 170 per share today. This level is also important because it is approximately 50% of the price increase from the March lows to the highs of the year.
If the USD 170 level is broken by the bears with the extension of the candle body and increased volumes, it could become an important resistance further down the line. So close to losing the status of the most valuable company.
To benefit from the rise and fall of the world's hottest stocks, consider enlisting the services of a trusted broker like FXOpen.
CFDs are complex instruments and come with a high risk of losing your money.
This article represents the opinion of the Companies operating under the FXOpen brand only. It is not to be construed as an offer, solicitation, or recommendation with respect to products and services provided by the Companies operating under the FXOpen brand, nor is it to be considered financial advice.
Market Analysis: AAPL Shares Fall after Strong Report
AAPL shares rose approximately 1.2% during the session yesterday in anticipation of a strong Q3 report. It actually turned out better than predicted:
→ earnings per share: actual = USD 1.46; forecast = USD 1.39;
→ gross income: actual = USD 89.49 billion; forecast = USD 89.34 billion.
However, as a result, the price of AAPL shares decreased; in the pre-market on Friday, the share price was about USD 171.50, although yesterday it closed at USD 177.78 according to the NASDAQ exchange (minus 3.50%).
The reason is the company's disappointing plans for the future.
Tim Cook refused to answer a question about Apple's investments in AI. And Apple Chief Financial Officer Luca Maestri failed to reassure investors that there would be a surge in sales over the holiday period, saying gross revenue would be similar to what it was a year ago. So analysts can expect the company to continue to show a decline in sales, which already looks like a trend for 2023.
AAPL stock price performance shows that the stock market is largely a reflection of hopes, emotions and belief in rumors. In fact:
→ the price continues to move in a downward trend (shown by the blue channel);
→ growth to its upper limit in the hope of a positive report turned into a collapse;
→ the opening of trading today may take place at the bottom of the channel;
→ bears may attack the psychological level of USD 170 per share today. This level is also important because it is approximately 50% of the price increase from the March lows to the highs of the year.
If the USD 170 level is broken by the bears with the extension of the candle body and increased volumes, it could become an important resistance further down the line. So close to losing the status of the most valuable company.
To benefit from the rise and fall of the world's hottest stocks, consider enlisting the services of a trusted broker like FXOpen.
CFDs are complex instruments and come with a high risk of losing your money.
This article represents the opinion of the Companies operating under the FXOpen brand only. It is not to be construed as an offer, solicitation, or recommendation with respect to products and services provided by the Companies operating under the FXOpen brand, nor is it to be considered financial advice.
#marketanalysis #tradingforex #MarketNews
GBP/USD Analysis: Bulls Raising Their Heads
Yesterday, 2 important news pieces were published regarding the GBP/USD exchange rate.
First, the Bank of England kept interest rates at a 15-year high of 5.25%. This is the second meeting in a row without a rate change, after 14 consecutive increases. It was also noted that the Bank does not expect rates to be cut in the near future. There is a growing consensus among analysts in the media that the Bank of England, like many of its peers, has ended the cycle of tightening rates, and now the question is how long they will remain at the peak.
Following the results of yesterday, the pound reacted with some strengthening relative to other currencies.
Secondly, news from the USA witnessed an unexpected increase in weekly applications for unemployment benefits — the number amounted to 217k, although a week ago = 210k, 2 weeks ago = 190k.
As of yesterday, the dollar did not change much in price relative to other currencies, but this is an alarming call for the labour market, which Powell called strong just yesterday.
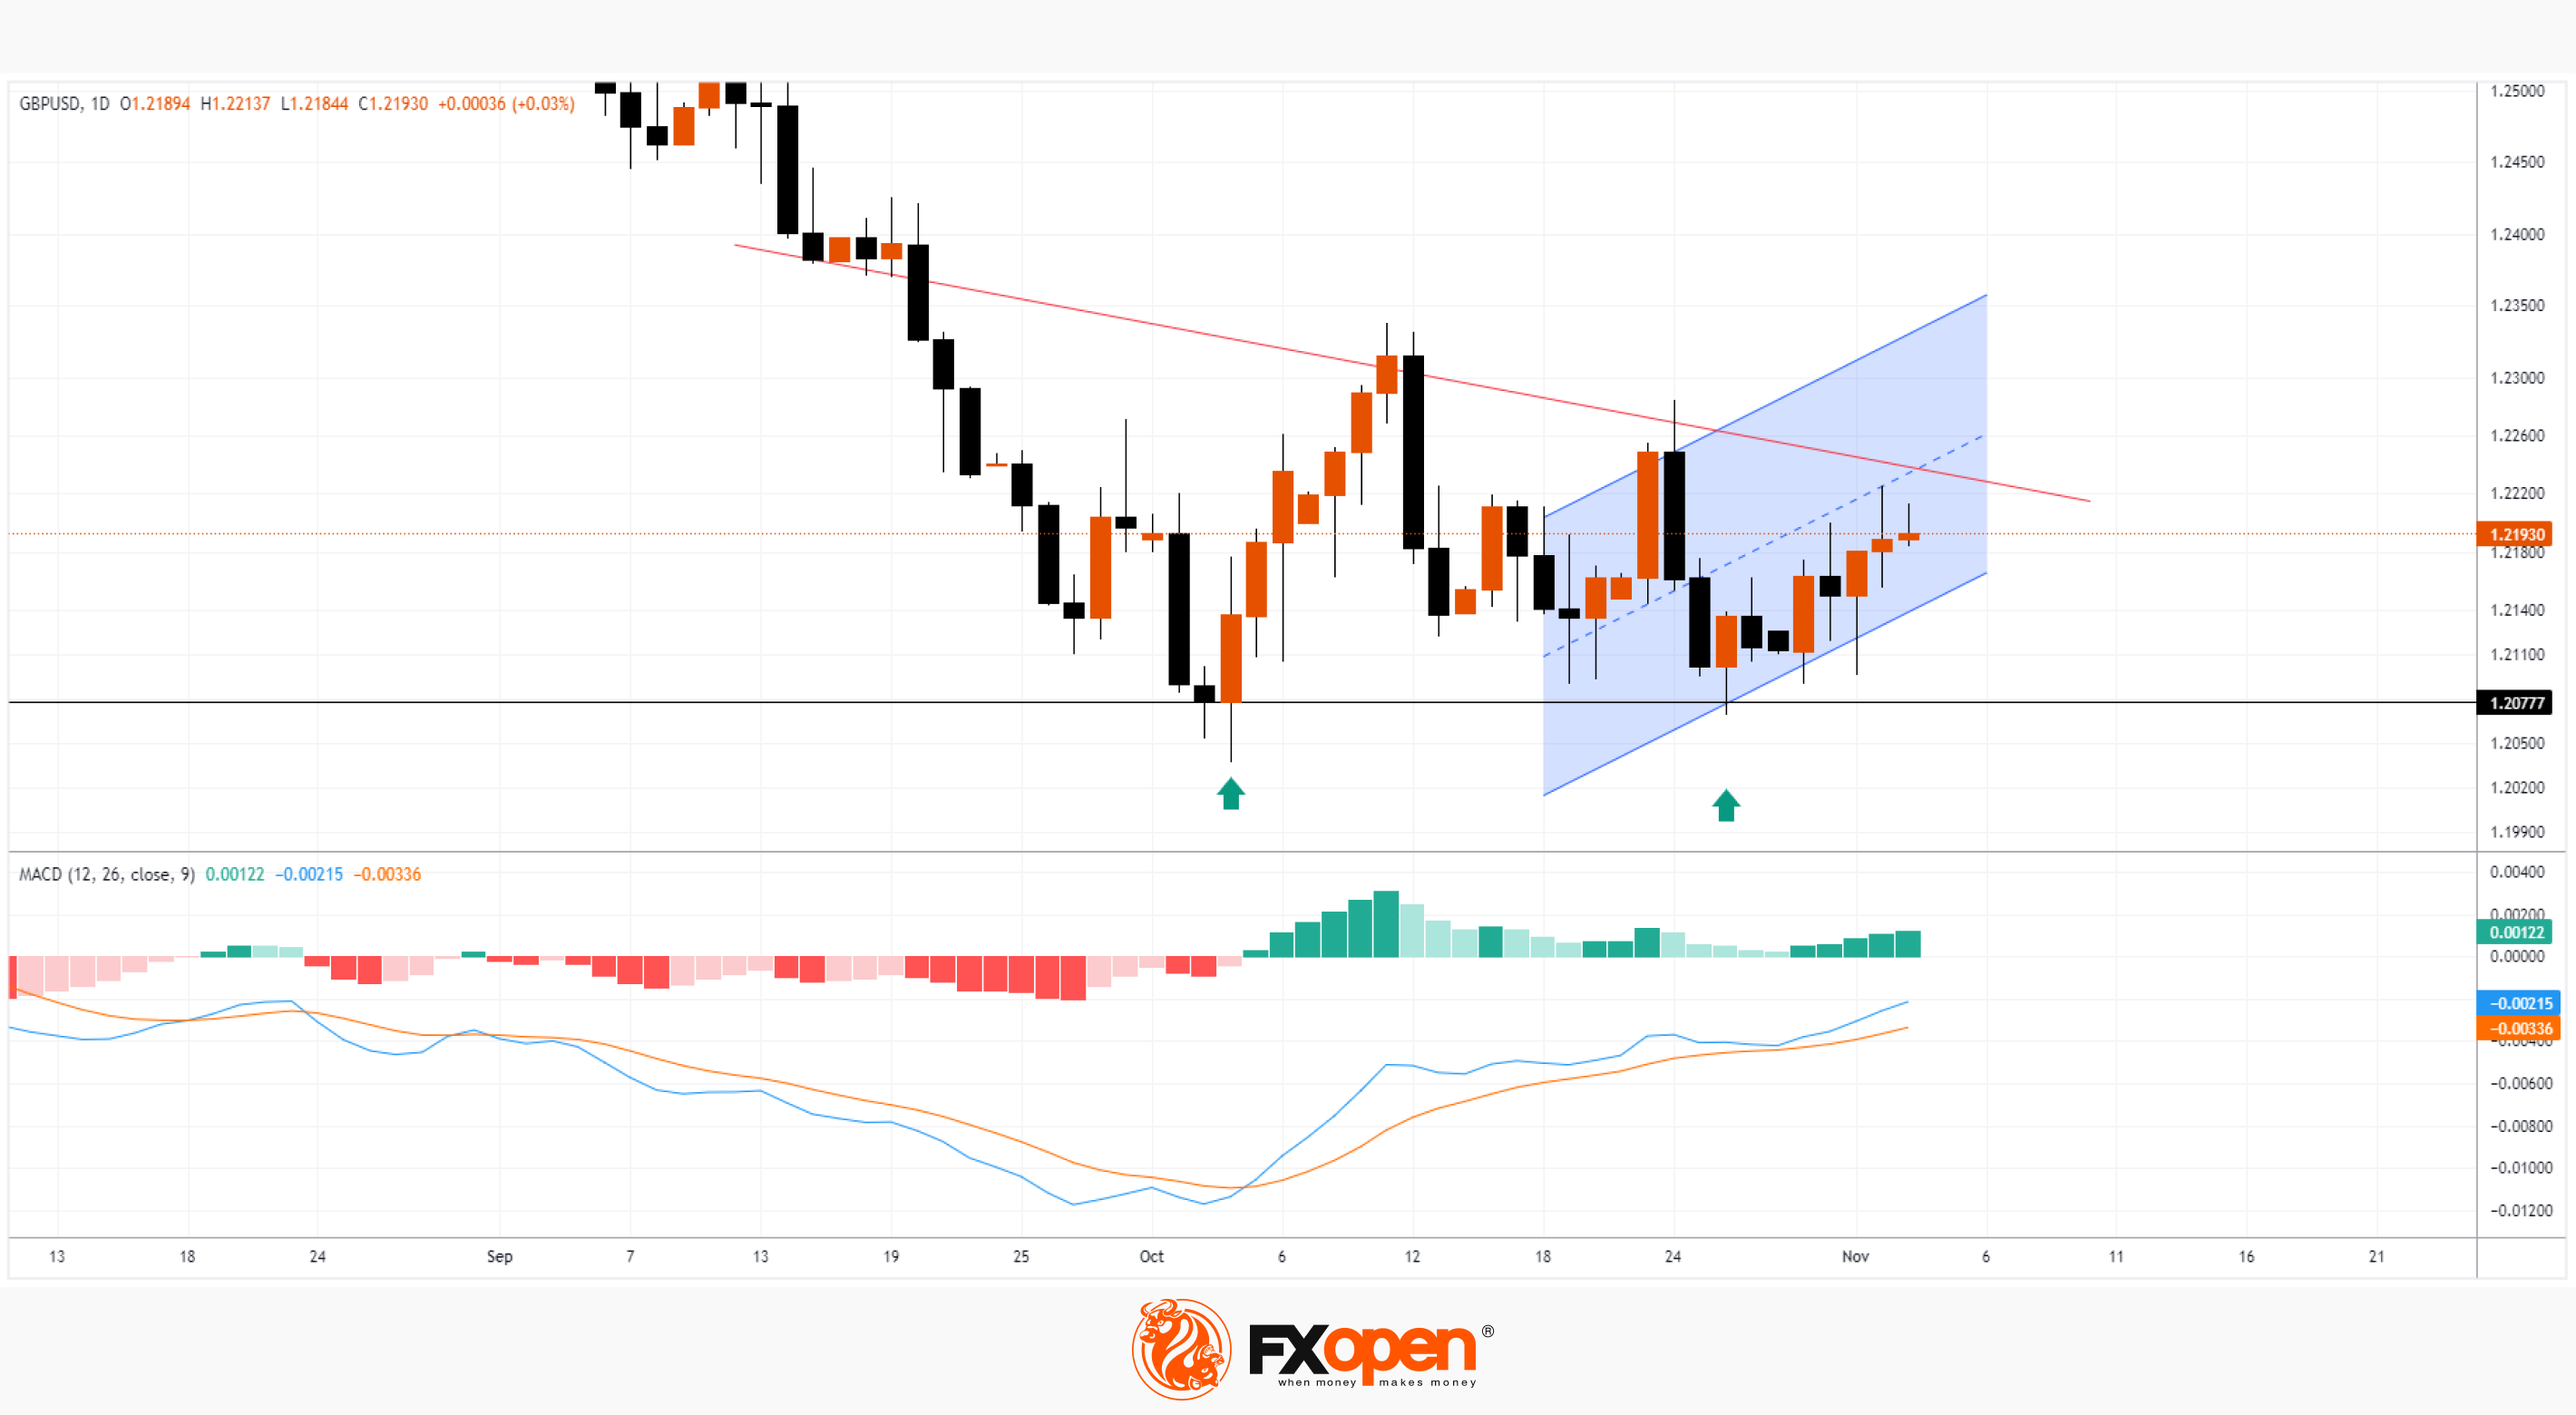
The GBP/USD chart meanwhile shows bulls trying to push off the 1.20777 level - note the double bottom pattern formed in October. Wherein:
→ on the 4-hour chart, the contours of the ascending channel are more clearly visible (shown in blue);
→ For most of October, the bulls were able to keep the MACD above the zero line.
However, the bearish trend line (shown in red) appears to be an important obstacle. In the near future, it may become an important test of the seriousness of buyers’ intentions. If they fail, it will jeopardize the important 1.20777 level.
To benefit from the rise and fall of currency rates, consider enlisting the services of a trusted broker like FXOpen.
CFDs are complex instruments and come with a high risk of losing your money.
This article represents the opinion of the Companies operating under the FXOpen brand only. It is not to be construed as an offer, solicitation, or recommendation with respect to products and services provided by the Companies operating under the FXOpen brand, nor is it to be considered financial advice.
GBP/USD Analysis: Bulls Raising Their Heads
Yesterday, 2 important news pieces were published regarding the GBP/USD exchange rate.
First, the Bank of England kept interest rates at a 15-year high of 5.25%. This is the second meeting in a row without a rate change, after 14 consecutive increases. It was also noted that the Bank does not expect rates to be cut in the near future. There is a growing consensus among analysts in the media that the Bank of England, like many of its peers, has ended the cycle of tightening rates, and now the question is how long they will remain at the peak.
Following the results of yesterday, the pound reacted with some strengthening relative to other currencies.
Secondly, news from the USA witnessed an unexpected increase in weekly applications for unemployment benefits — the number amounted to 217k, although a week ago = 210k, 2 weeks ago = 190k.
As of yesterday, the dollar did not change much in price relative to other currencies, but this is an alarming call for the labour market, which Powell called strong just yesterday.
The GBP/USD chart meanwhile shows bulls trying to push off the 1.20777 level - note the double bottom pattern formed in October. Wherein:
→ on the 4-hour chart, the contours of the ascending channel are more clearly visible (shown in blue);
→ For most of October, the bulls were able to keep the MACD above the zero line.
However, the bearish trend line (shown in red) appears to be an important obstacle. In the near future, it may become an important test of the seriousness of buyers’ intentions. If they fail, it will jeopardize the important 1.20777 level.
To benefit from the rise and fall of currency rates, consider enlisting the services of a trusted broker like FXOpen.
CFDs are complex instruments and come with a high risk of losing your money.
This article represents the opinion of the Companies operating under the FXOpen brand only. It is not to be construed as an offer, solicitation, or recommendation with respect to products and services provided by the Companies operating under the FXOpen brand, nor is it to be considered financial advice.
#sp500 #stockmarket #marketanalysis
S&P 500 Analysis: Best Week of the Year, Despite Bad News from Labour Market
According to Friday's data, in the US:
→ the unemployment rate rose to 3.9% (expected = 3.8%). The last time the level was this high was in February 2022.
→ the number of workers employed in the non-agricultural sector increased over the month by only 150k (+178k expected). The last time the figure was below 150k was in February 2021.
Published negative data clearly indicate a cooling of the labour market. Why then did the E-mini S&P-500 futures price end the week up about 5.5%, marking the best week of 2023?
The point is that market participants are increasingly convinced that the Fed will no longer tighten monetary policy. That is, interest rates have peaked, the next step should be to ease them, which will allow companies to grow.
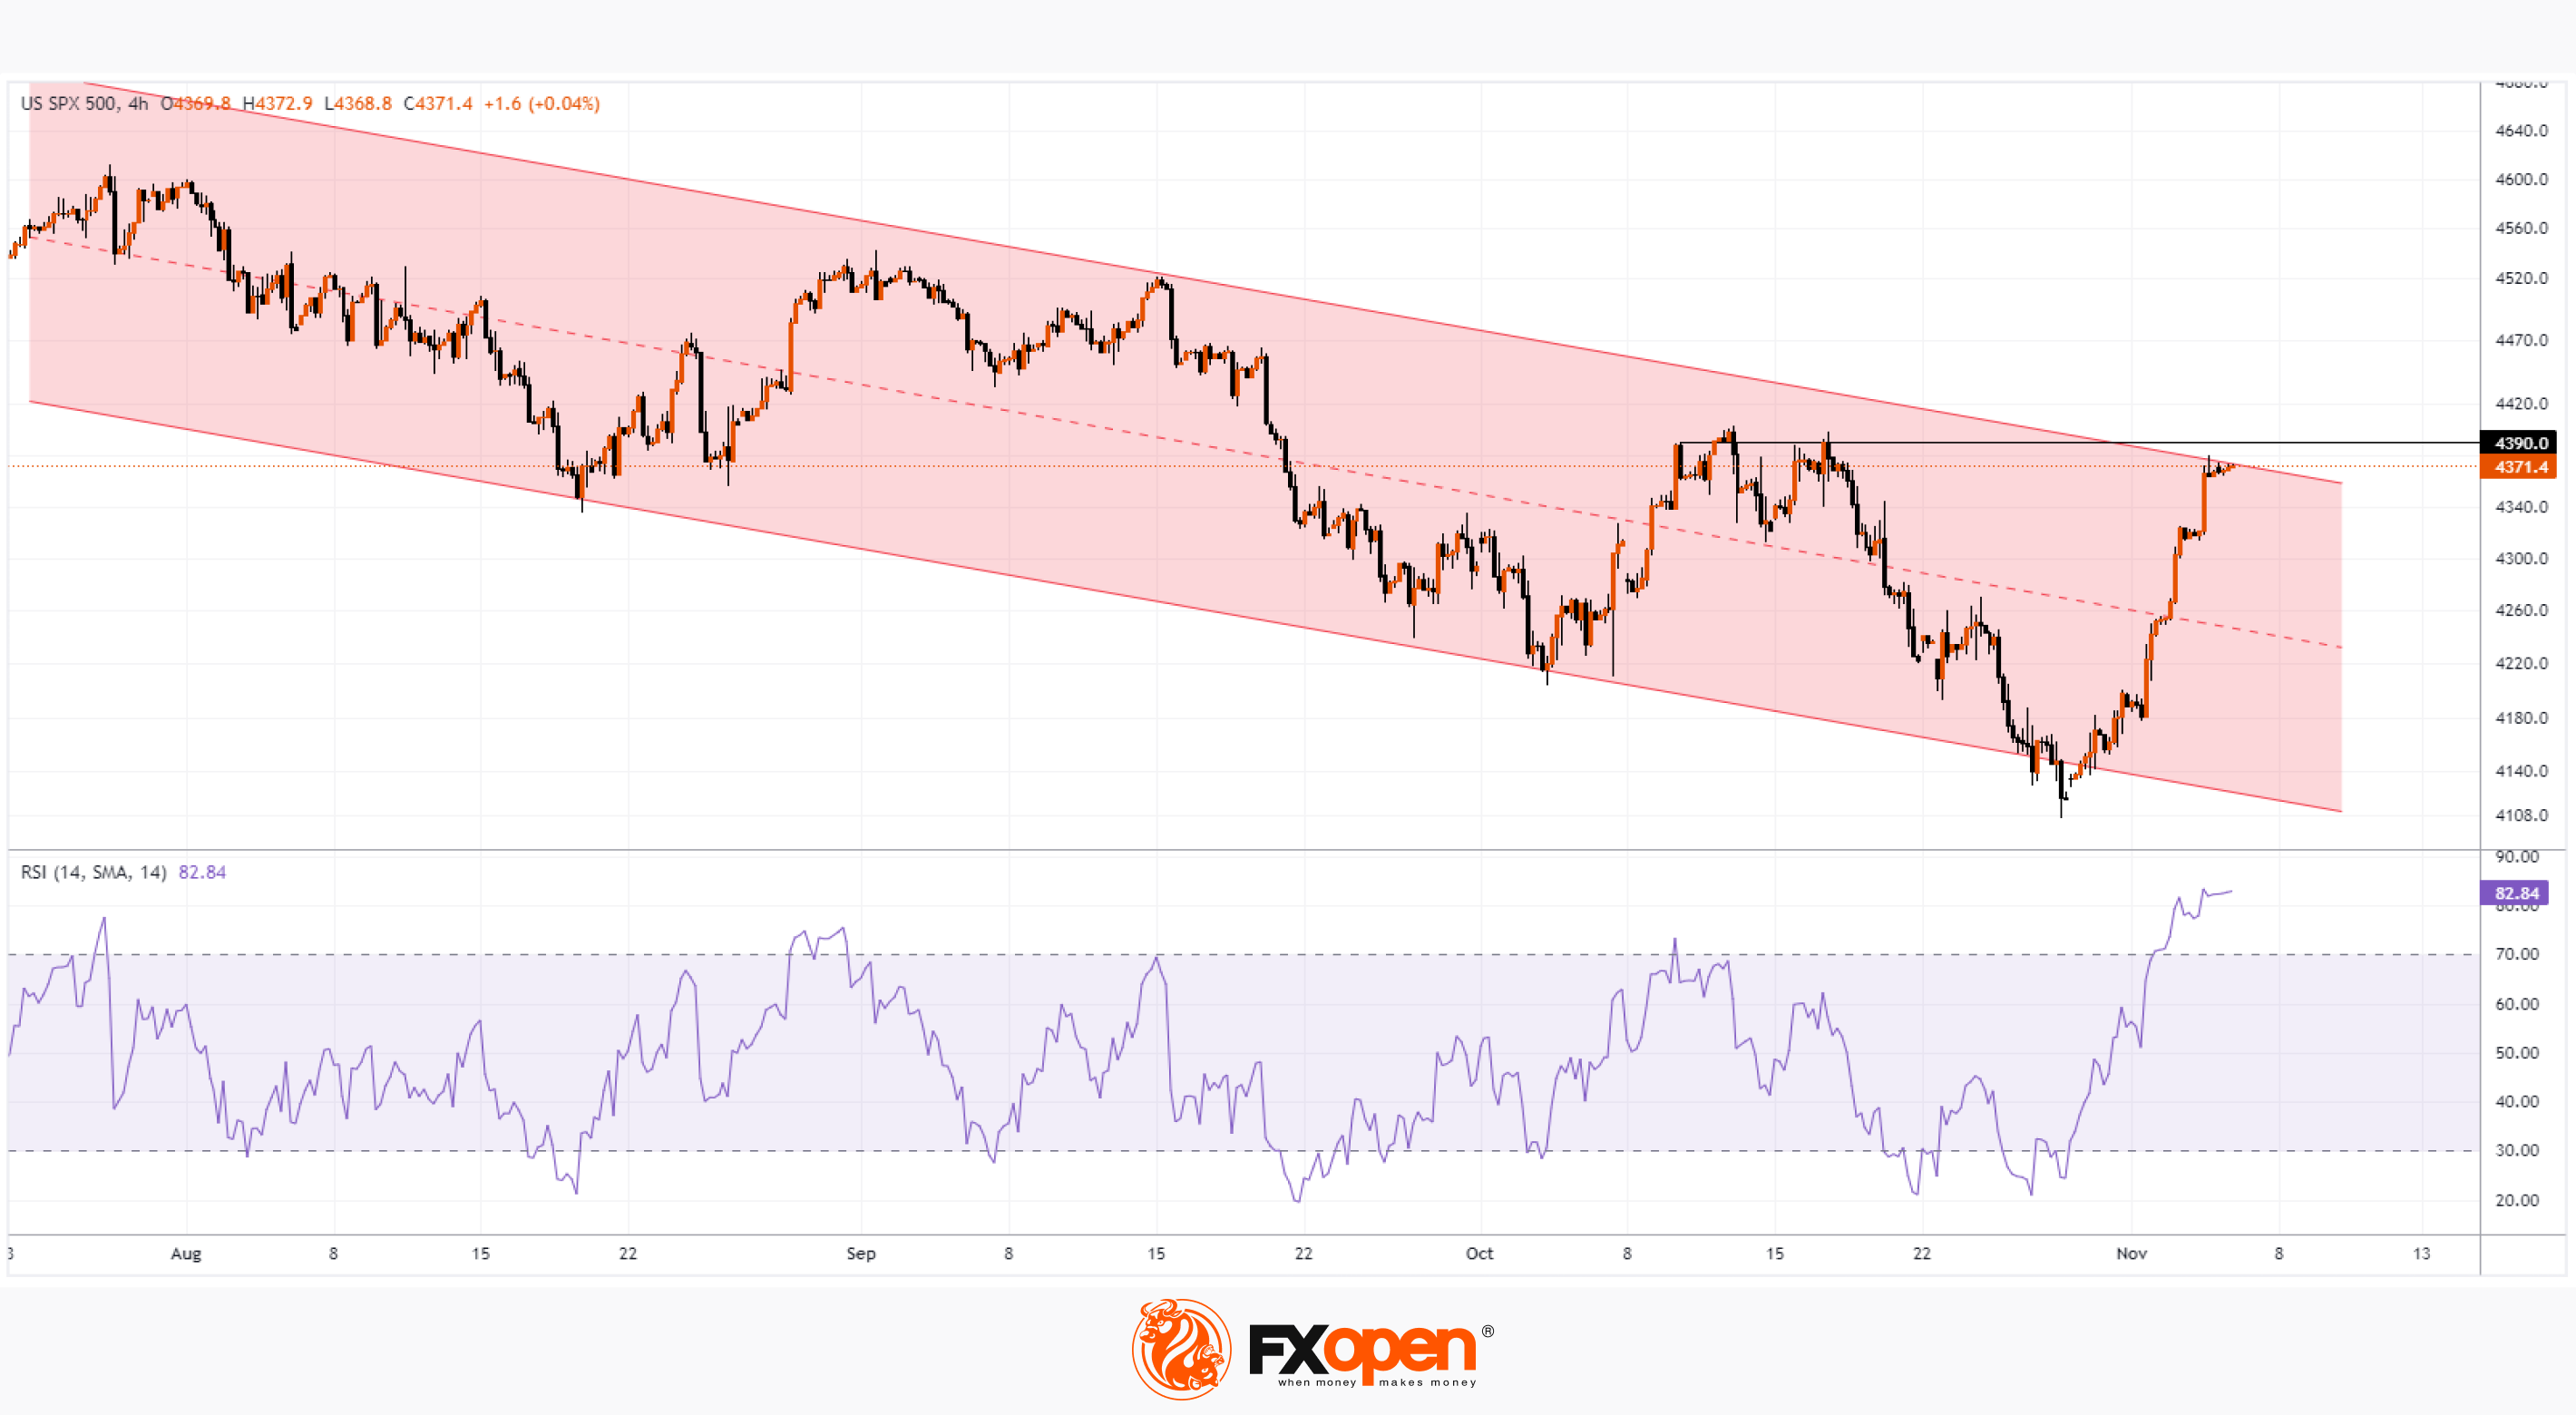
The 4-hour chart of the S&P 500 shows that the index price:
→ has reached the upper border of the descending channel, above which there is a resistance line from the October highs;
→ the RSI indicates severe overbought.
That is, the market is in a vulnerable position for the formation of a rollback from current price levels. If the price goes into a pullback, it will be an important test for the current positive interpretations of statistical data — is rising unemployment really a good thing for the stock market?
To benefit from fluctuations in stock market indices around the world, consider enlisting the services of a trusted broker like FXOpen.
CFDs are complex instruments and come with a high risk of losing your money.
This article represents the opinion of the Companies operating under the FXOpen brand only. It is not to be construed as an offer, solicitation, or recommendation with respect to products and services provided by the Companies operating under the FXOpen brand, nor is it to be considered financial advice.
S&P 500 Analysis: Best Week of the Year, Despite Bad News from Labour Market
According to Friday's data, in the US:
→ the unemployment rate rose to 3.9% (expected = 3.8%). The last time the level was this high was in February 2022.
→ the number of workers employed in the non-agricultural sector increased over the month by only 150k (+178k expected). The last time the figure was below 150k was in February 2021.
Published negative data clearly indicate a cooling of the labour market. Why then did the E-mini S&P-500 futures price end the week up about 5.5%, marking the best week of 2023?
The point is that market participants are increasingly convinced that the Fed will no longer tighten monetary policy. That is, interest rates have peaked, the next step should be to ease them, which will allow companies to grow.
The 4-hour chart of the S&P 500 shows that the index price:
→ has reached the upper border of the descending channel, above which there is a resistance line from the October highs;
→ the RSI indicates severe overbought.
That is, the market is in a vulnerable position for the formation of a rollback from current price levels. If the price goes into a pullback, it will be an important test for the current positive interpretations of statistical data — is rising unemployment really a good thing for the stock market?
To benefit from fluctuations in stock market indices around the world, consider enlisting the services of a trusted broker like FXOpen.
CFDs are complex instruments and come with a high risk of losing your money.
This article represents the opinion of the Companies operating under the FXOpen brand only. It is not to be construed as an offer, solicitation, or recommendation with respect to products and services provided by the Companies operating under the FXOpen brand, nor is it to be considered financial advice.
#riskmanagement #tradingtips #tradingstrategies #forextrading
Types of Risk in Trading and Risk Management Strategies
Trading in the financial markets can be rewarding, but it comes with its fair share of risks. Our latest article delves into the various types of risks in trading and offers valuable insights into risk management strategies.
🔗 Learn more: https://cutt.ly/swTf0roD
To take advantage of price fluctuations in the foreign exchange markets, consider enlisting the services of a reliable broker like FXOpen.
⚠️
This forecast represents FXOpen Companies opinion only, it should not be construed as an offer, invitation or recommendation in respect to FXOpen Companies products and services or as financial advice
At FXOpen UK and FXOpen AU, Cryptocurrency CFDs are only available for trading by those clients categorised as Professional clients under FCA Rules and Professional clients under ASIC Rules respectively. They are not available for trading by Retail clients.
Types of Risk in Trading and Risk Management Strategies
Trading in the financial markets can be rewarding, but it comes with its fair share of risks. Our latest article delves into the various types of risks in trading and offers valuable insights into risk management strategies.
🔗 Learn more: https://cutt.ly/swTf0roD
To take advantage of price fluctuations in the foreign exchange markets, consider enlisting the services of a reliable broker like FXOpen.
⚠️
This forecast represents FXOpen Companies opinion only, it should not be construed as an offer, invitation or recommendation in respect to FXOpen Companies products and services or as financial advice
At FXOpen UK and FXOpen AU, Cryptocurrency CFDs are only available for trading by those clients categorised as Professional clients under FCA Rules and Professional clients under ASIC Rules respectively. They are not available for trading by Retail clients.
Market Pulse
Types of Risk in Trading and Risk Management Strategies | FXOpen
Explore the risks traders face to be fully prepared for any trading situation. Learn about the most effective trading risk management strategies.
#marketanalysis #oilprices #oilindustry
Market Analysis: Oil Prices Fall to Lowest Level since July
As the chart shows, the price of WTI oil has dropped below USD 77.50 – the last time prices were this high was in mid-July.
The decline in oil prices was contributed to by:
→ first, easing concerns about the escalation of the military conflict in the Middle East and interruptions in the supply of oil produced in the region;
→ secondly, the data from Beijing. While China's crude oil imports rose in volume and value in October, the country's total exports fell 6.4% year on year, more than expected, CNBC reports. This points to a slowdown in demand in a world where central banks in many countries are keeping interest rates high to combat inflation.
Thus, supply forces prevail despite the fact that Russia and Saudi Arabia announced continued restrictions on oil production amid the conflict in the Middle East.
The oil price chart today shows that:
→ the market is oversold, judging by the RSI indicator;
→ the price is near the lower border of the downward channel.
Therefore, the market is vulnerable to some price recovery from the oversold zone. If this happens, the price will form a false breakout of the August lows and could then test the USD 80.00 level. It is possible that this psychological level, which provided support on November 1-3 after yesterday's bearish breakout, will act as resistance — similar to what happened with the USD 82.50 level.
To benefit from the rise and fall of oil prices, consider enlisting the services of a trusted broker like FXOpen.
CFDs are complex instruments and come with a high risk of losing your money.
This article represents the opinion of the Companies operating under the FXOpen brand only. It is not to be construed as an offer, solicitation, or recommendation with respect to products and services provided by the Companies operating under the FXOpen brand, nor is it to be considered financial advice.
Market Analysis: Oil Prices Fall to Lowest Level since July
As the chart shows, the price of WTI oil has dropped below USD 77.50 – the last time prices were this high was in mid-July.
The decline in oil prices was contributed to by:
→ first, easing concerns about the escalation of the military conflict in the Middle East and interruptions in the supply of oil produced in the region;
→ secondly, the data from Beijing. While China's crude oil imports rose in volume and value in October, the country's total exports fell 6.4% year on year, more than expected, CNBC reports. This points to a slowdown in demand in a world where central banks in many countries are keeping interest rates high to combat inflation.
Thus, supply forces prevail despite the fact that Russia and Saudi Arabia announced continued restrictions on oil production amid the conflict in the Middle East.
The oil price chart today shows that:
→ the market is oversold, judging by the RSI indicator;
→ the price is near the lower border of the downward channel.
Therefore, the market is vulnerable to some price recovery from the oversold zone. If this happens, the price will form a false breakout of the August lows and could then test the USD 80.00 level. It is possible that this psychological level, which provided support on November 1-3 after yesterday's bearish breakout, will act as resistance — similar to what happened with the USD 82.50 level.
To benefit from the rise and fall of oil prices, consider enlisting the services of a trusted broker like FXOpen.
CFDs are complex instruments and come with a high risk of losing your money.
This article represents the opinion of the Companies operating under the FXOpen brand only. It is not to be construed as an offer, solicitation, or recommendation with respect to products and services provided by the Companies operating under the FXOpen brand, nor is it to be considered financial advice.
#marketanalysis #goldprice #XAUUSD
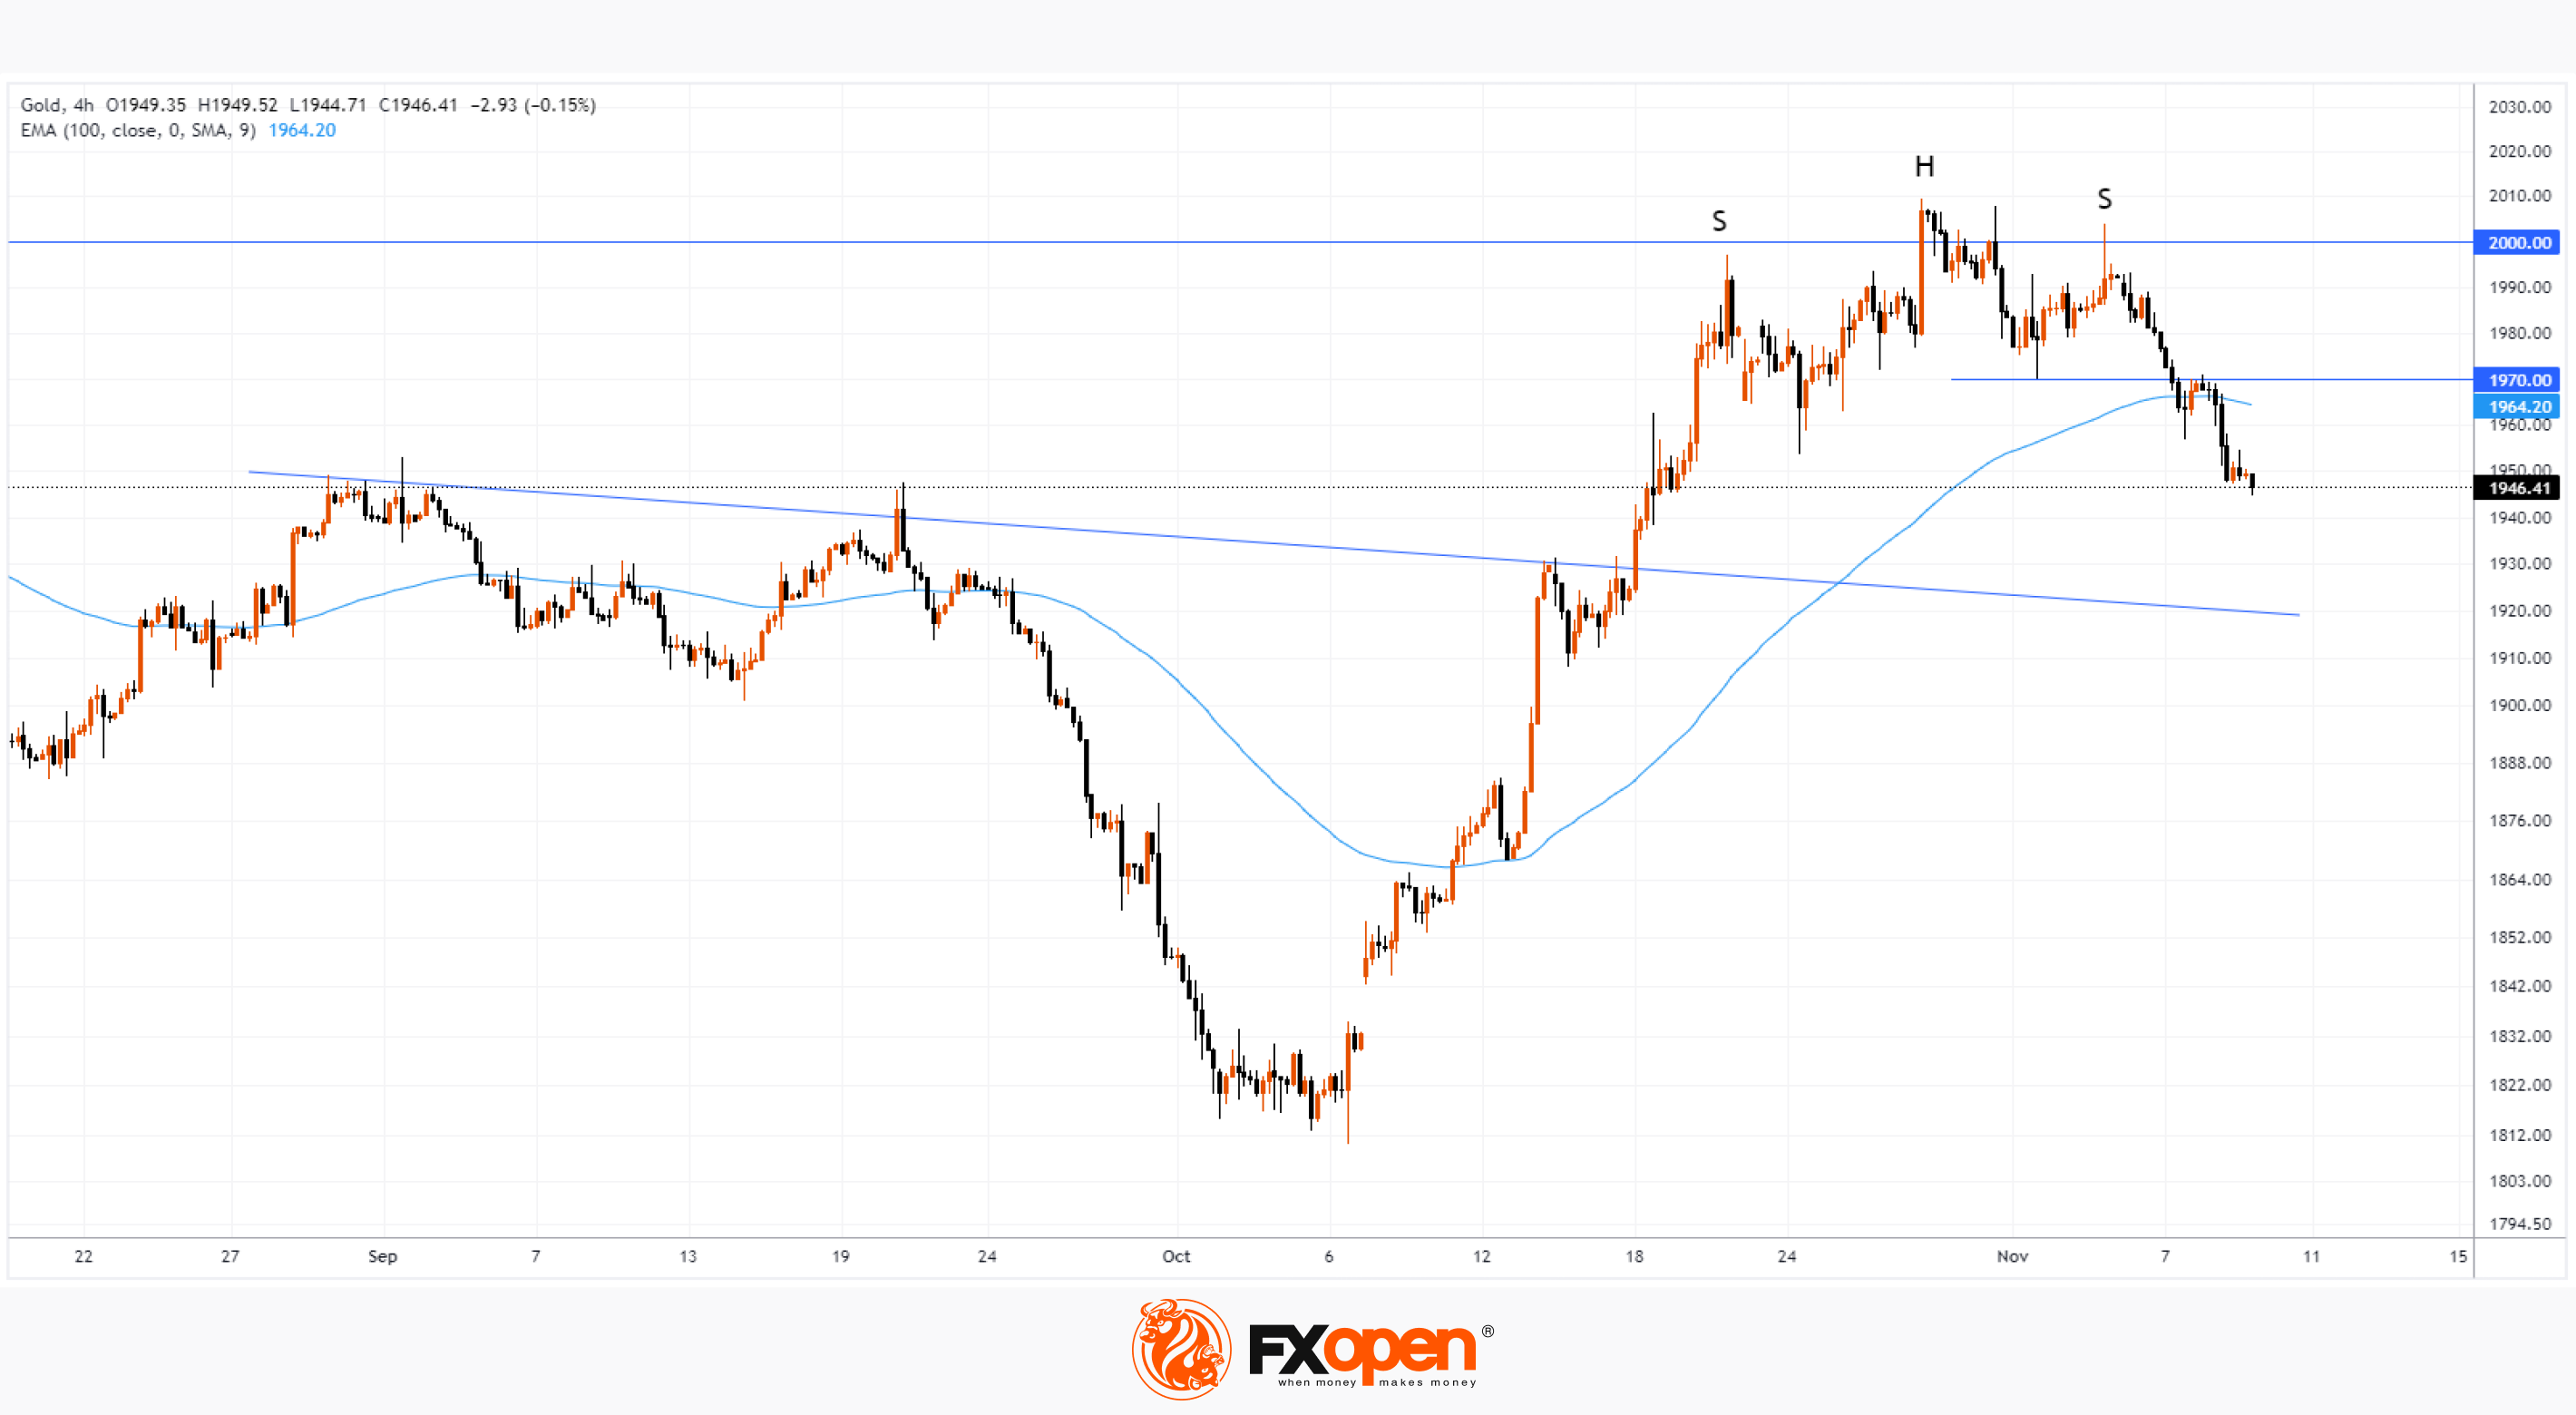
Market Analysis: Price of Gold Drops Below $1,950
This happened for the first time since mid-October, when gold was rapidly rising in price on fears related to the escalation of the military conflict in the Middle East.
At the same time, the psychological level of USD 2,000 per ounce demonstrated its importance.
Notice the volatility spikes around it — the bulls were active in the attacks, noticeable on the 4-hour chart, but all the progress made on the upward impulses was almost immediately canceled out by the bears.
The graph shows:
→ formation of a reversal pattern SHS (head-and-shoulders). With some subjectivity, we can assume that the “neck” level is around USD 1,970. But it has already been broken after a weak rebound;
→ the price dropped below EMA (100).
The price can be supported by a trend line drawn at the highs of August-September. After a bullish breakout, it could serve as market support in the area of USD 1,915 per ounce. In the same area is the 50% Fib level of the upward momentum from the October lows to the peak above USD 2,000. If the price falls to the USD 1,910-1,920 zone, it could serve as a support for the bulls to try to resume the bullish trend, if the news background also contributes to this.
To benefit from trends in the commodity financial markets, consider enlisting the services of a trusted broker like FXOpen.
CFDs are complex instruments and come with a high risk of losing your money.
This article represents the opinion of the Companies operating under the FXOpen brand only. It is not to be construed as an offer, solicitation, or recommendation with respect to products and services provided by the Companies operating under the FXOpen brand, nor is it to be considered financial advice.
Market Analysis: Price of Gold Drops Below $1,950
This happened for the first time since mid-October, when gold was rapidly rising in price on fears related to the escalation of the military conflict in the Middle East.
At the same time, the psychological level of USD 2,000 per ounce demonstrated its importance.
Notice the volatility spikes around it — the bulls were active in the attacks, noticeable on the 4-hour chart, but all the progress made on the upward impulses was almost immediately canceled out by the bears.
The graph shows:
→ formation of a reversal pattern SHS (head-and-shoulders). With some subjectivity, we can assume that the “neck” level is around USD 1,970. But it has already been broken after a weak rebound;
→ the price dropped below EMA (100).
The price can be supported by a trend line drawn at the highs of August-September. After a bullish breakout, it could serve as market support in the area of USD 1,915 per ounce. In the same area is the 50% Fib level of the upward momentum from the October lows to the peak above USD 2,000. If the price falls to the USD 1,910-1,920 zone, it could serve as a support for the bulls to try to resume the bullish trend, if the news background also contributes to this.
To benefit from trends in the commodity financial markets, consider enlisting the services of a trusted broker like FXOpen.
CFDs are complex instruments and come with a high risk of losing your money.
This article represents the opinion of the Companies operating under the FXOpen brand only. It is not to be construed as an offer, solicitation, or recommendation with respect to products and services provided by the Companies operating under the FXOpen brand, nor is it to be considered financial advice.
#marketanalysis #tradingforex #tradingtips
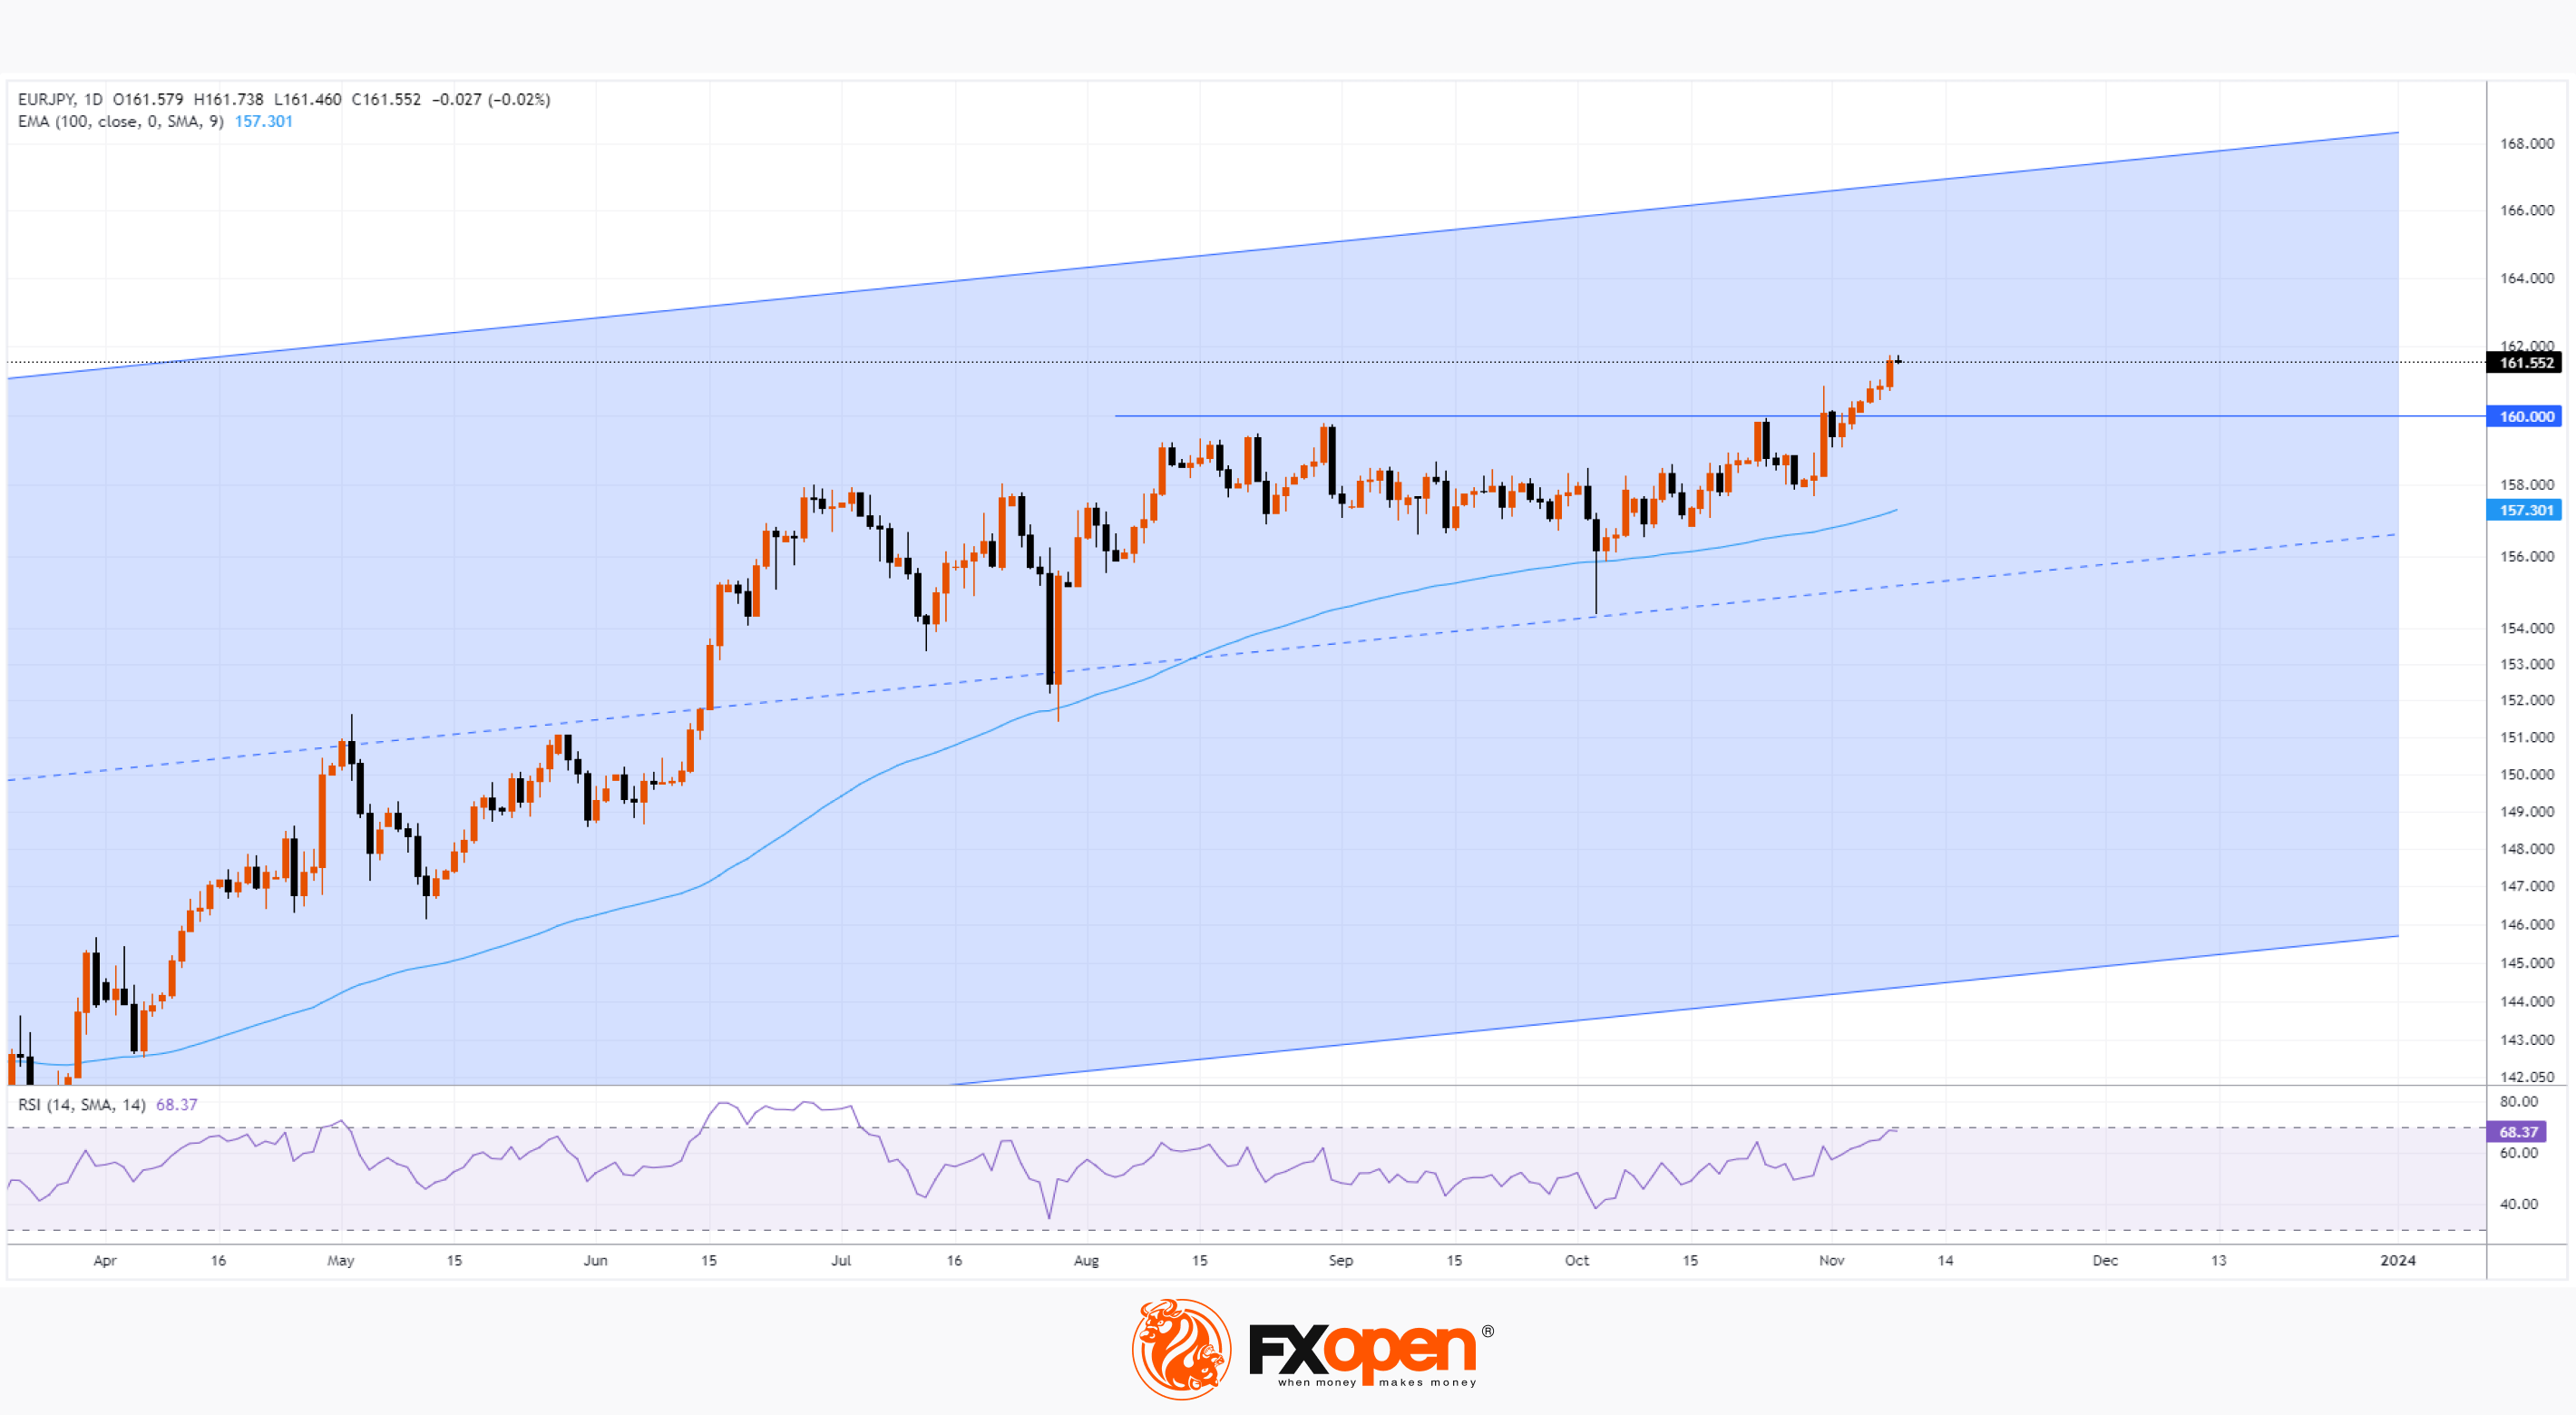
EUR/JPY Analysis: New High of the Year
For the first time since 2008, the rate exceeded the level of 161 yen per euro.
The strength of the euro and the weakness of the yen are contributed to by different policies of central banks.
The European Central Bank's chief economist said on Wednesday that he had not seen enough progress in curbing inflation. This may mean a continuation of the ECB's tight monetary policy and the “expensive euro”. The head of Ireland's central bank said on Wednesday that further interest rate hikes should not be ruled out, while the Bundesbank president said the "last mile" to the inflation target could be the hardest.
At the same time, in Japan, interest rates are effectively negative, making the yen fundamentally weak against the euro. The uptrend channel on the EUR/JPY pair (shown in blue) dates back to 2022. The stability of the trend is also evidenced by the upward-directed MA (100) — the rate is stably above it.
Wherein:
→ the psychological level of 160 yen worked as an important resistance in 2023, but in November the price consolidates higher;
→ yesterday, the bulls broke through the level of 161 yen per euro;
→ The RSI rises into the overbought zone, making the market vulnerable to a pullback.
At the same time, it is acceptable to assume that the yen may strengthen as a result of statements by representatives of the Japanese authorities (former or even current) about changing the monetary policy. As such, signals are increasingly broadcast through the media, 2024 could be the period when the yen situation changes from verbal interventions to real actions (including rate hikes).
Taking into account the above, one should not exclude the scenario of a return to the level of 160 yen per dollar, especially taking into account the fact that this level was not clearly tested after the bullish breakout.
To benefit from currency fluctuations, consider enlisting the services of a trusted broker like FXOpen.
CFDs are complex instruments and come with a high risk of losing your money.
This article represents the opinion of the Companies operating under the FXOpen brand only. It is not to be construed as an offer, solicitation, or recommendation with respect to products and services provided by the Companies operating under the FXOpen brand, nor is it to be considered financial advice.
EUR/JPY Analysis: New High of the Year
For the first time since 2008, the rate exceeded the level of 161 yen per euro.
The strength of the euro and the weakness of the yen are contributed to by different policies of central banks.
The European Central Bank's chief economist said on Wednesday that he had not seen enough progress in curbing inflation. This may mean a continuation of the ECB's tight monetary policy and the “expensive euro”. The head of Ireland's central bank said on Wednesday that further interest rate hikes should not be ruled out, while the Bundesbank president said the "last mile" to the inflation target could be the hardest.
At the same time, in Japan, interest rates are effectively negative, making the yen fundamentally weak against the euro. The uptrend channel on the EUR/JPY pair (shown in blue) dates back to 2022. The stability of the trend is also evidenced by the upward-directed MA (100) — the rate is stably above it.
Wherein:
→ the psychological level of 160 yen worked as an important resistance in 2023, but in November the price consolidates higher;
→ yesterday, the bulls broke through the level of 161 yen per euro;
→ The RSI rises into the overbought zone, making the market vulnerable to a pullback.
At the same time, it is acceptable to assume that the yen may strengthen as a result of statements by representatives of the Japanese authorities (former or even current) about changing the monetary policy. As such, signals are increasingly broadcast through the media, 2024 could be the period when the yen situation changes from verbal interventions to real actions (including rate hikes).
Taking into account the above, one should not exclude the scenario of a return to the level of 160 yen per dollar, especially taking into account the fact that this level was not clearly tested after the bullish breakout.
To benefit from currency fluctuations, consider enlisting the services of a trusted broker like FXOpen.
CFDs are complex instruments and come with a high risk of losing your money.
This article represents the opinion of the Companies operating under the FXOpen brand only. It is not to be construed as an offer, solicitation, or recommendation with respect to products and services provided by the Companies operating under the FXOpen brand, nor is it to be considered financial advice.
#marketanalysis #BTCUSD #bitcoin #crypto
BTC/USD Analysis: New High of the Year
The bitcoin rate exceeded USD 36,500 per coin for the first time in 2023.
This is fueled by pending approval of Bitcoin ETF applications pending before the SEC. According to the latest information, SEC representatives are in contact with the Grayscale fund, one of those who submitted applications. This increased confidence that applications would be approved. Moreover:
→ applications can be approved all together and then several ETFs will start working simultaneously, making it possible that potentially billions of dollars will be directed to the purchase of bitcoins;
→ this can happen before January 10, 2024.
The creation of ETFs will open up new opportunities for a wide range of investors to easily invest in the main cryptocurrency, while reducing the risks associated with opening an account on a crypto exchange, hacked wallets, or sanctions from regulators.
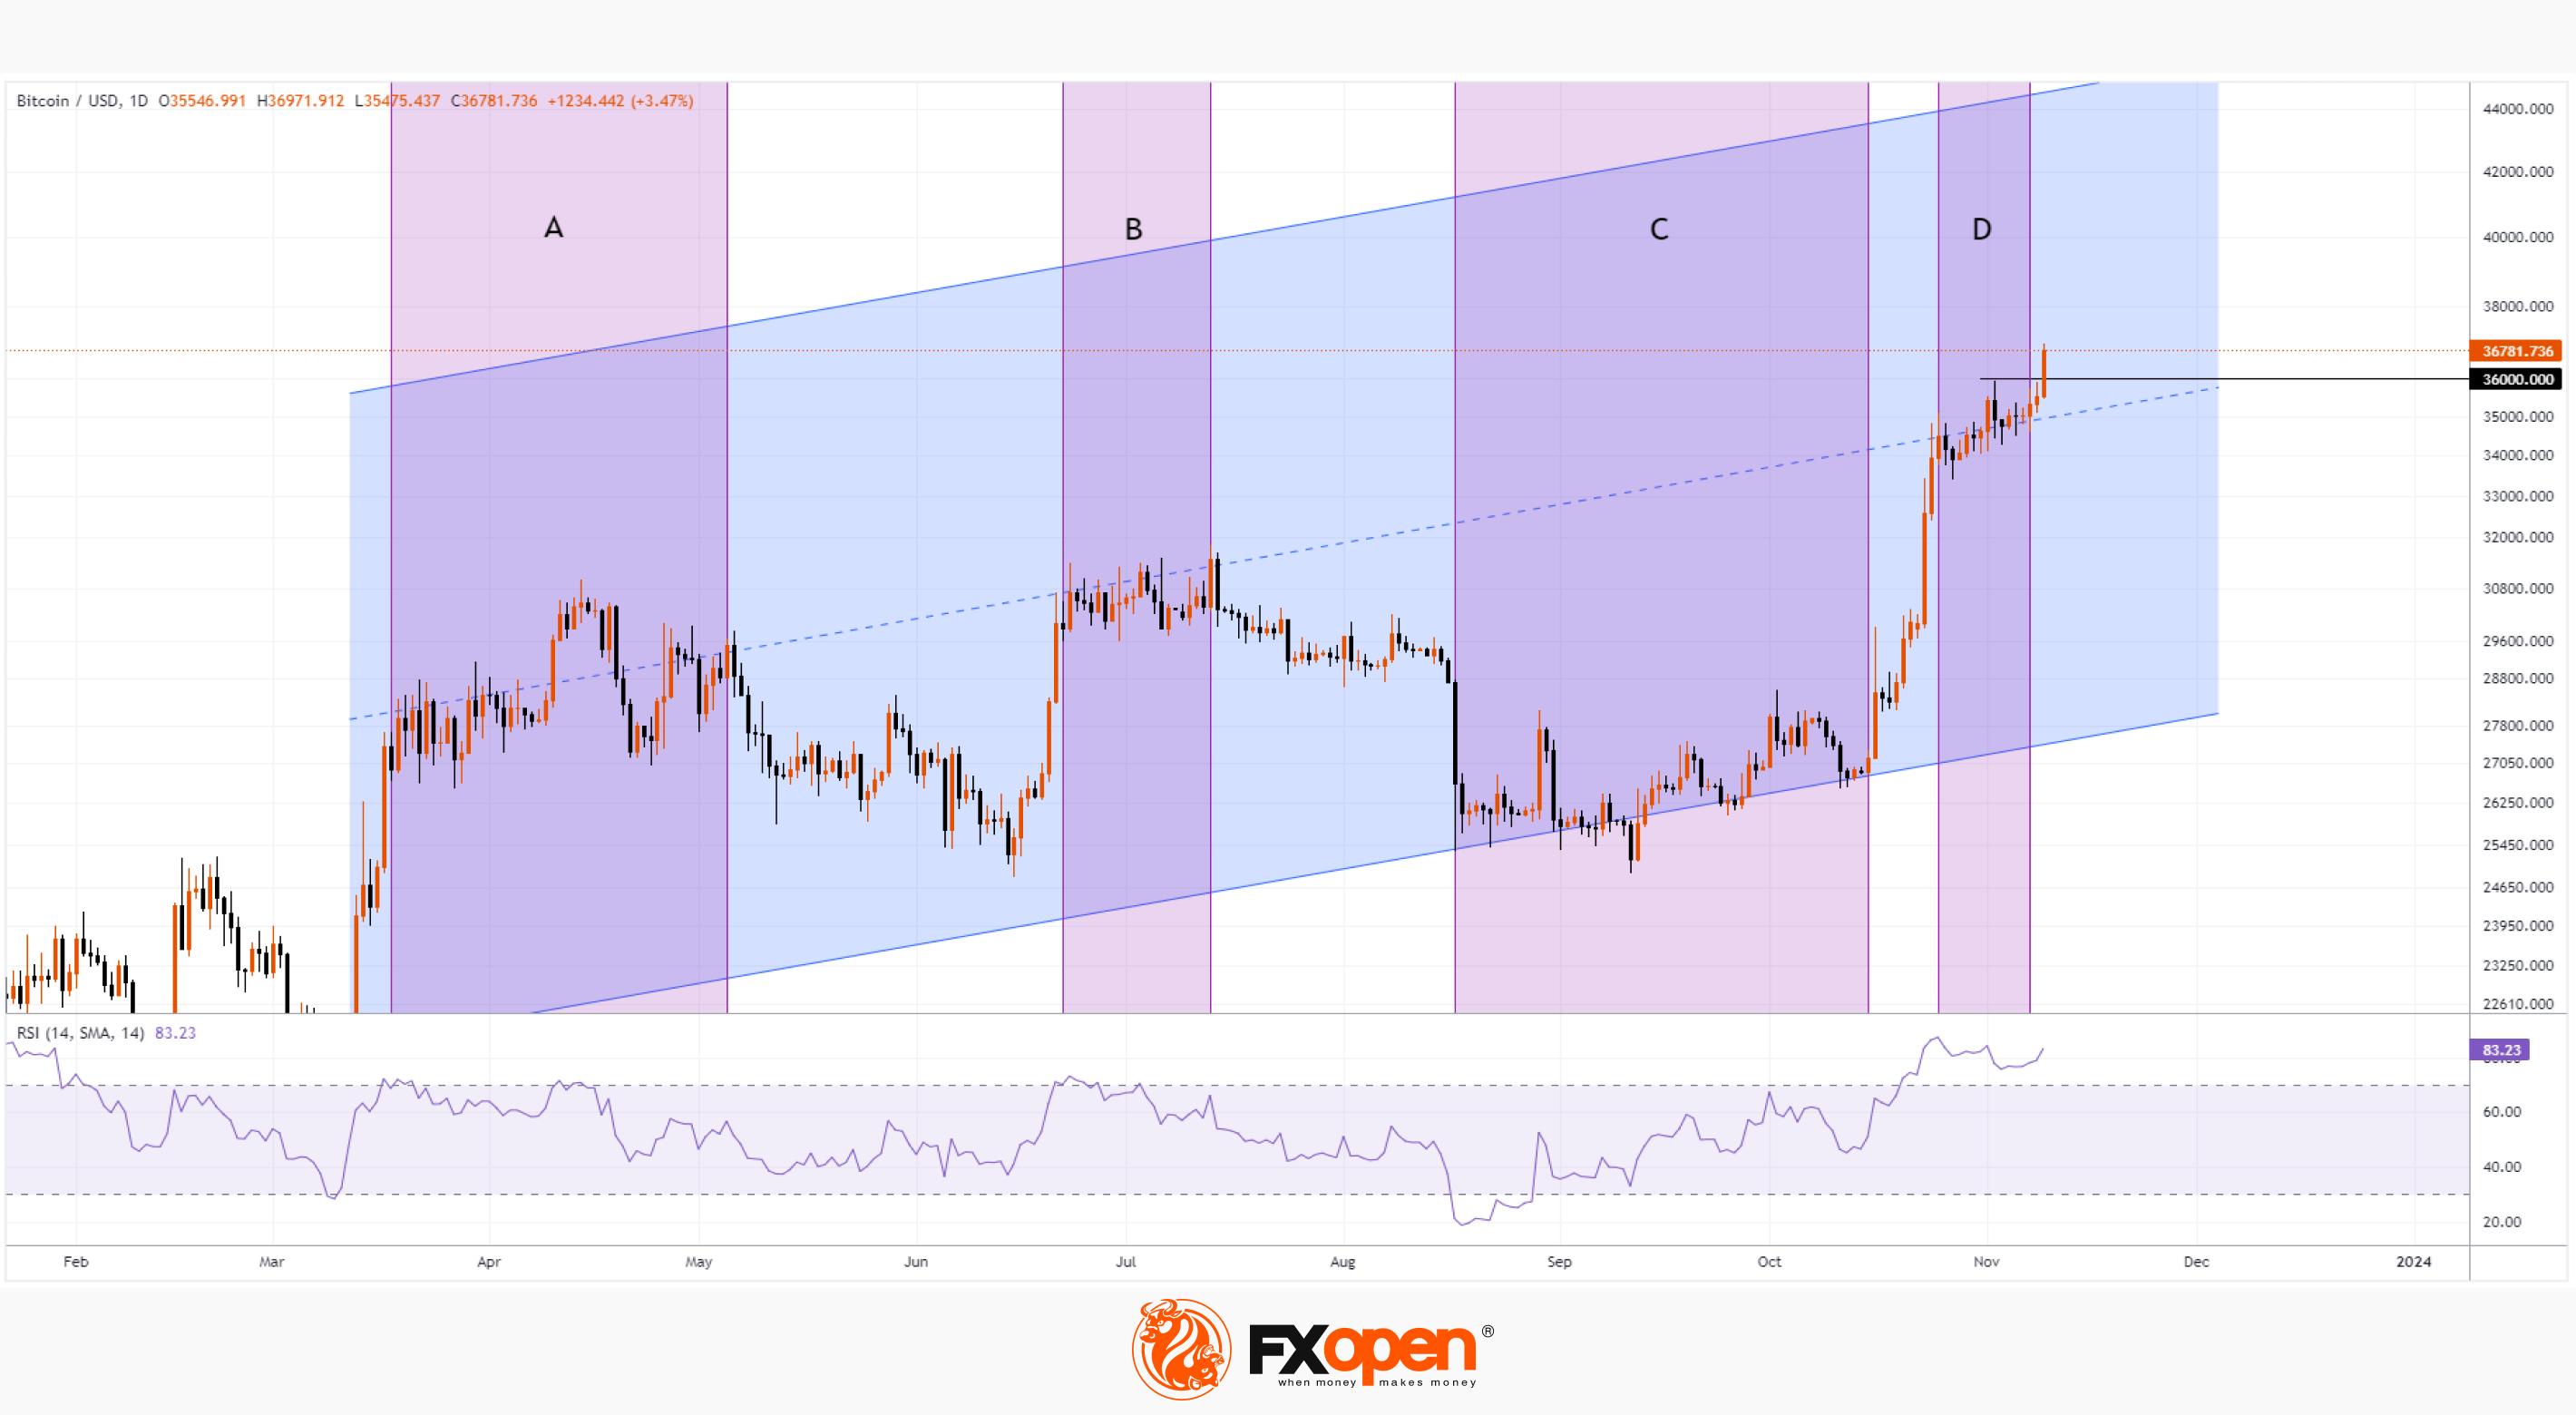
The BTC/USD chart today shows that the price of bitcoin broke through the USD 36,000 level on an expanding candle, indicating the strength of demand.
How far can the bitcoin rate go up?
Let's consider the situation in 2023, taking into account the periods of supply and demand balances that developed in those zones where the canal lines are located.
→ Period A: Buyers and sellers found equilibrium in the spring below USD 30,000.
→ Period B: Another balance near the median line, but above USD 30,000.
→ Period C: Balance near the bottom line with an average price around USD 27,000.
→ Period D: Another balance near the median line, now around USD 35,000.
If news related to the approval of the ETF heats up the market even more, the next balance may develop near the upper border of the channel — that is, around USD 44,000. Has the bitcoin Santa Rally begun?
On the other hand, if the news turns out to be fake or there are negative comments from the SEC, this may cause the price to roll back to the median line.
To benefit from fluctuations in cryptocurrency prices, consider enlisting the services of a trusted broker like FXOpen.
CFDs are complex instruments and come with a high risk of losing your money.
This article represents the opinion of the Companies operating under the FXOpen brand only. It is not to be construed as an offer, solicitation, or recommendation with respect to products and services provided by the Companies operating under the FXOpen brand, nor is it to be considered financial advice.
At FXOpen UK and FXOpen AU, Cryptocurrency CFDs are only available for trading by those clients categorised as Professional clients under FCA Rules and Professional clients under ASIC Rules, respectively. They are not available for trading by Retail clients.
BTC/USD Analysis: New High of the Year
The bitcoin rate exceeded USD 36,500 per coin for the first time in 2023.
This is fueled by pending approval of Bitcoin ETF applications pending before the SEC. According to the latest information, SEC representatives are in contact with the Grayscale fund, one of those who submitted applications. This increased confidence that applications would be approved. Moreover:
→ applications can be approved all together and then several ETFs will start working simultaneously, making it possible that potentially billions of dollars will be directed to the purchase of bitcoins;
→ this can happen before January 10, 2024.
The creation of ETFs will open up new opportunities for a wide range of investors to easily invest in the main cryptocurrency, while reducing the risks associated with opening an account on a crypto exchange, hacked wallets, or sanctions from regulators.
The BTC/USD chart today shows that the price of bitcoin broke through the USD 36,000 level on an expanding candle, indicating the strength of demand.
How far can the bitcoin rate go up?
Let's consider the situation in 2023, taking into account the periods of supply and demand balances that developed in those zones where the canal lines are located.
→ Period A: Buyers and sellers found equilibrium in the spring below USD 30,000.
→ Period B: Another balance near the median line, but above USD 30,000.
→ Period C: Balance near the bottom line with an average price around USD 27,000.
→ Period D: Another balance near the median line, now around USD 35,000.
If news related to the approval of the ETF heats up the market even more, the next balance may develop near the upper border of the channel — that is, around USD 44,000. Has the bitcoin Santa Rally begun?
On the other hand, if the news turns out to be fake or there are negative comments from the SEC, this may cause the price to roll back to the median line.
To benefit from fluctuations in cryptocurrency prices, consider enlisting the services of a trusted broker like FXOpen.
CFDs are complex instruments and come with a high risk of losing your money.
This article represents the opinion of the Companies operating under the FXOpen brand only. It is not to be construed as an offer, solicitation, or recommendation with respect to products and services provided by the Companies operating under the FXOpen brand, nor is it to be considered financial advice.
At FXOpen UK and FXOpen AU, Cryptocurrency CFDs are only available for trading by those clients categorised as Professional clients under FCA Rules and Professional clients under ASIC Rules, respectively. They are not available for trading by Retail clients.
#marketanalysis #ETH #crypto
Market Analysis: ETH/USD Growing Rapidly on News from BlackRock
As it became known, BlackRock has filed an application with the SEC for an ETF based on spot Ethereum. Information about the iShares Ethereum Trust appeared on the Nasdaq website.
If such an expression is acceptable, the price of the second cryptocurrency has gone in pursuit of bitcoin, which is rewriting the highs of the year amid expectations associated with the approval of applications for ETFs for spot bitcoin — approval from the SEC already seems inevitable.
In just 10 hours after the news was published, the price of ETH/USD increased by more than 10%. The excitement is fueled by speculation that other Wall Street giants may file bids after BlackRock.
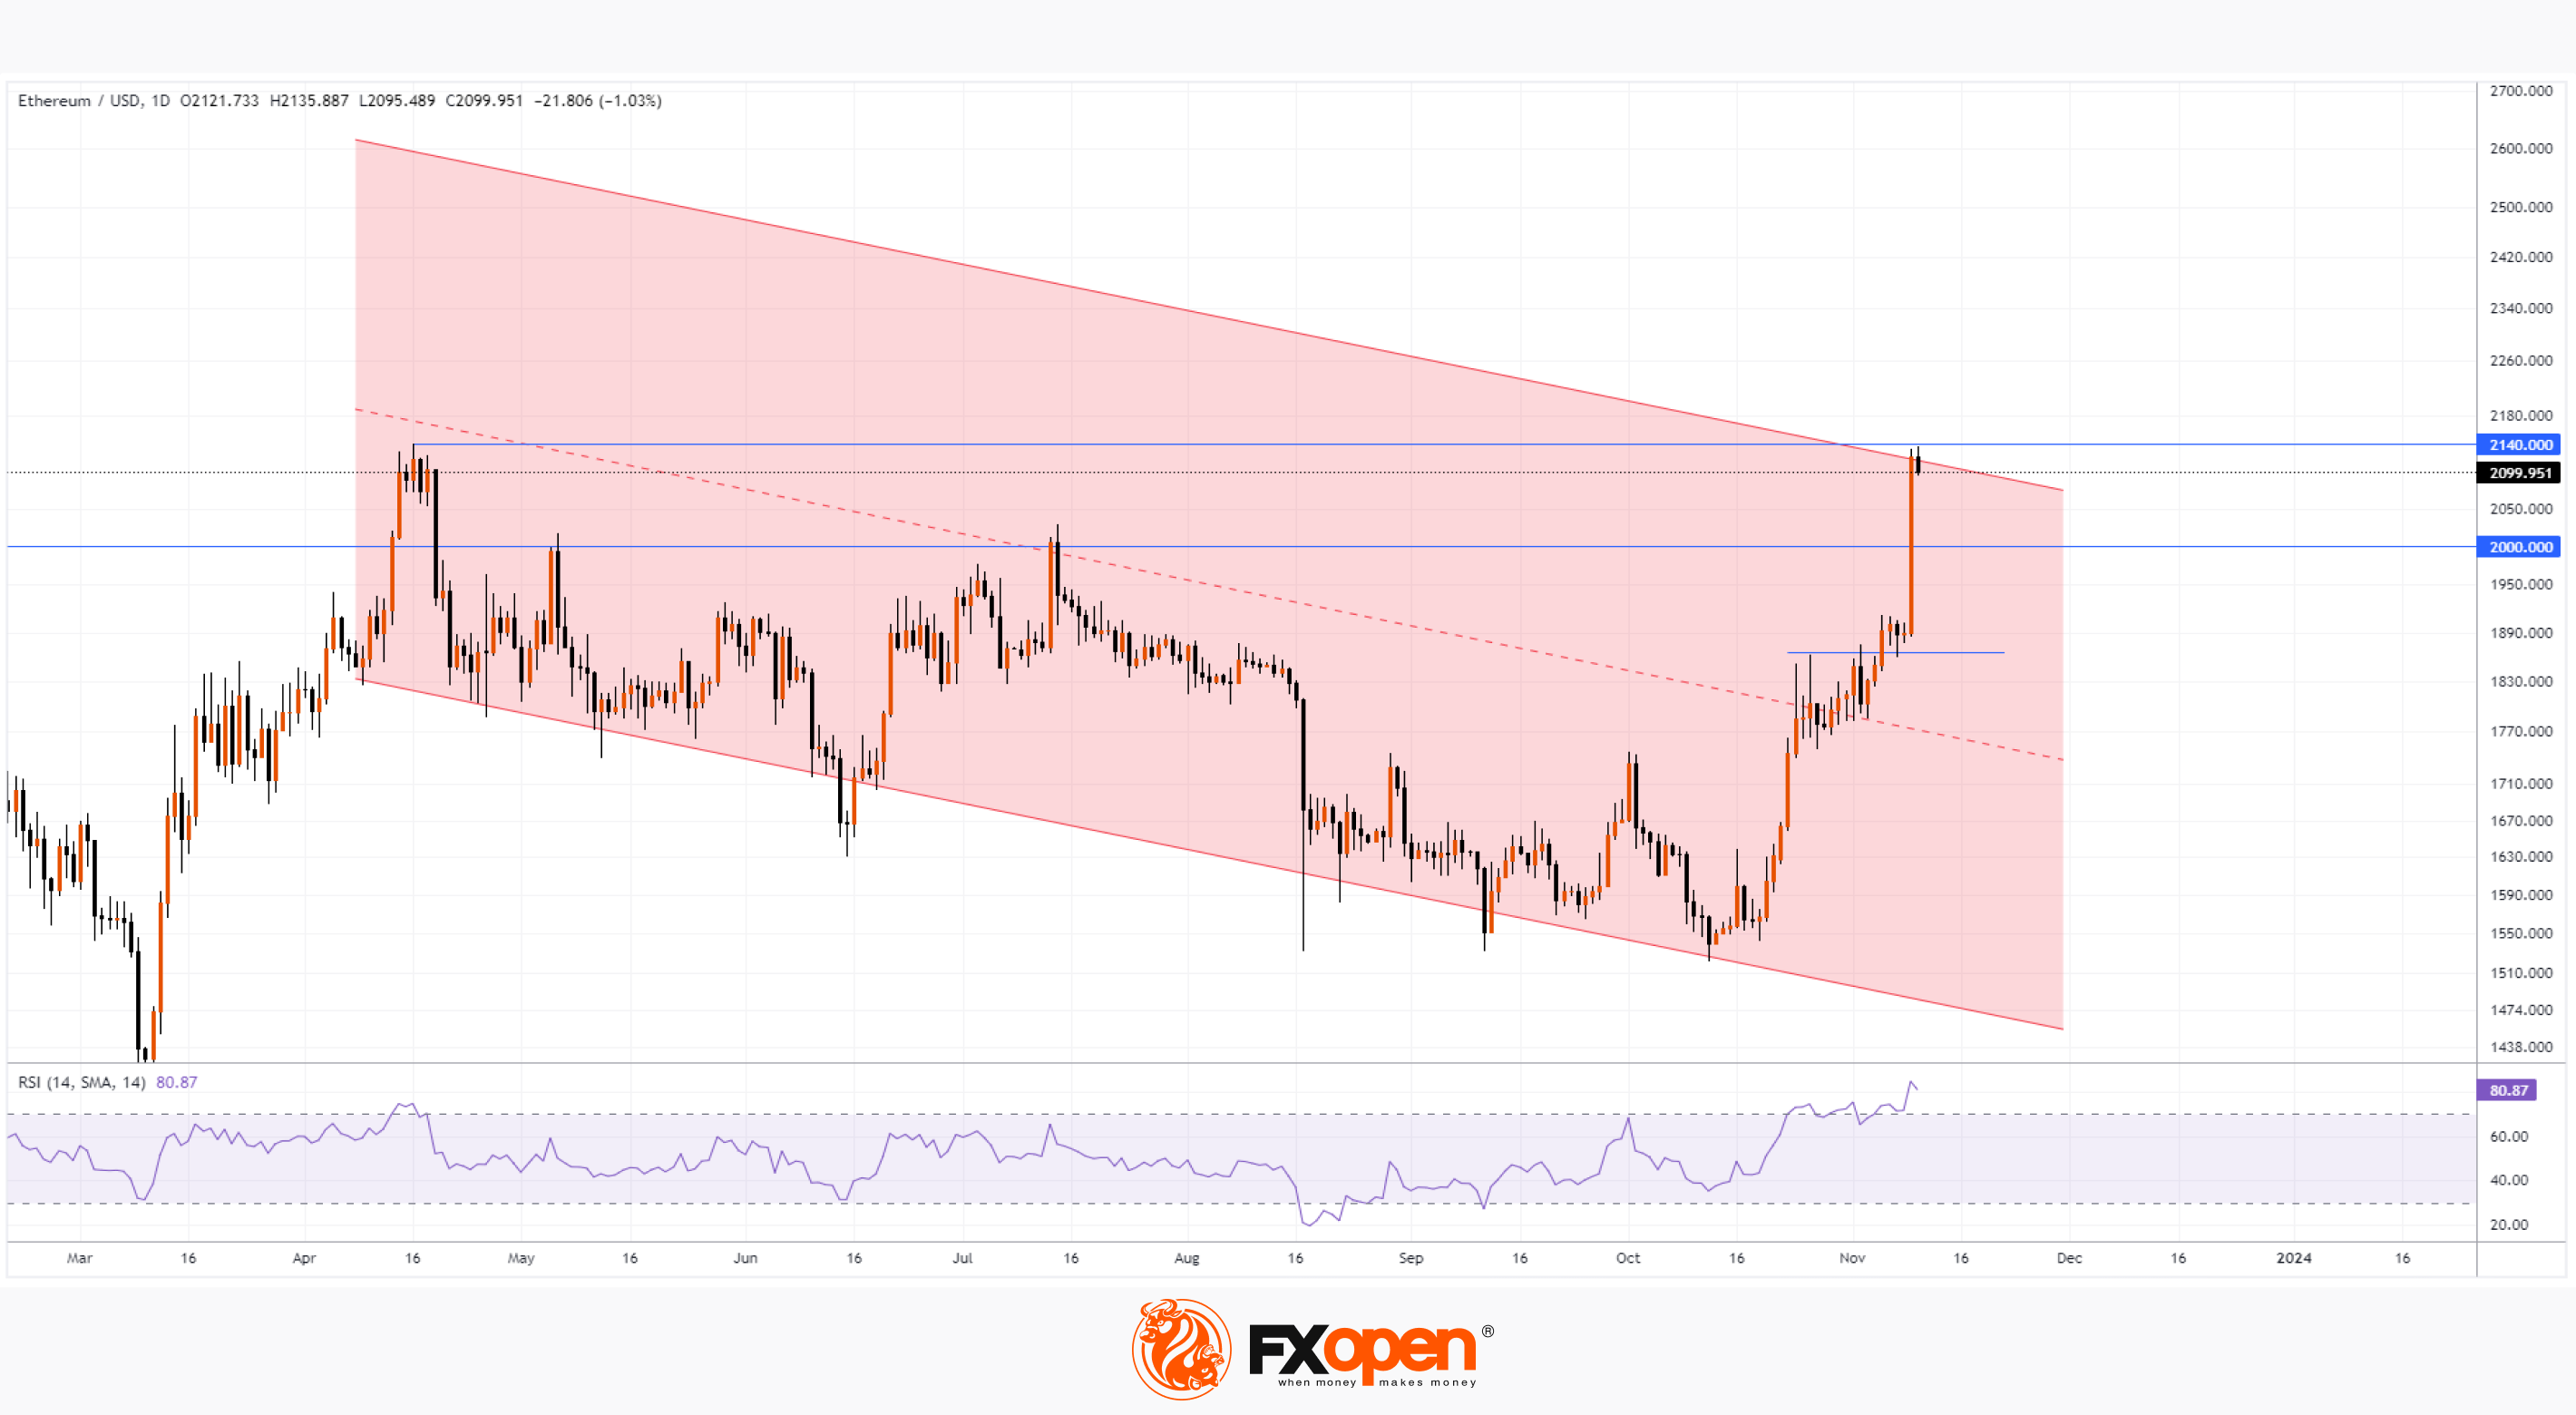
The ETH/USD chart shows that:
→ the price of Ethereum came close to the year’s high at 2140, set in April;
→ RSI indicates that the market is extremely overbought, which means it is vulnerable to a pullback.
The likelihood of a rollback is increased by the fact that the price of ETH/USD has slowed down its growth near the resistance block, which is formed by:
→ the upper limit of the parallel downward channel;
→ resistance from the high of the year.
It is possible that a pullback could occur after the formation of a double or triple top pattern on the hourly charts with a false breakout of the year's high, which would lure more buyers into the market, thereby making the correction more reasonable. Fundamentally though, the backdrop will remain strong as potential application approvals will make it possible for a wide range of investors to easily invest in Ethereum, increasing demand for this crypto asset.
To benefit from cryptocurrency trends, consider enlisting the services of a trusted broker like FXOpen.
CFDs are complex instruments and come with a high risk of losing your money.
This article represents the opinion of the Companies operating under the FXOpen brand only. It is not to be construed as an offer, solicitation, or recommendation with respect to products and services provided by the Companies operating under the FXOpen brand, nor is it to be considered financial advice.
At FXOpen UK and FXOpen AU, Cryptocurrency CFDs are only available for trading by those clients categorised as Professional clients under FCA Rules and Professional clients under ASIC Rules, respectively. They are not available for trading by Retail clients.
Market Analysis: ETH/USD Growing Rapidly on News from BlackRock
As it became known, BlackRock has filed an application with the SEC for an ETF based on spot Ethereum. Information about the iShares Ethereum Trust appeared on the Nasdaq website.
If such an expression is acceptable, the price of the second cryptocurrency has gone in pursuit of bitcoin, which is rewriting the highs of the year amid expectations associated with the approval of applications for ETFs for spot bitcoin — approval from the SEC already seems inevitable.
In just 10 hours after the news was published, the price of ETH/USD increased by more than 10%. The excitement is fueled by speculation that other Wall Street giants may file bids after BlackRock.
The ETH/USD chart shows that:
→ the price of Ethereum came close to the year’s high at 2140, set in April;
→ RSI indicates that the market is extremely overbought, which means it is vulnerable to a pullback.
The likelihood of a rollback is increased by the fact that the price of ETH/USD has slowed down its growth near the resistance block, which is formed by:
→ the upper limit of the parallel downward channel;
→ resistance from the high of the year.
It is possible that a pullback could occur after the formation of a double or triple top pattern on the hourly charts with a false breakout of the year's high, which would lure more buyers into the market, thereby making the correction more reasonable. Fundamentally though, the backdrop will remain strong as potential application approvals will make it possible for a wide range of investors to easily invest in Ethereum, increasing demand for this crypto asset.
To benefit from cryptocurrency trends, consider enlisting the services of a trusted broker like FXOpen.
CFDs are complex instruments and come with a high risk of losing your money.
This article represents the opinion of the Companies operating under the FXOpen brand only. It is not to be construed as an offer, solicitation, or recommendation with respect to products and services provided by the Companies operating under the FXOpen brand, nor is it to be considered financial advice.
At FXOpen UK and FXOpen AU, Cryptocurrency CFDs are only available for trading by those clients categorised as Professional clients under FCA Rules and Professional clients under ASIC Rules, respectively. They are not available for trading by Retail clients.
#marketanalysis #stockmarket #stocktrading
NVDA Analysis: Share Price Reaches 2-month High on News of New Chips
Less than a month ago, US officials tightened rules on sales of high-end artificial intelligence chips to China. And yesterday, from the SemiAnalysis newsletter, it became known that Nvidia has developed new chips called HGX H20, L20 PCIe and L2 PCIe, which are not subject, in whole or in part, to existing export restrictions to China.
The news about the new chips gave bullish momentum to the Nvidia stock market.
The NVDA stock price chart shows that:
→ the price crossed the peak on October 12 (this is peak D, the formation of which we assumed in the analysis of the NVDA stock price on September 14);
→ NVDA share price shows bullish dynamics after a false breakout of the psychological level of USD 400 per share at the end of October;
→ the price dropped at the end of yesterday's trading day, forming a potential false breakout of the October peak. It seems that the bears have become more active, trapping overly optimistic buyers. The 4-hour chart shows a bearish engulfing pattern.
Note that the market was extremely volatile at the end of August, as evidenced by the ATR indicator. In this active market, large participants had enough counter liquidity to cover long positions (take short positions). And now, with the price rising to the levels of this important August range, the bulls may exhaust their confidence. To overcome it, strong drivers are needed, which can happen during the publication of the company's report for the 3rd quarter — it is scheduled for November 21.
To benefit from trends in the stock markets of popular companies around the world, consider enlisting the services of a trusted broker like FXOpen.
CFDs are complex instruments and come with a high risk of losing your money.
This article represents the opinion of the Companies operating under the FXOpen brand only. It is not to be construed as an offer, solicitation, or recommendation with respect to products and services provided by the Companies operating under the FXOpen brand, nor is it to be considered financial advice.
NVDA Analysis: Share Price Reaches 2-month High on News of New Chips
Less than a month ago, US officials tightened rules on sales of high-end artificial intelligence chips to China. And yesterday, from the SemiAnalysis newsletter, it became known that Nvidia has developed new chips called HGX H20, L20 PCIe and L2 PCIe, which are not subject, in whole or in part, to existing export restrictions to China.
The news about the new chips gave bullish momentum to the Nvidia stock market.
The NVDA stock price chart shows that:
→ the price crossed the peak on October 12 (this is peak D, the formation of which we assumed in the analysis of the NVDA stock price on September 14);
→ NVDA share price shows bullish dynamics after a false breakout of the psychological level of USD 400 per share at the end of October;
→ the price dropped at the end of yesterday's trading day, forming a potential false breakout of the October peak. It seems that the bears have become more active, trapping overly optimistic buyers. The 4-hour chart shows a bearish engulfing pattern.
Note that the market was extremely volatile at the end of August, as evidenced by the ATR indicator. In this active market, large participants had enough counter liquidity to cover long positions (take short positions). And now, with the price rising to the levels of this important August range, the bulls may exhaust their confidence. To overcome it, strong drivers are needed, which can happen during the publication of the company's report for the 3rd quarter — it is scheduled for November 21.
To benefit from trends in the stock markets of popular companies around the world, consider enlisting the services of a trusted broker like FXOpen.
CFDs are complex instruments and come with a high risk of losing your money.
This article represents the opinion of the Companies operating under the FXOpen brand only. It is not to be construed as an offer, solicitation, or recommendation with respect to products and services provided by the Companies operating under the FXOpen brand, nor is it to be considered financial advice.
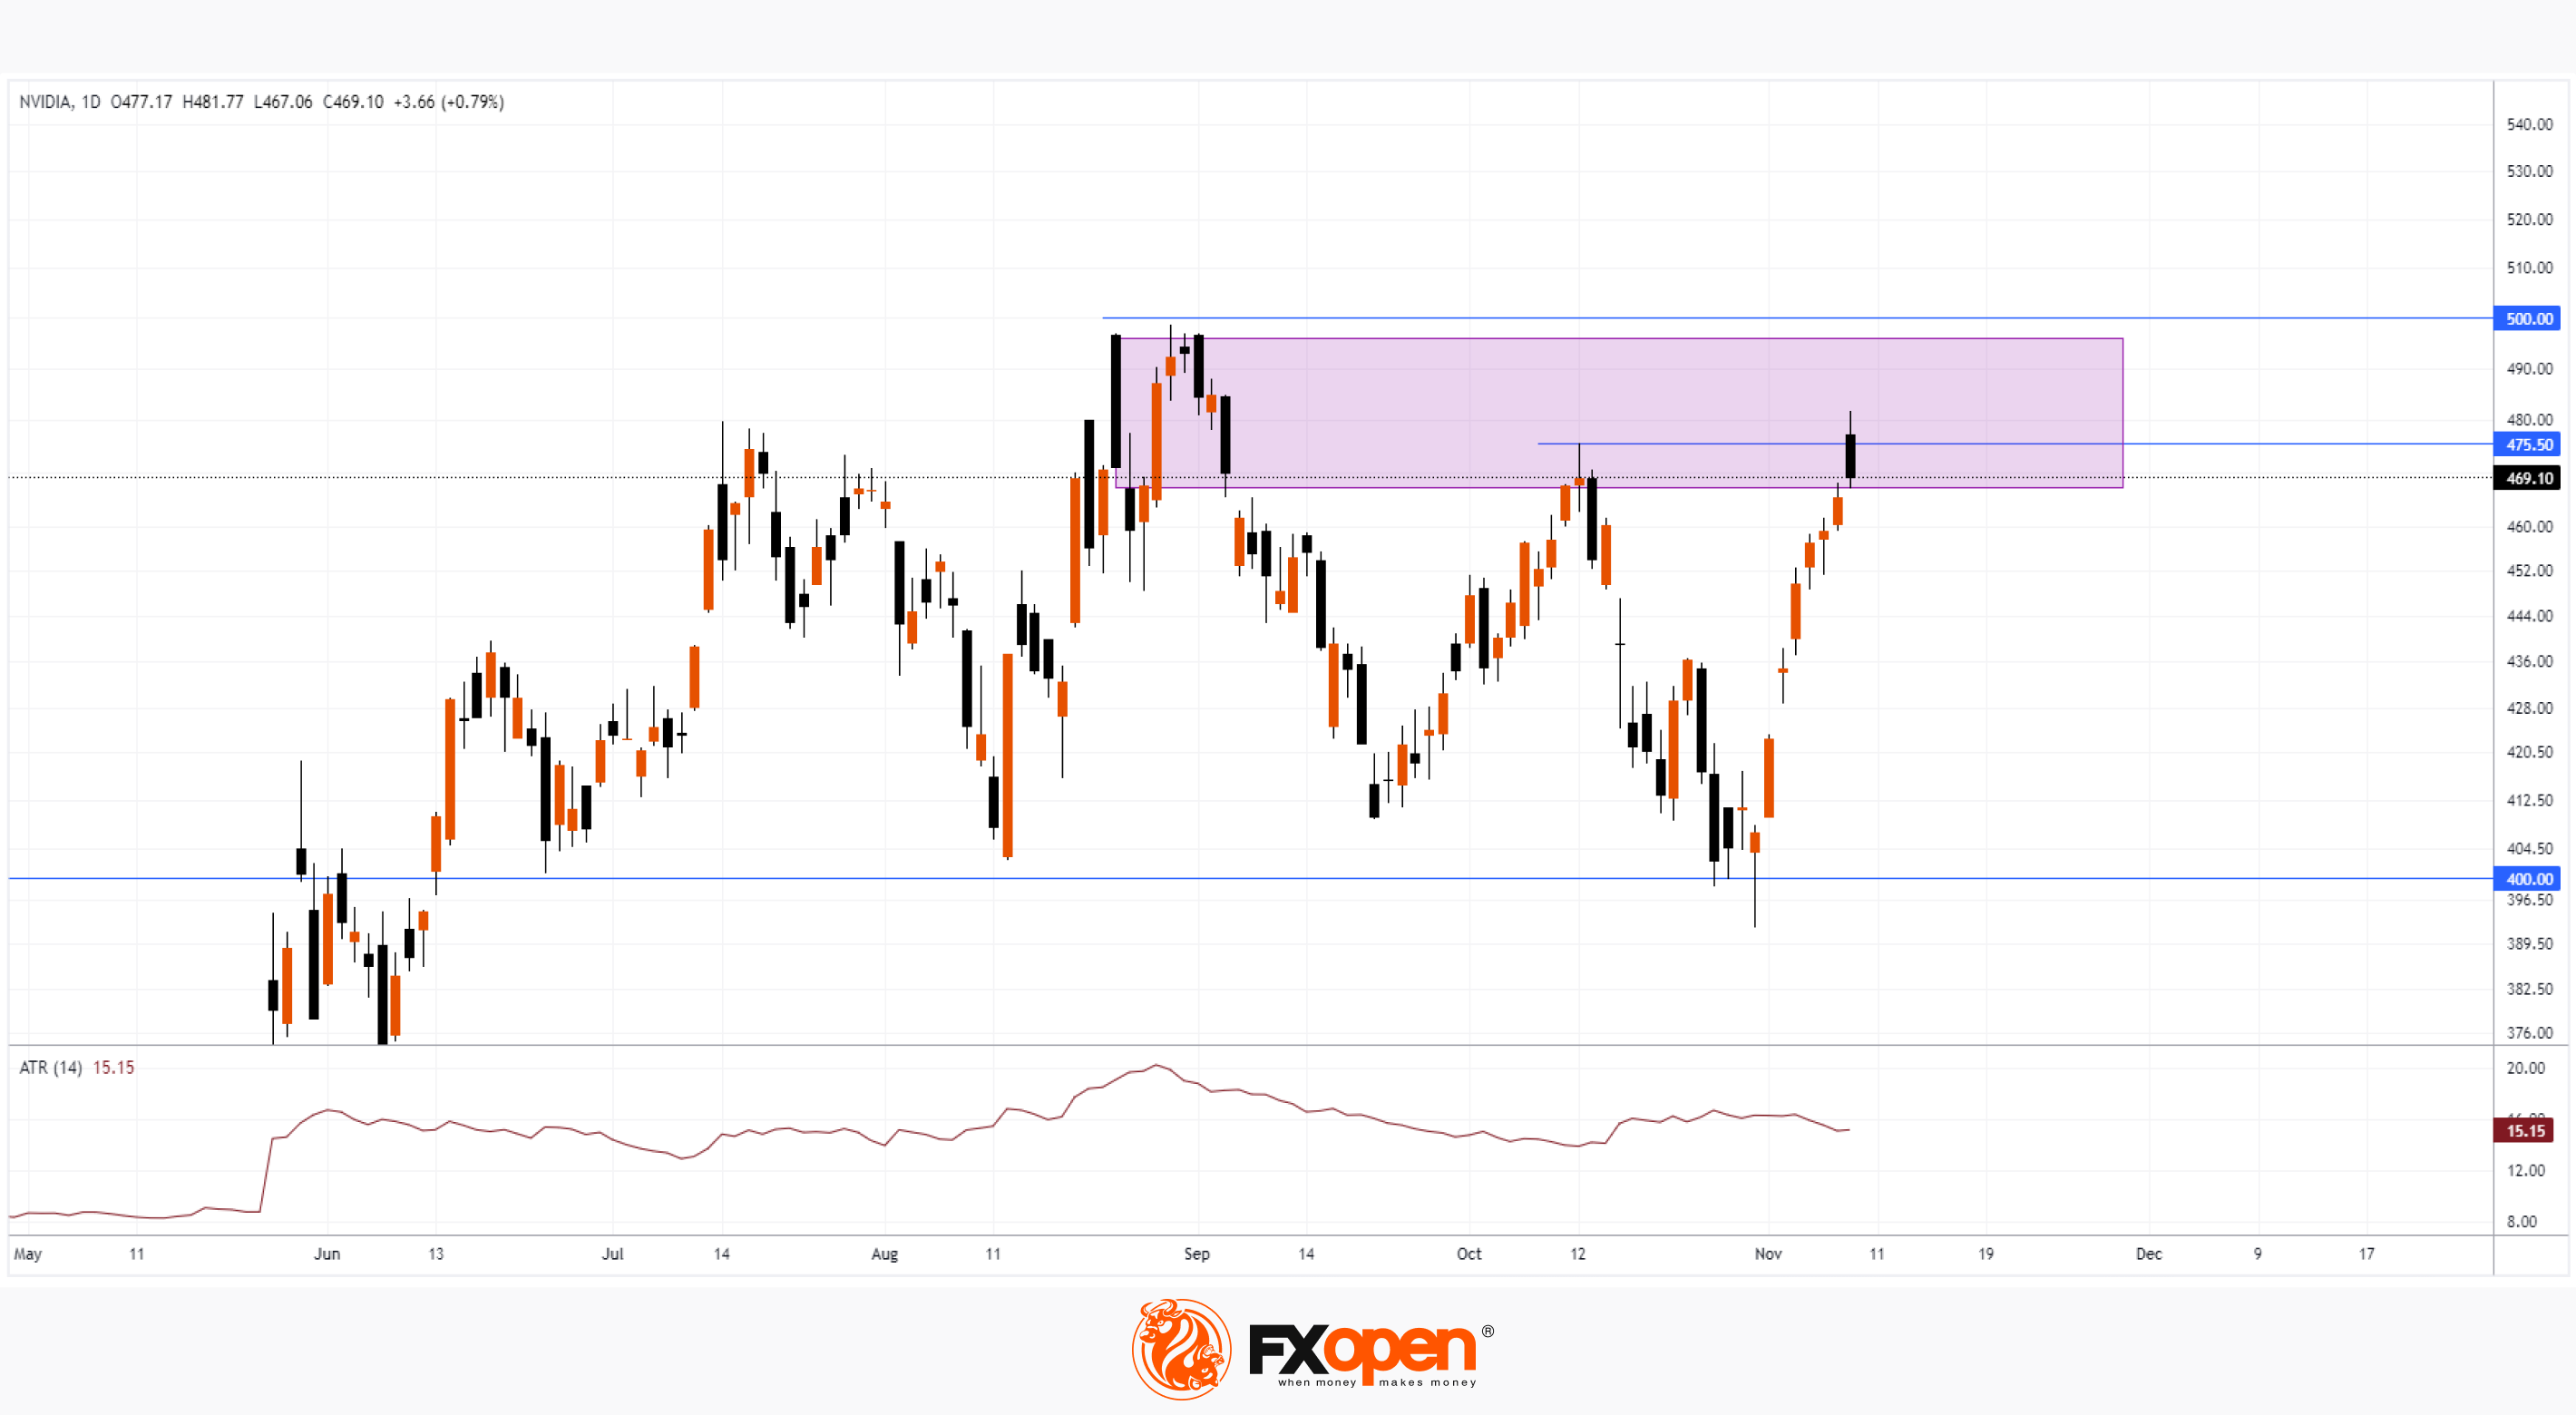
#goldprice #stockmarket #sp500 #oilprices #xauusd
Weekly Market Wrap With Gary Thomson: OIL FALLS, S&P500’s BEST WEEK, GOLD DROPS, EUR/JPY: NEW HIGH
Get the latest scoop on the week's hottest headlines, all in one convenient video. Join Gary Thomson, the COO of FXOpen UK, as he breaks down the most significant news reports and shares his expert insights.
🔸 Oil Prices Fall to Lowest Level since July
🔸 S&P 500: Best Week of the Year, Despite Bad News from Labour Market
🔸 Price of Gold Drops Below $1,950
🔸 EUR/JPY: New High of the Year
Don't miss out on this invaluable opportunity to sharpen your trading skills and make informed decisions.
https://cutt.ly/KwT957q4
To take advantage of price fluctuations in the foreign exchange markets, consider enlisting the services of a reliable broker like FXOpen.
⚠️
This forecast represents FXOpen Companies opinion only, it should not be construed as an offer, invitation or recommendation in respect to FXOpen Companies products and services or as financial advice
At FXOpen UK and FXOpen AU, Cryptocurrency CFDs are only available for trading by those clients categorised as Professional clients under FCA Rules and Professional clients under ASIC Rules respectively. They are not available for trading by Retail clients.
Weekly Market Wrap With Gary Thomson: OIL FALLS, S&P500’s BEST WEEK, GOLD DROPS, EUR/JPY: NEW HIGH
Get the latest scoop on the week's hottest headlines, all in one convenient video. Join Gary Thomson, the COO of FXOpen UK, as he breaks down the most significant news reports and shares his expert insights.
🔸 Oil Prices Fall to Lowest Level since July
🔸 S&P 500: Best Week of the Year, Despite Bad News from Labour Market
🔸 Price of Gold Drops Below $1,950
🔸 EUR/JPY: New High of the Year
Don't miss out on this invaluable opportunity to sharpen your trading skills and make informed decisions.
https://cutt.ly/KwT957q4
To take advantage of price fluctuations in the foreign exchange markets, consider enlisting the services of a reliable broker like FXOpen.
⚠️
This forecast represents FXOpen Companies opinion only, it should not be construed as an offer, invitation or recommendation in respect to FXOpen Companies products and services or as financial advice
At FXOpen UK and FXOpen AU, Cryptocurrency CFDs are only available for trading by those clients categorised as Professional clients under FCA Rules and Professional clients under ASIC Rules respectively. They are not available for trading by Retail clients.
YouTube
Weekly Market Wrap With Gary Thomson: OIL FALLS, S&P500’s BEST WEEK, GOLD DROPS, EUR/JPY: NEW HIGH
Get the latest scoop on the week's hottest headlines, all in one convenient video. Join Gary Thomson, the COO of FXOpen UK, as he breaks down the most significant news reports and shares his expert insights.
- Oil Prices Fall to Lowest Level since July #Oil…
- Oil Prices Fall to Lowest Level since July #Oil…
#marketanalysis #MarketNews #forextrading
EUR/GBP Analysis: Price Reaches 6-month High
In the fall of 2023, bullish sentiment developed in the EUR/GBP market: since September 1, the rate has risen by more than 2%, price dynamics have formed an ascending channel (shown in blue). Moreover, on Friday, the price reached its highest in approximately 6 months.
Growth drivers, among other things, are news related to the policies of the Bank of England and the ECB aimed at combating high inflation, and what signals the economy gives in such conditions.
The latest news about UK GDP turned out to be better than expected (actual = +0.2% for the 3rd quarter, expectations = +0.1%), but the pound sterling did not show a positive reaction, for two reasons from a fundamental point of view:
→ Firstly, the details show that a significant contribution to GDP growth came from imports, a category that tends to be quite volatile between quarters. Other key areas — notably consumption and business investment — posted negative results in the quarter.
→ Secondly, GDP may decline due to the fact that the high rate policy pursued by the Bank of England should be more fully felt in the coming 2024.
If the pound didn't strengthen on Friday on the GDP news, could the bullish trend continue?
An important factor to note here from a technical analysis point of view is that the EUR/GBP price is near the key resistance of 0.8735. In the past, the level acted as support, holding its course in the first 4 months of the year. Now the level can act as resistance.
→ Divergence on the RSI indicator shows that the bullish momentum is weakening.
→ Resistance from the upper border of the ascending channel has not yet been broken.
These factors indicate that the EUR/GBP rate may be vulnerable to a pullback within the ascending channel.
To benefit from trends in the foreign exchange markets, consider enlisting the services of a trusted broker like FXOpen.
CFDs are complex instruments and come with a high risk of losing your money.
This article represents the opinion of the Companies operating under the FXOpen brand only. It is not to be construed as an offer, solicitation, or recommendation with respect to products and services provided by the Companies operating under the FXOpen brand, nor is it to be considered financial advice.
EUR/GBP Analysis: Price Reaches 6-month High
In the fall of 2023, bullish sentiment developed in the EUR/GBP market: since September 1, the rate has risen by more than 2%, price dynamics have formed an ascending channel (shown in blue). Moreover, on Friday, the price reached its highest in approximately 6 months.
Growth drivers, among other things, are news related to the policies of the Bank of England and the ECB aimed at combating high inflation, and what signals the economy gives in such conditions.
The latest news about UK GDP turned out to be better than expected (actual = +0.2% for the 3rd quarter, expectations = +0.1%), but the pound sterling did not show a positive reaction, for two reasons from a fundamental point of view:
→ Firstly, the details show that a significant contribution to GDP growth came from imports, a category that tends to be quite volatile between quarters. Other key areas — notably consumption and business investment — posted negative results in the quarter.
→ Secondly, GDP may decline due to the fact that the high rate policy pursued by the Bank of England should be more fully felt in the coming 2024.
If the pound didn't strengthen on Friday on the GDP news, could the bullish trend continue?
An important factor to note here from a technical analysis point of view is that the EUR/GBP price is near the key resistance of 0.8735. In the past, the level acted as support, holding its course in the first 4 months of the year. Now the level can act as resistance.
→ Divergence on the RSI indicator shows that the bullish momentum is weakening.
→ Resistance from the upper border of the ascending channel has not yet been broken.
These factors indicate that the EUR/GBP rate may be vulnerable to a pullback within the ascending channel.
To benefit from trends in the foreign exchange markets, consider enlisting the services of a trusted broker like FXOpen.
CFDs are complex instruments and come with a high risk of losing your money.
This article represents the opinion of the Companies operating under the FXOpen brand only. It is not to be construed as an offer, solicitation, or recommendation with respect to products and services provided by the Companies operating under the FXOpen brand, nor is it to be considered financial advice.