
#MarketNews
E-mini Nasdaq 100 Futures Hit Year's High
It happened on Friday. However, the last day of last week closed lower after the news report about consumer sentiment in the US falling to a six-month low.
Also on Friday, the Congressional Budget Office warned that the United States faced a "significant risk" of default on its payment obligations during the first two weeks of June unless the national debt ceiling was raised.
The second round of debt ceiling talks between the White House and Congressional leaders is scheduled for Tuesday, President Biden said Sunday. He added that there is no turning point in the negotiations yet, but real discussions are underway, because, naturally, the US is not interested in its own default.
On Monday, the price of E-mini Nasdaq 100 futures is rising again; it is possible that another update will take place this week. E-mini Nasdaq 100 futures are stronger than E-mini S&P 500 futures because:
→ the Nasdaq 100 index does not include shares of large banks that are under pressure due to the banking crisis;
→ the results of the leading companies for the Q1 did not disappoint investors.
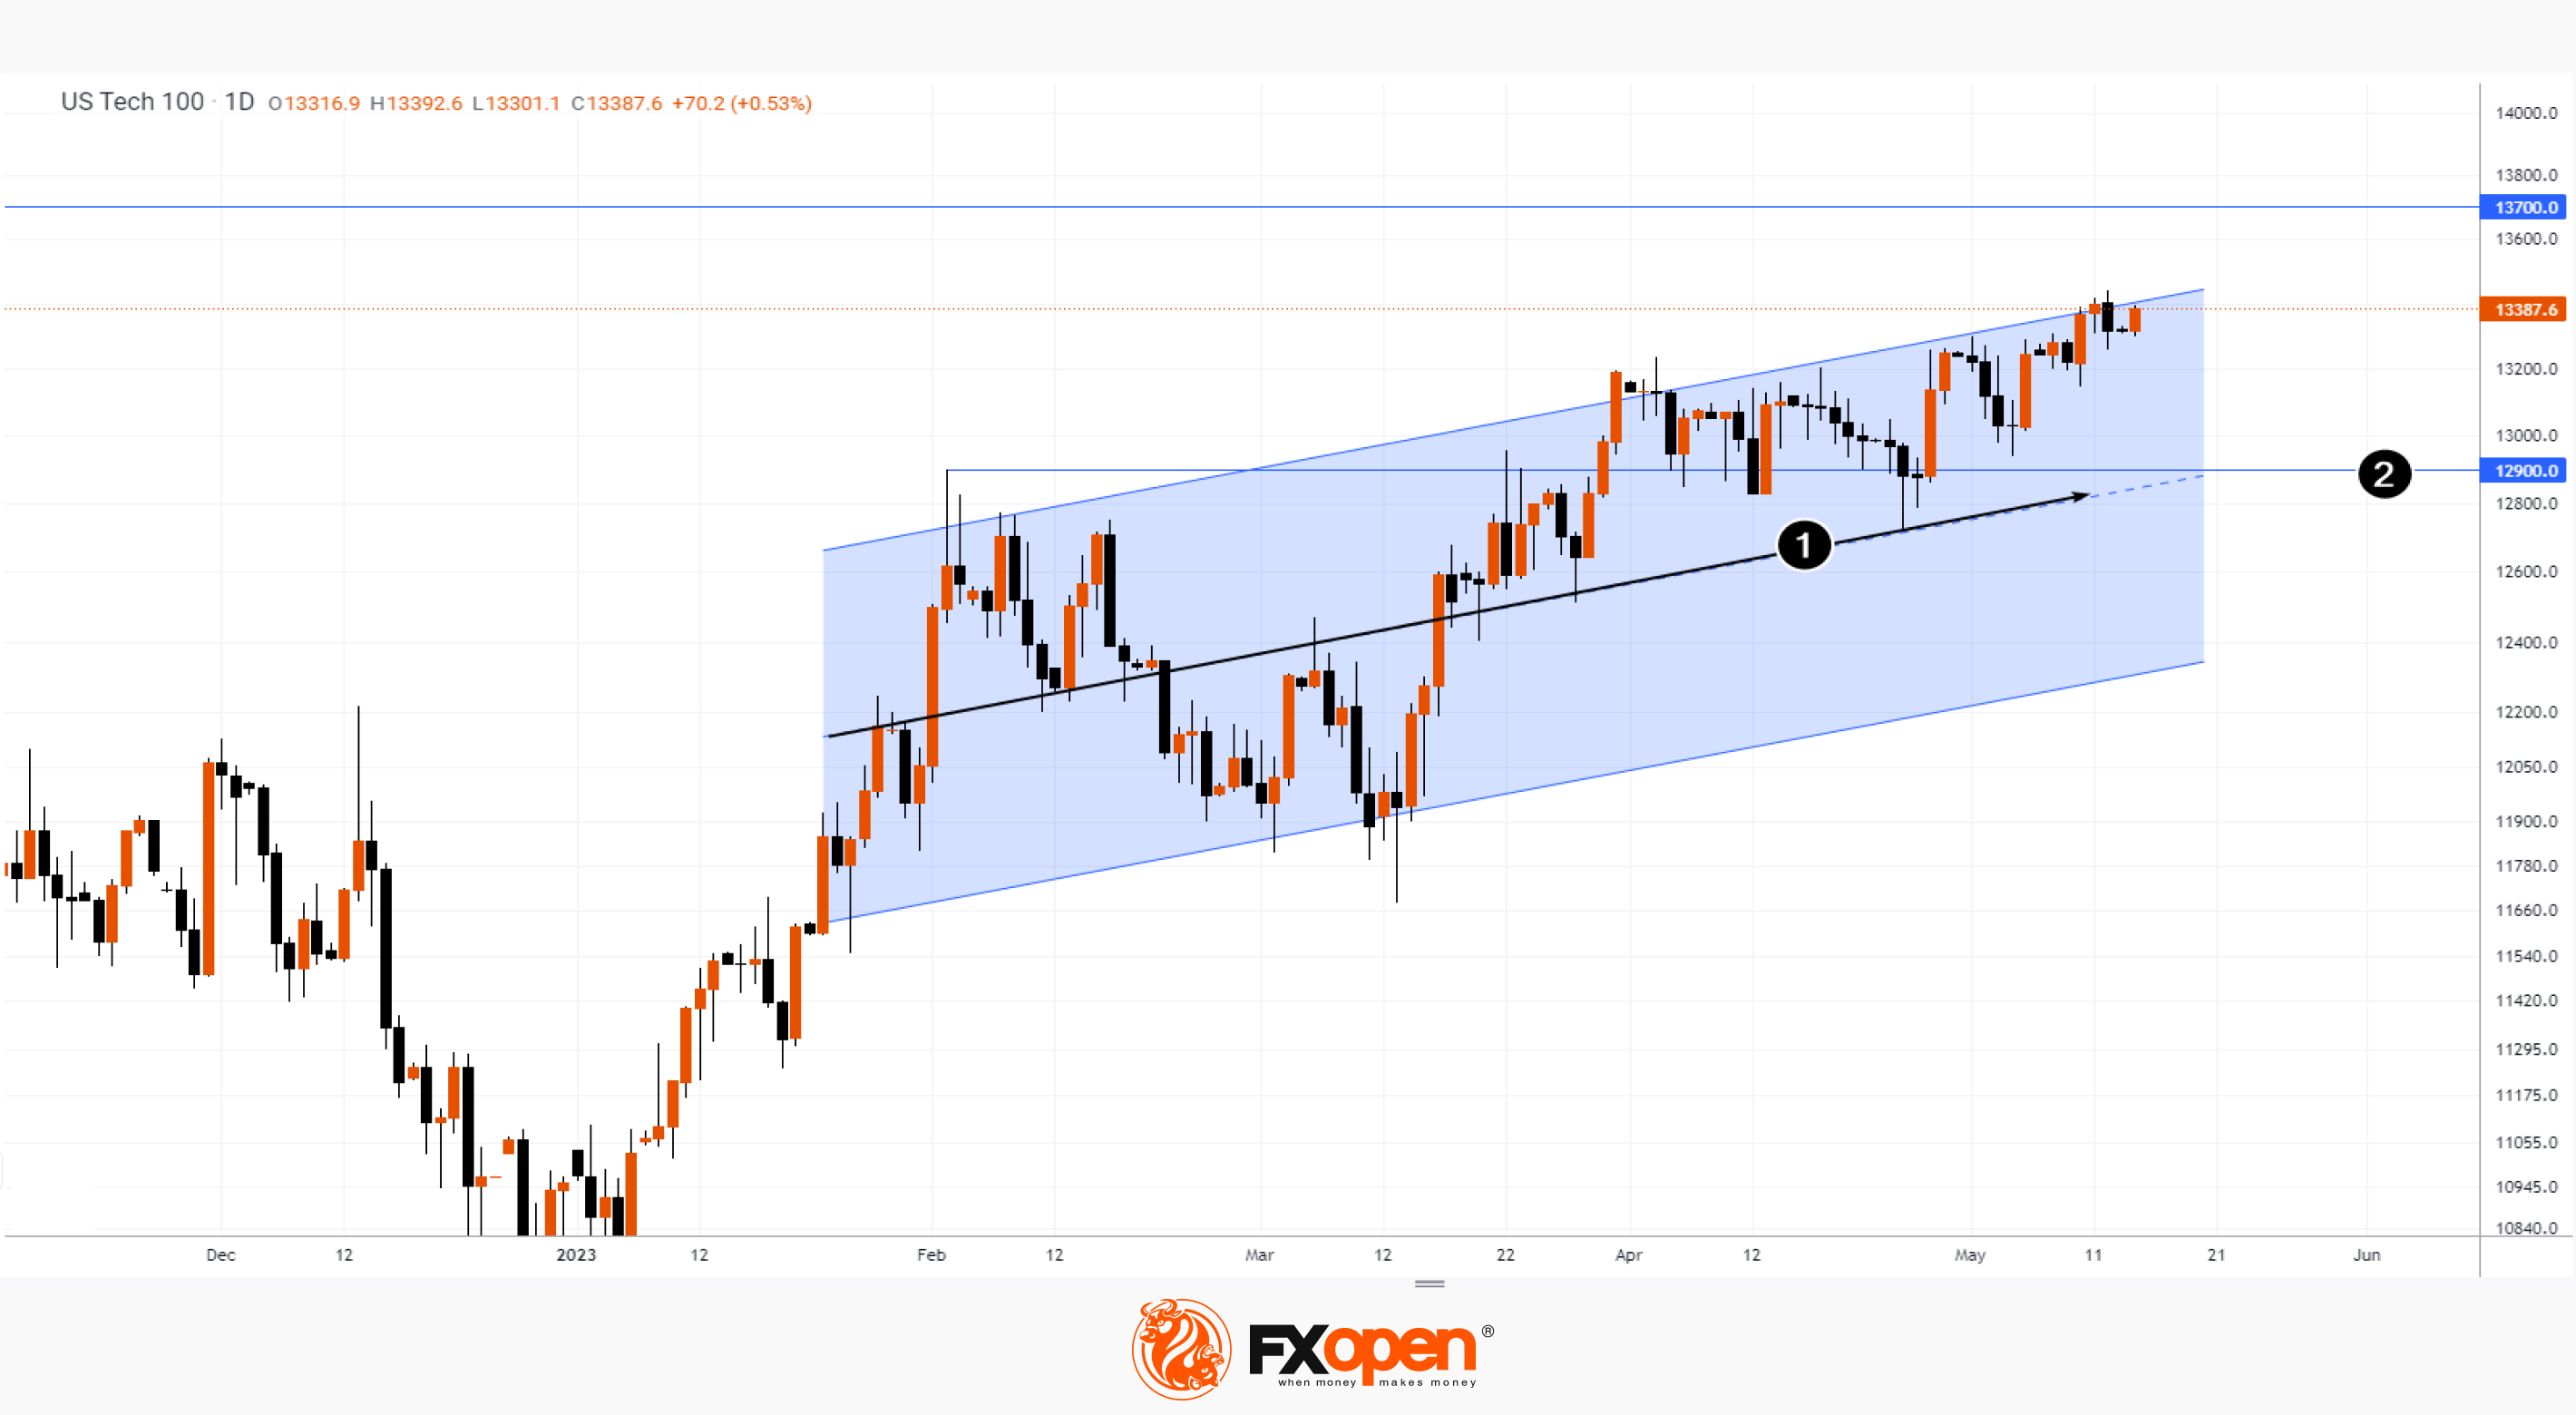
The Nasdaq 100 chart today shows that the price of the asset is at the upper border of the channel. It will prevent the price from exploding, which can only be believed with great optimism, given that the headlines about the US default create an increasingly negative background. If there is a correction, it is acceptable to assume that the futures price will find support from the median channel line (1) near the psychological level of 13,000 (2).
To take advantage of fluctuations in the stock markets of the US and other countries, consider enlisting the services of a reliable broker like FXOpen.
⚠️
CFDs are complex instruments and come with a high risk of losing your money.
This article represents the opinion of the Companies operating under the FXOpen brand only. It is not to be construed as an offer, solicitation, or recommendation with respect to products and services provided by the Companies operating under the FXOpen brand, nor is it to be considered financial advice.
E-mini Nasdaq 100 Futures Hit Year's High
It happened on Friday. However, the last day of last week closed lower after the news report about consumer sentiment in the US falling to a six-month low.
Also on Friday, the Congressional Budget Office warned that the United States faced a "significant risk" of default on its payment obligations during the first two weeks of June unless the national debt ceiling was raised.
The second round of debt ceiling talks between the White House and Congressional leaders is scheduled for Tuesday, President Biden said Sunday. He added that there is no turning point in the negotiations yet, but real discussions are underway, because, naturally, the US is not interested in its own default.
On Monday, the price of E-mini Nasdaq 100 futures is rising again; it is possible that another update will take place this week. E-mini Nasdaq 100 futures are stronger than E-mini S&P 500 futures because:
→ the Nasdaq 100 index does not include shares of large banks that are under pressure due to the banking crisis;
→ the results of the leading companies for the Q1 did not disappoint investors.
The Nasdaq 100 chart today shows that the price of the asset is at the upper border of the channel. It will prevent the price from exploding, which can only be believed with great optimism, given that the headlines about the US default create an increasingly negative background. If there is a correction, it is acceptable to assume that the futures price will find support from the median channel line (1) near the psychological level of 13,000 (2).
To take advantage of fluctuations in the stock markets of the US and other countries, consider enlisting the services of a reliable broker like FXOpen.
⚠️
CFDs are complex instruments and come with a high risk of losing your money.
This article represents the opinion of the Companies operating under the FXOpen brand only. It is not to be construed as an offer, solicitation, or recommendation with respect to products and services provided by the Companies operating under the FXOpen brand, nor is it to be considered financial advice.
#MarketNews #bitcoin
TOP-3 Assets To Look out for in Case of US Default
Bloomberg writes that the risk of default is higher than ever, adding that according to Janet Yellen, she has no plan for the fact that the national debt ceiling will not be raised. The Treasury secretary, who worked at the Fed in 2011 when the situation was similar, said she was focusing on working with Congress to raise the ceiling.
With the denouement looming, Bloomberg polled more than 600 finance professionals between May 8 and May 12 for the best safe haven asset in the event of a default.
→ Top 1. Gold. More than half of the respondents said they would buy gold if the US government failed to meet its obligations.
→ Top 2. US bonds. It's a little paradoxical to buy bonds of a defaulting government. The logic is that bond payments take precedence — bond holders are usually paid, albeit late.
In third place, one could expect the Japanese yen or the Swiss franc. However…
→ Top 3. Bitcoin. Its price has increased by about 65% since the beginning of the year.
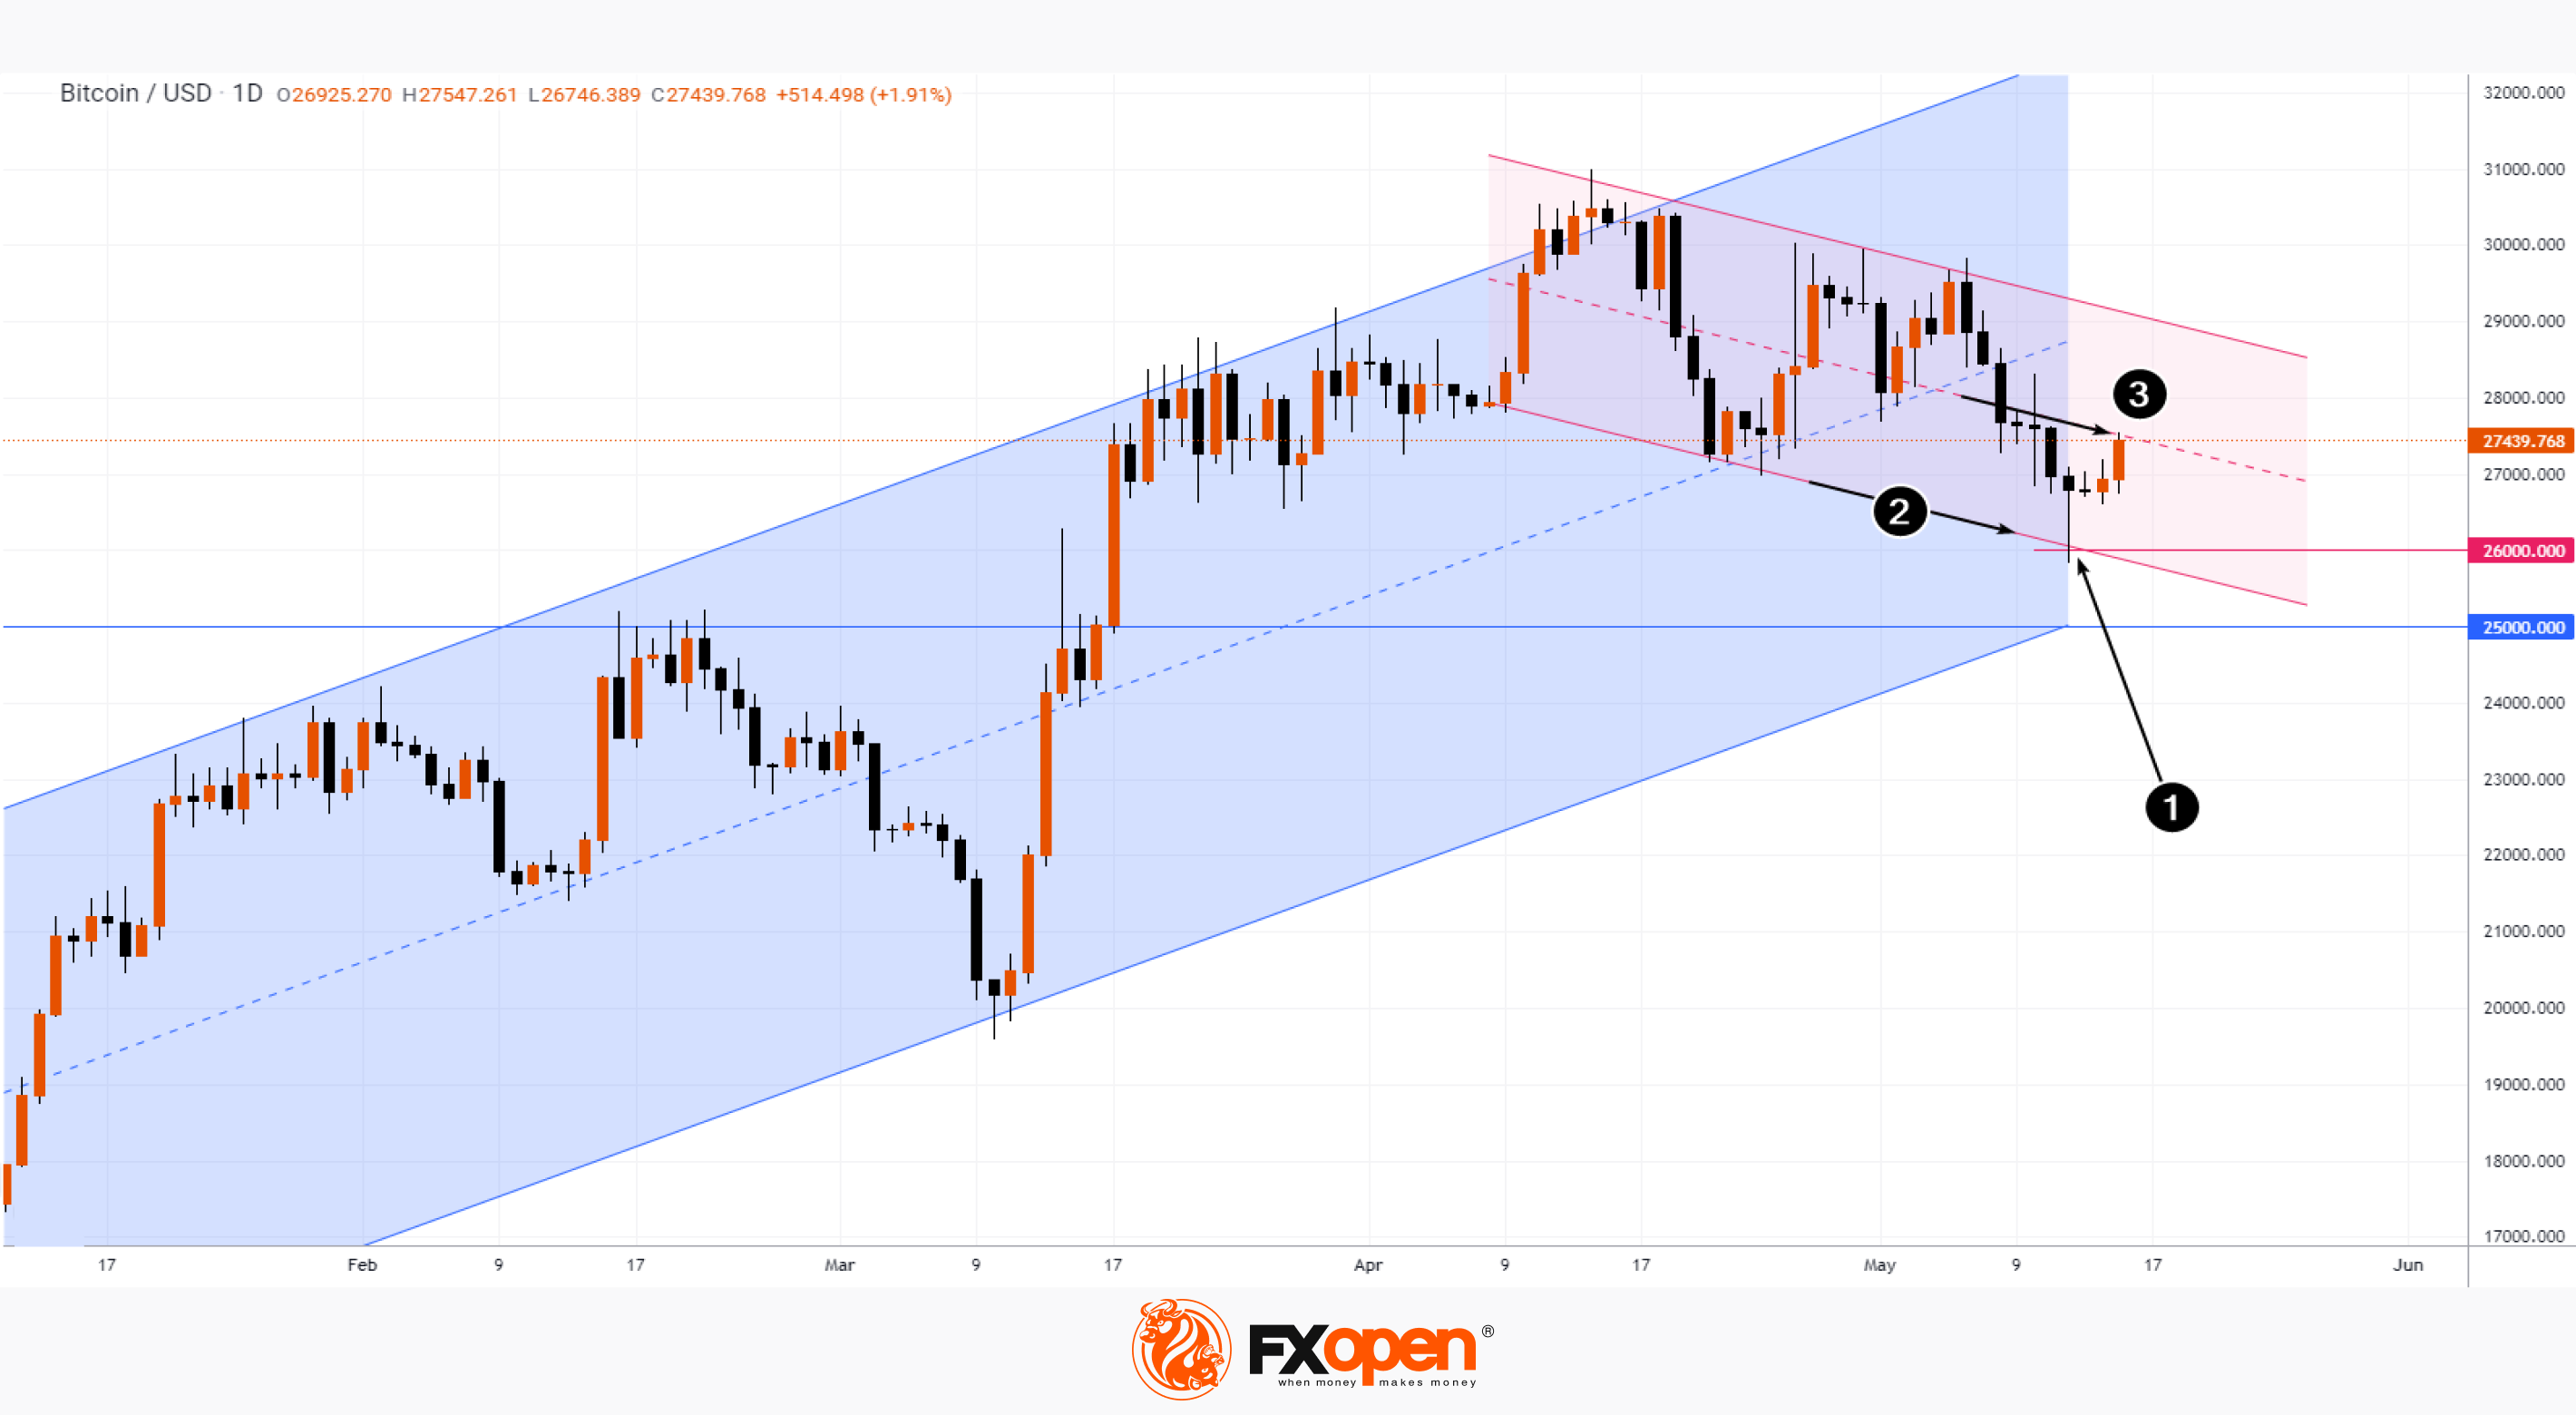
The BTC/USD chart today shows that the price of the coin has been in a downtrend since mid-April (shown in red) within a larger uptrend (shown in blue).
Having rebounded (1) from the intersection of the psychological level of USD $26k and the lower line of the red channel (2), the price of bitcoin found resistance from the red median line (3). If the bears are able to keep the momentum of BTC/USD within the downward channel, the price may drop to USD $25k or even lower, which will presumably reduce the attractiveness of bitcoin as a defensive asset.
To take advantage of the rise and fall of cryptocurrencies, consider enlisting the services of a reliable broker like FXOpen.
⚠️
CFDs are complex instruments and come with a high risk of losing your money.
This article represents the opinion of the Companies operating under the FXOpen brand only. It is not to be construed as an offer, solicitation, or recommendation with respect to products and services provided by the Companies operating under the FXOpen brand, nor is it to be considered financial advice.
Cryptocurrency CFDs are not available to Retail clients in the UK.
At FXOpen UK and FXOpen AU, Cryptocurrency CFDs are only available for trading by those clients categorised as Professional clients under FCA Rules and Professional clients under ASIC Rules, respectively. They are not available for trading by Retail clients.
TOP-3 Assets To Look out for in Case of US Default
Bloomberg writes that the risk of default is higher than ever, adding that according to Janet Yellen, she has no plan for the fact that the national debt ceiling will not be raised. The Treasury secretary, who worked at the Fed in 2011 when the situation was similar, said she was focusing on working with Congress to raise the ceiling.
With the denouement looming, Bloomberg polled more than 600 finance professionals between May 8 and May 12 for the best safe haven asset in the event of a default.
→ Top 1. Gold. More than half of the respondents said they would buy gold if the US government failed to meet its obligations.
→ Top 2. US bonds. It's a little paradoxical to buy bonds of a defaulting government. The logic is that bond payments take precedence — bond holders are usually paid, albeit late.
In third place, one could expect the Japanese yen or the Swiss franc. However…
→ Top 3. Bitcoin. Its price has increased by about 65% since the beginning of the year.
The BTC/USD chart today shows that the price of the coin has been in a downtrend since mid-April (shown in red) within a larger uptrend (shown in blue).
Having rebounded (1) from the intersection of the psychological level of USD $26k and the lower line of the red channel (2), the price of bitcoin found resistance from the red median line (3). If the bears are able to keep the momentum of BTC/USD within the downward channel, the price may drop to USD $25k or even lower, which will presumably reduce the attractiveness of bitcoin as a defensive asset.
To take advantage of the rise and fall of cryptocurrencies, consider enlisting the services of a reliable broker like FXOpen.
⚠️
CFDs are complex instruments and come with a high risk of losing your money.
This article represents the opinion of the Companies operating under the FXOpen brand only. It is not to be construed as an offer, solicitation, or recommendation with respect to products and services provided by the Companies operating under the FXOpen brand, nor is it to be considered financial advice.
Cryptocurrency CFDs are not available to Retail clients in the UK.
At FXOpen UK and FXOpen AU, Cryptocurrency CFDs are only available for trading by those clients categorised as Professional clients under FCA Rules and Professional clients under ASIC Rules, respectively. They are not available for trading by Retail clients.
#MarketNews
GBP/USD and USD/CAD Weekly Chart Outlook
· The British Pound was able to clear the 1.1880 and 1.2000 resistance levels.
· There was a break above a major bearish trend line with resistance near 1.2250 on the weekly chart of GBP/USD on FXOpen.
· USD/CAD is facing strong resistance near the 1.3750 zone.
· It is trading inside a key contracting triangle with resistance at 1.3750 on the weekly chart at FXOpen.
https://cutt.ly/u6YQsG5
CFDs are complex instruments and come with a high risk of losing your money.
This article represents the opinion of the Companies operating under the FXOpen brand only. It is not to be construed as an offer, solicitation, or recommendation with respect to products and services provided by the Companies operating under the FXOpen brand, nor is it to be considered financial advice.
GBP/USD and USD/CAD Weekly Chart Outlook
· The British Pound was able to clear the 1.1880 and 1.2000 resistance levels.
· There was a break above a major bearish trend line with resistance near 1.2250 on the weekly chart of GBP/USD on FXOpen.
· USD/CAD is facing strong resistance near the 1.3750 zone.
· It is trading inside a key contracting triangle with resistance at 1.3750 on the weekly chart at FXOpen.
https://cutt.ly/u6YQsG5
CFDs are complex instruments and come with a high risk of losing your money.
This article represents the opinion of the Companies operating under the FXOpen brand only. It is not to be construed as an offer, solicitation, or recommendation with respect to products and services provided by the Companies operating under the FXOpen brand, nor is it to be considered financial advice.
Market Pulse
GBP/USD and USD/CAD Weekly Chart Outlook
GBP/USD started a steady increase above the key 1.1880 resistance. USD/CAD is consolidating and might rise further toward 1.4000.
#MarketNews #sp500
E-mini S&P 500: What the Decline in Volatility Means
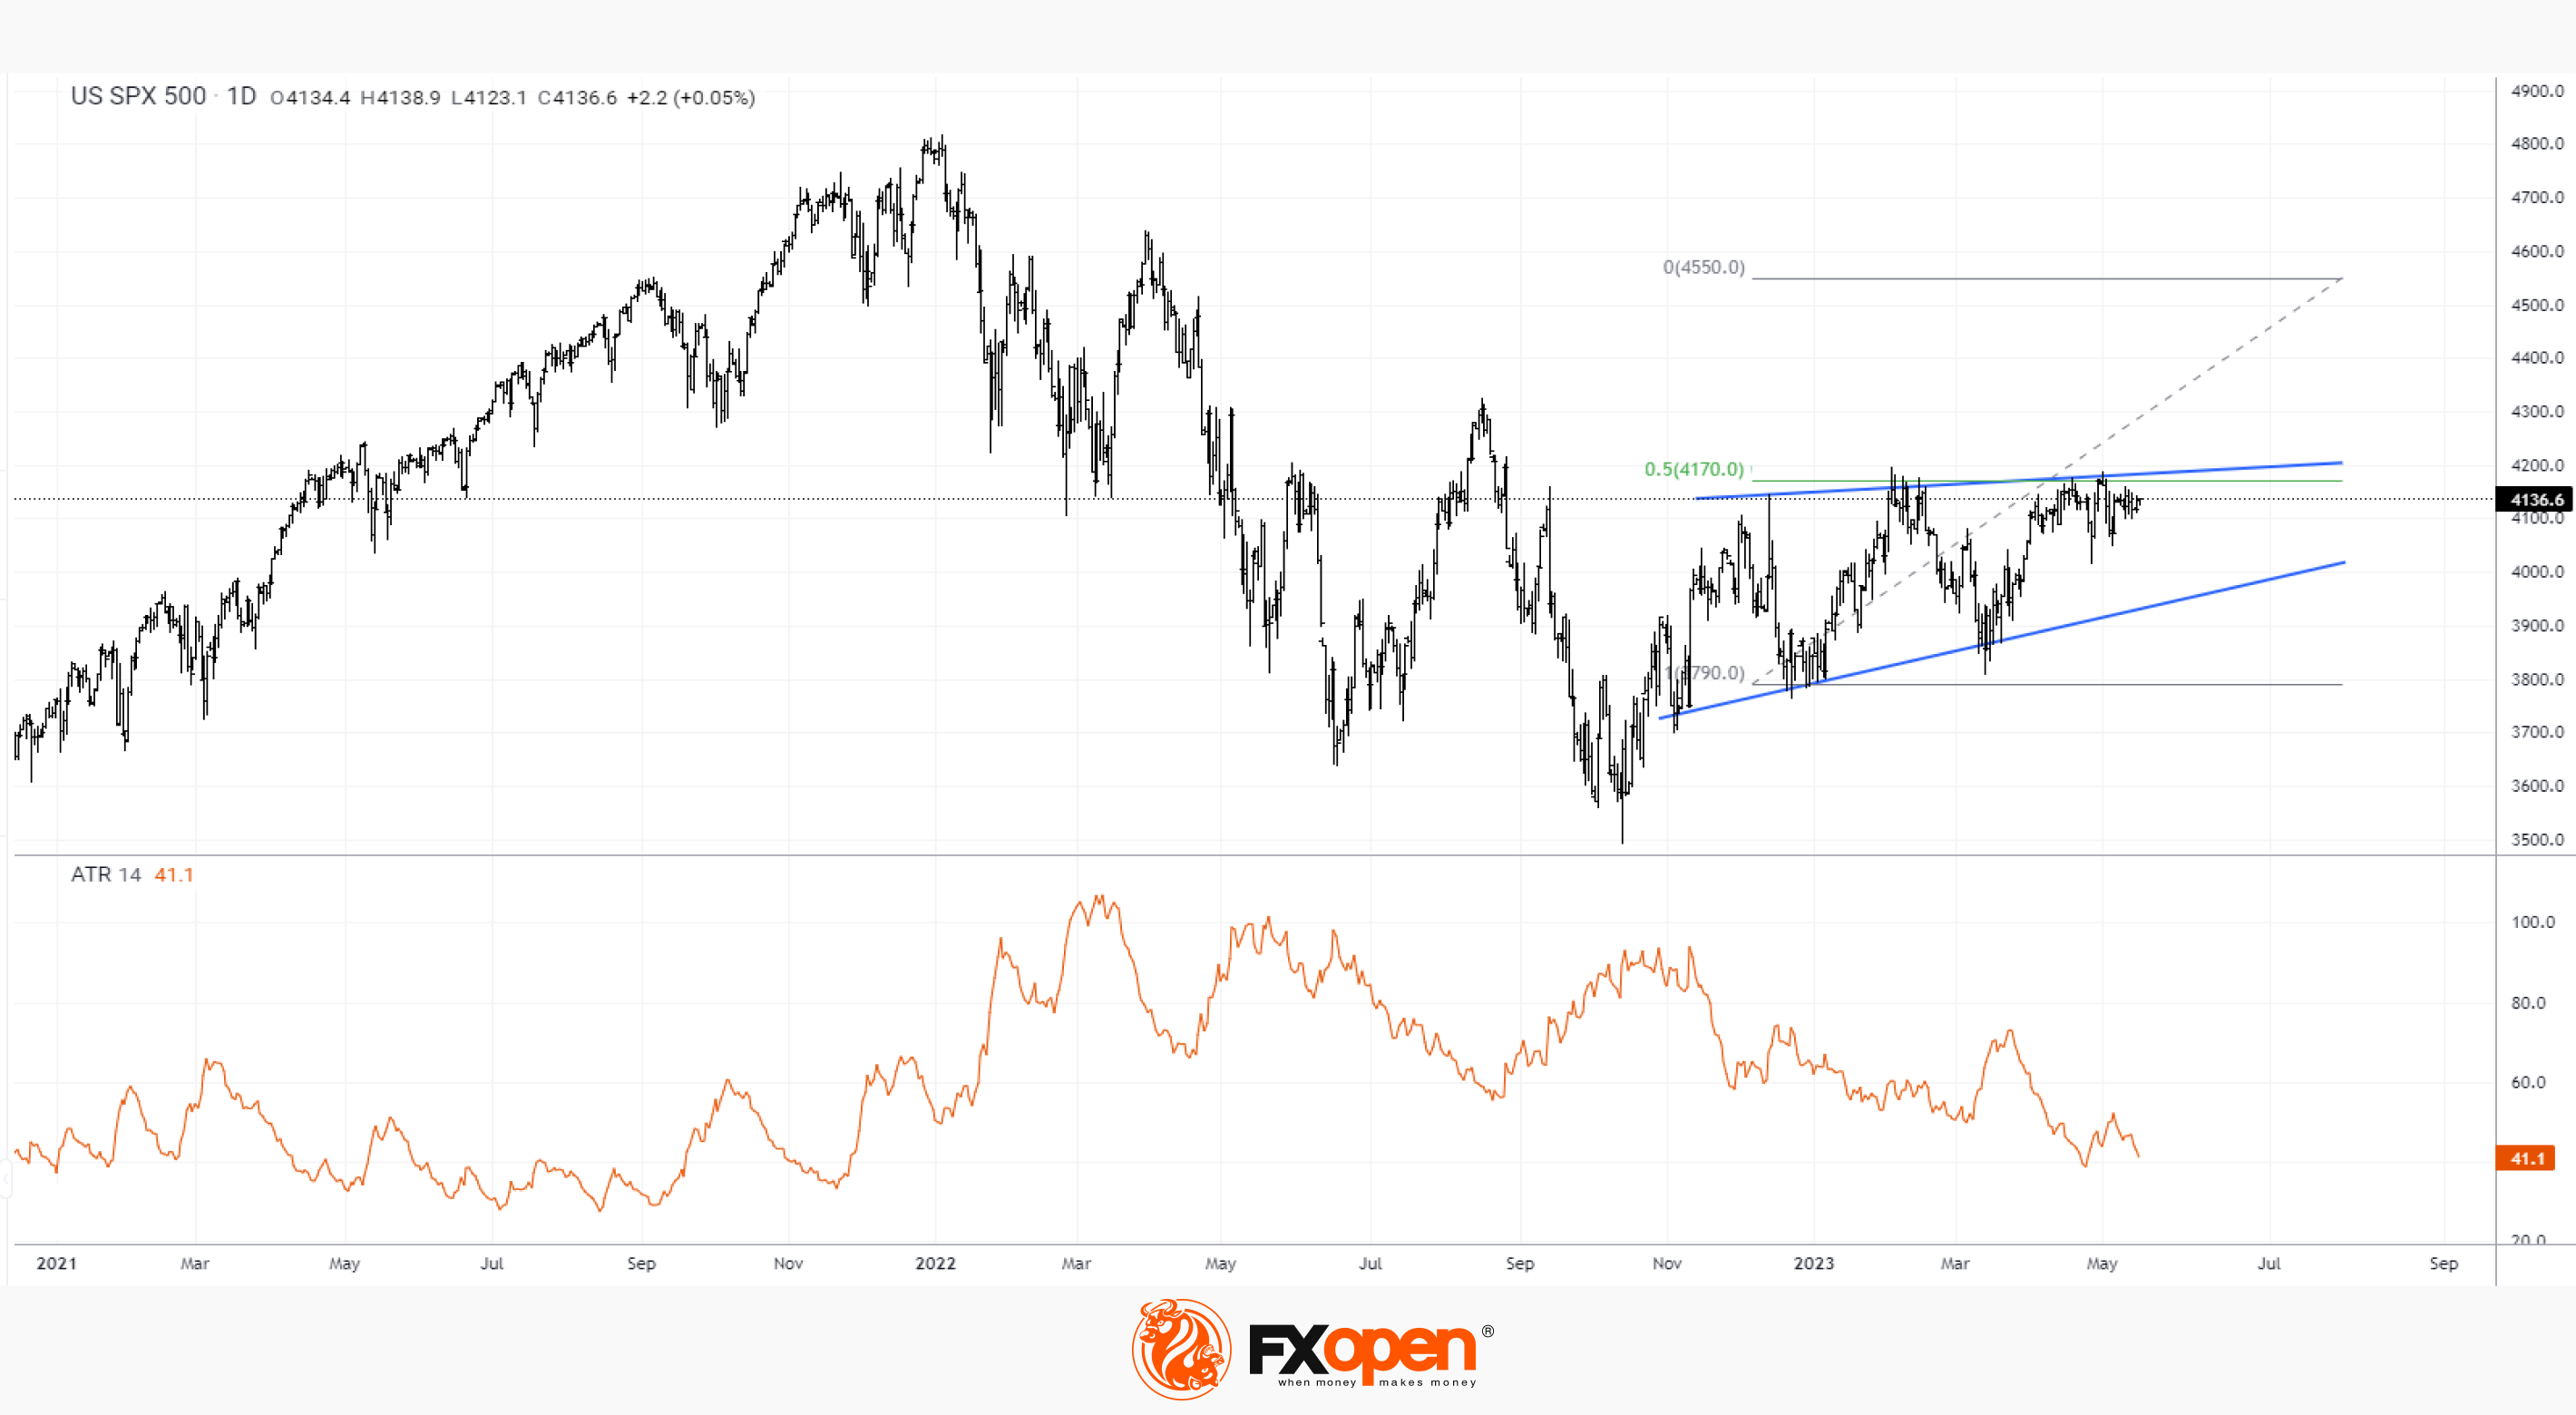
The daily E-mini S&P 500 chart shows that the ATR indicator (14) is in the 2023 lows, dropping below the value of 40.
What can low values of the ATR indicator mean, indicating a decrease in volatility?
1→ Remember the proverb “Sell in May and Go Away”, implying that the stock market is usually inactive starting from May. Are traders already on vacation after the main part of the reporting season? It is unlikely that the solution to the problem with the US public debt lies ahead. Already today, Tuesday, President Biden held talks with representatives of Congress on this matter.
2→ An important trend is brewing in the E-mini S&P 500 futures market. Notice the low ATR values at the end of 2021, followed by a massive decline. The market periodically changes its state: from flat (when reversal strategies work) → to trend (when breakout strategies work) → and so on ad infinitum.
Decreasing volatility forms a narrowing triangle (shown in blue lines). Its breakdown may lead to a trend that will change the price of the E-mini S&P 500 futures to a value approximately equal to the height of this triangle. Let's say in the event of a bullish breakout, the E-mini S&P 500 could rise to 4,550.
To take advantage of trends in the world's stock markets, consider enlisting the services of a reliable broker like FXOpen.
⚠️
CFDs are complex instruments and come with a high risk of losing your money.
This article represents the opinion of the Companies operating under the FXOpen brand only. It is not to be construed as an offer, solicitation, or recommendation with respect to products and services provided by the Companies operating under the FXOpen brand, nor is it to be considered financial advice.
E-mini S&P 500: What the Decline in Volatility Means
The daily E-mini S&P 500 chart shows that the ATR indicator (14) is in the 2023 lows, dropping below the value of 40.
What can low values of the ATR indicator mean, indicating a decrease in volatility?
1→ Remember the proverb “Sell in May and Go Away”, implying that the stock market is usually inactive starting from May. Are traders already on vacation after the main part of the reporting season? It is unlikely that the solution to the problem with the US public debt lies ahead. Already today, Tuesday, President Biden held talks with representatives of Congress on this matter.
2→ An important trend is brewing in the E-mini S&P 500 futures market. Notice the low ATR values at the end of 2021, followed by a massive decline. The market periodically changes its state: from flat (when reversal strategies work) → to trend (when breakout strategies work) → and so on ad infinitum.
Decreasing volatility forms a narrowing triangle (shown in blue lines). Its breakdown may lead to a trend that will change the price of the E-mini S&P 500 futures to a value approximately equal to the height of this triangle. Let's say in the event of a bullish breakout, the E-mini S&P 500 could rise to 4,550.
To take advantage of trends in the world's stock markets, consider enlisting the services of a reliable broker like FXOpen.
⚠️
CFDs are complex instruments and come with a high risk of losing your money.
This article represents the opinion of the Companies operating under the FXOpen brand only. It is not to be construed as an offer, solicitation, or recommendation with respect to products and services provided by the Companies operating under the FXOpen brand, nor is it to be considered financial advice.
#MarketNews #stockmarket #tsla
TSLA Stock Price Reacts to Major Elon Musk News
Twitter owner Elon Musk said that Linda Yaccarino, who until recently headed advertising at NBCUniversal (her team earned about USD 100 billion), will become the new director of the social network.
Here are the points that Musk made in an interview with CNBC:
→ Twitter is a very advertising dependent business and Linda is incredibly strong at it. I will continue to be involved in the development of new features and product content, with Linda managing. Everyone should use their strengths.
→ Now I have more time to work on Tesla. The company is busy developing two new cars.
→ Tesla is the only company in the industry where a car can achieve full autonomy. This technology will appear this year and will allow owners of electric vehicles to rent them to a fleet of robotic taxis.
The price of TSLA shares reacted positively to the news of the change in Elon's activities, setting a high in May, but then the emotions subsided and the price fell.
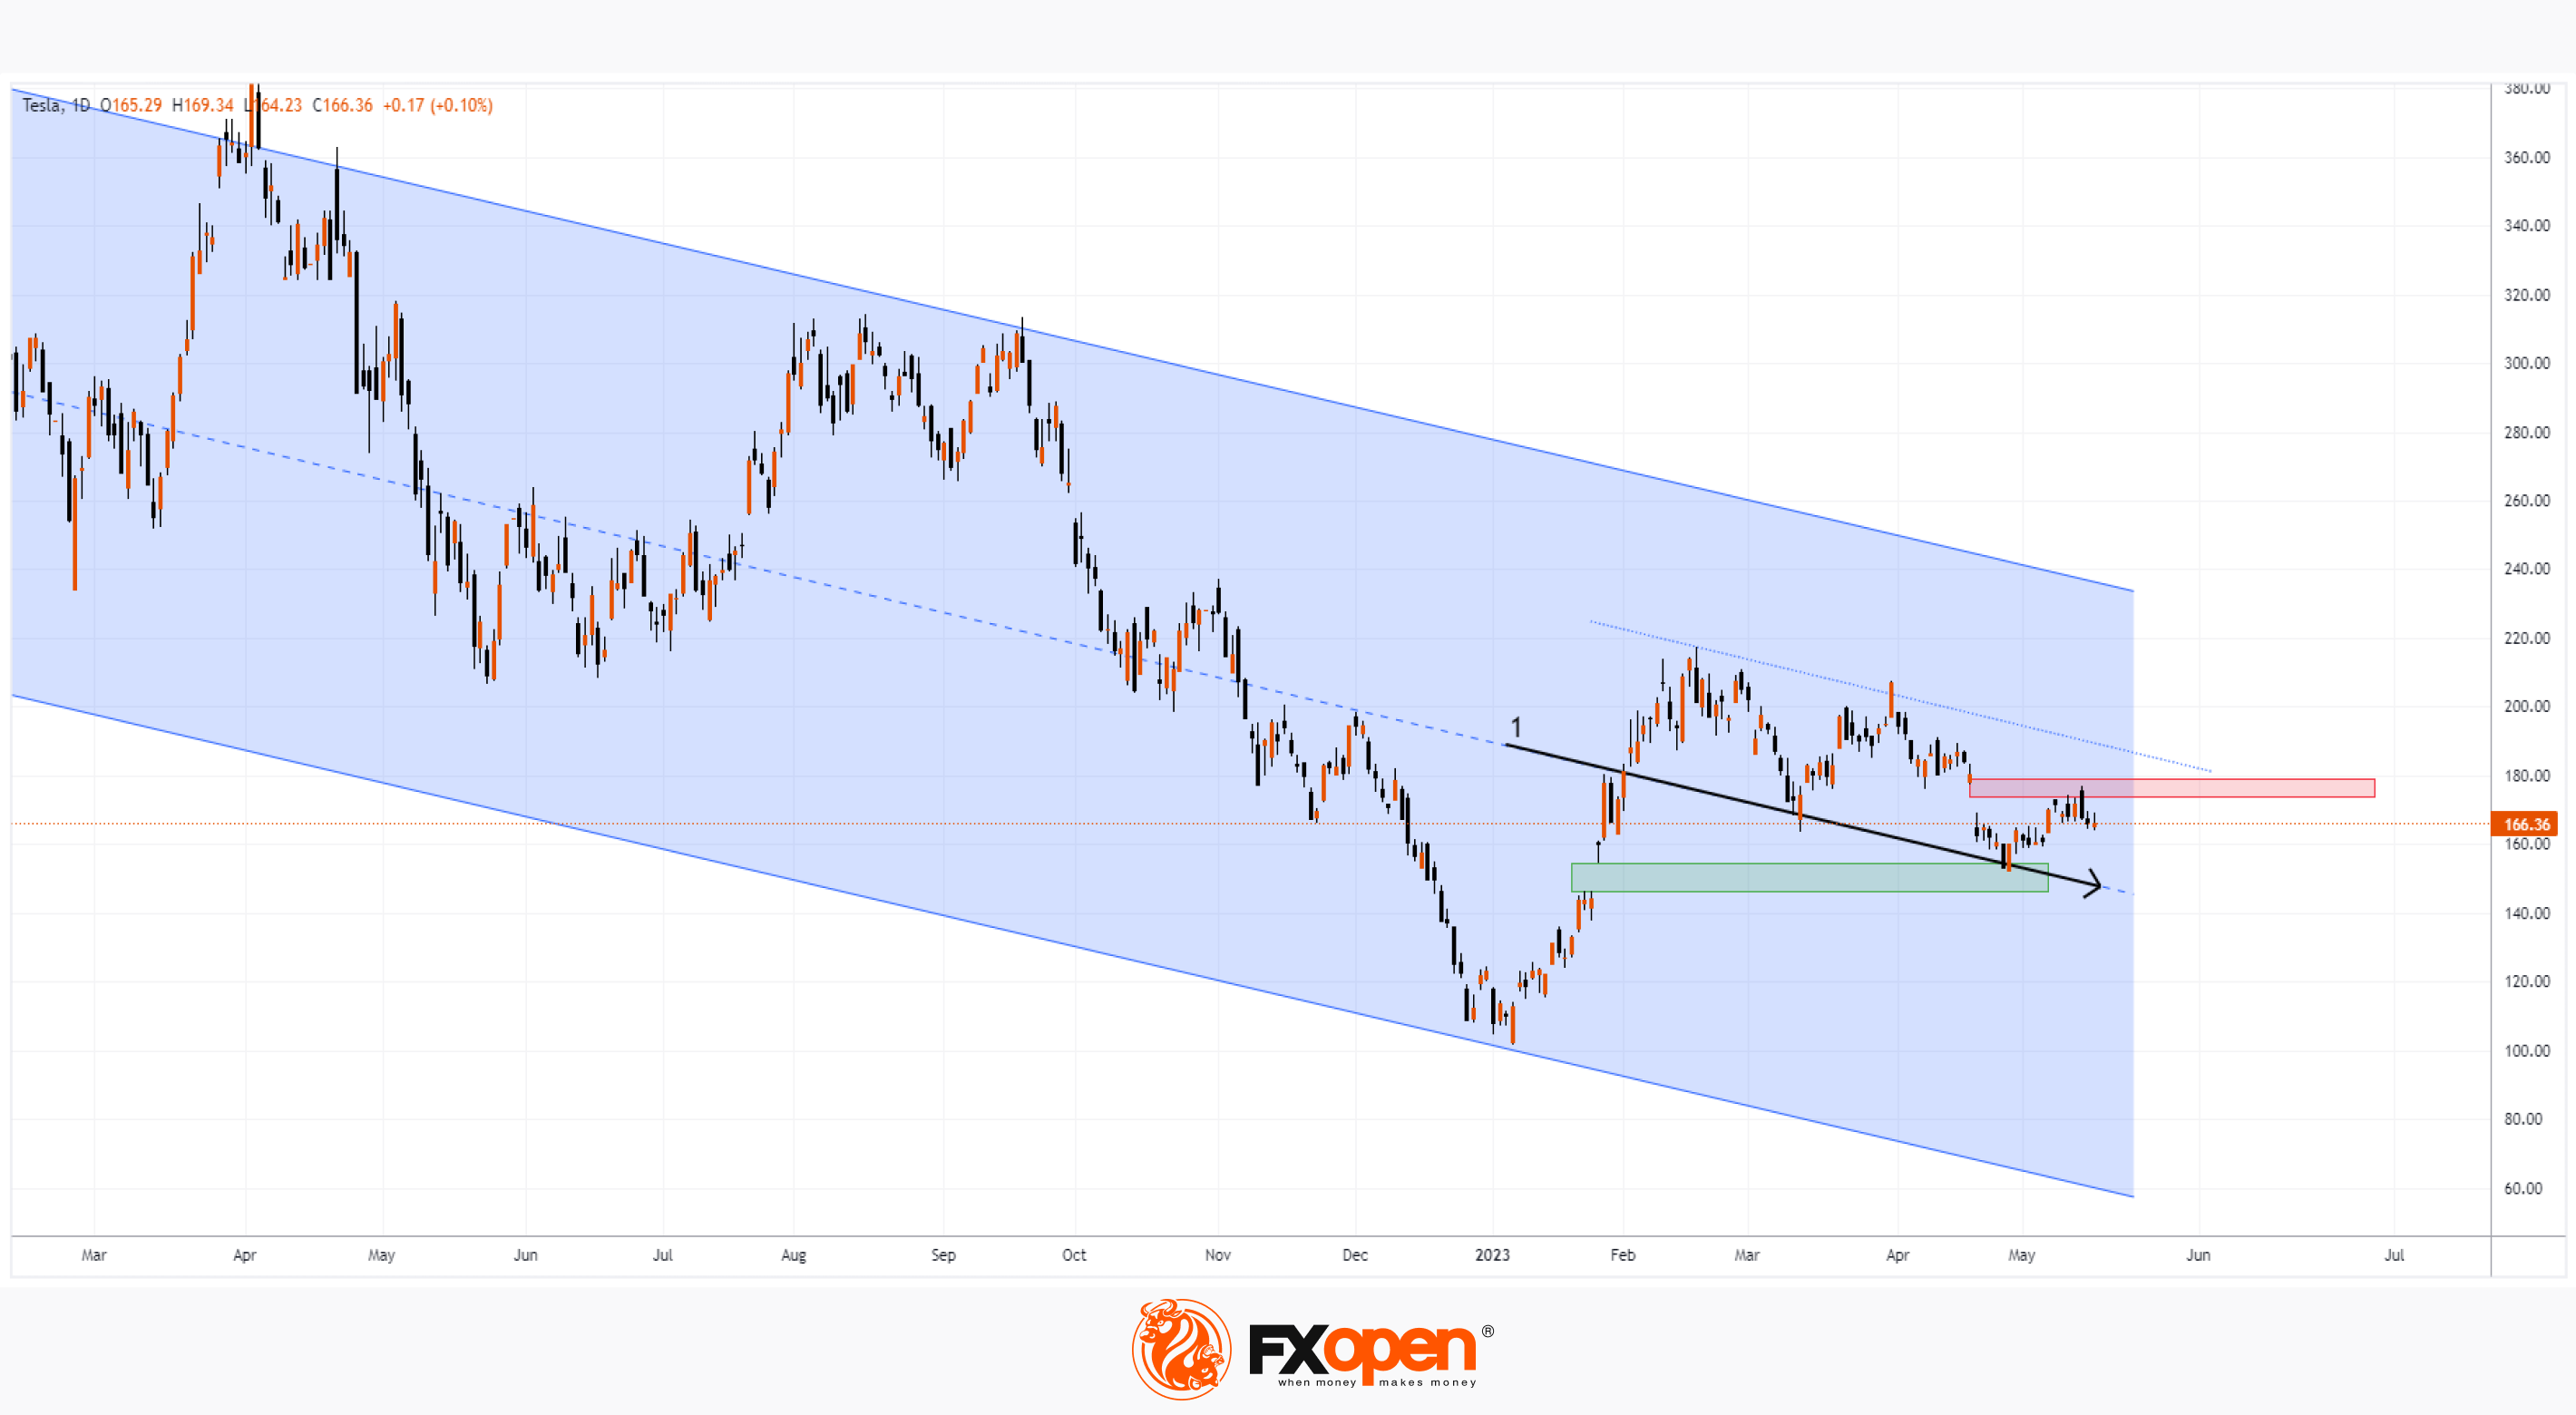
The chart shows that TSLA stock price:
→ is experiencing resistance from the bearish gap area (shown in red).
→ is getting support from the bullish gap area (shown in green) which is about 50% of the A→B rally.
Thus, there is a certain balance of supply and demand in the stock market, however, given the presence of a global and local downtrend in 2022-2023 (shown by blue channels), one should estimate the probability of a decrease in the price of TSLA shares to the median line (shown as number 1).
To take advantage of the rise and fall of stock prices of popular companies, consider enlisting the services of a reliable broker like FXOpen.
⚠️
CFDs are complex instruments and come with a high risk of losing your money.
This article represents the opinion of the Companies operating under the FXOpen brand only. It is not to be construed as an offer, solicitation, or recommendation with respect to products and services provided by the Companies operating under the FXOpen brand, nor is it to be considered financial advice.
TSLA Stock Price Reacts to Major Elon Musk News
Twitter owner Elon Musk said that Linda Yaccarino, who until recently headed advertising at NBCUniversal (her team earned about USD 100 billion), will become the new director of the social network.
Here are the points that Musk made in an interview with CNBC:
→ Twitter is a very advertising dependent business and Linda is incredibly strong at it. I will continue to be involved in the development of new features and product content, with Linda managing. Everyone should use their strengths.
→ Now I have more time to work on Tesla. The company is busy developing two new cars.
→ Tesla is the only company in the industry where a car can achieve full autonomy. This technology will appear this year and will allow owners of electric vehicles to rent them to a fleet of robotic taxis.
The price of TSLA shares reacted positively to the news of the change in Elon's activities, setting a high in May, but then the emotions subsided and the price fell.
The chart shows that TSLA stock price:
→ is experiencing resistance from the bearish gap area (shown in red).
→ is getting support from the bullish gap area (shown in green) which is about 50% of the A→B rally.
Thus, there is a certain balance of supply and demand in the stock market, however, given the presence of a global and local downtrend in 2022-2023 (shown by blue channels), one should estimate the probability of a decrease in the price of TSLA shares to the median line (shown as number 1).
To take advantage of the rise and fall of stock prices of popular companies, consider enlisting the services of a reliable broker like FXOpen.
⚠️
CFDs are complex instruments and come with a high risk of losing your money.
This article represents the opinion of the Companies operating under the FXOpen brand only. It is not to be construed as an offer, solicitation, or recommendation with respect to products and services provided by the Companies operating under the FXOpen brand, nor is it to be considered financial advice.
#MarketNews #bitcoin
Strengthening US Dollar Creates Pressure on Bitcoin and Other Assets
On Wednesday morning, the dollar index exceeded the high of April. The two following factors contributed to the strengthening of the USD:
→ Growing drama with public debt. Yesterday it became known that President Joe Biden and a senior Republican in Congress, Kevin McCarthy, are close to an agreement to raise the US national debt ceiling, but the decision has not yet been made. Goldman Sachs expects the US Treasury to run out June 8-13. And JPMorgan, Bank of America and Citigroup Inc executives say the damage to US business and the economy will begin long before a technical default. Investors see cash as a safe haven in case of default.
→ Strong retail sales data released yesterday. Core Retail Sales was +0.4%, while the values for the previous two months were negative.
The strengthening US dollar led to a fall in the exchange rate against the USD, to a decrease in the price of gold, as well as bitcoin.
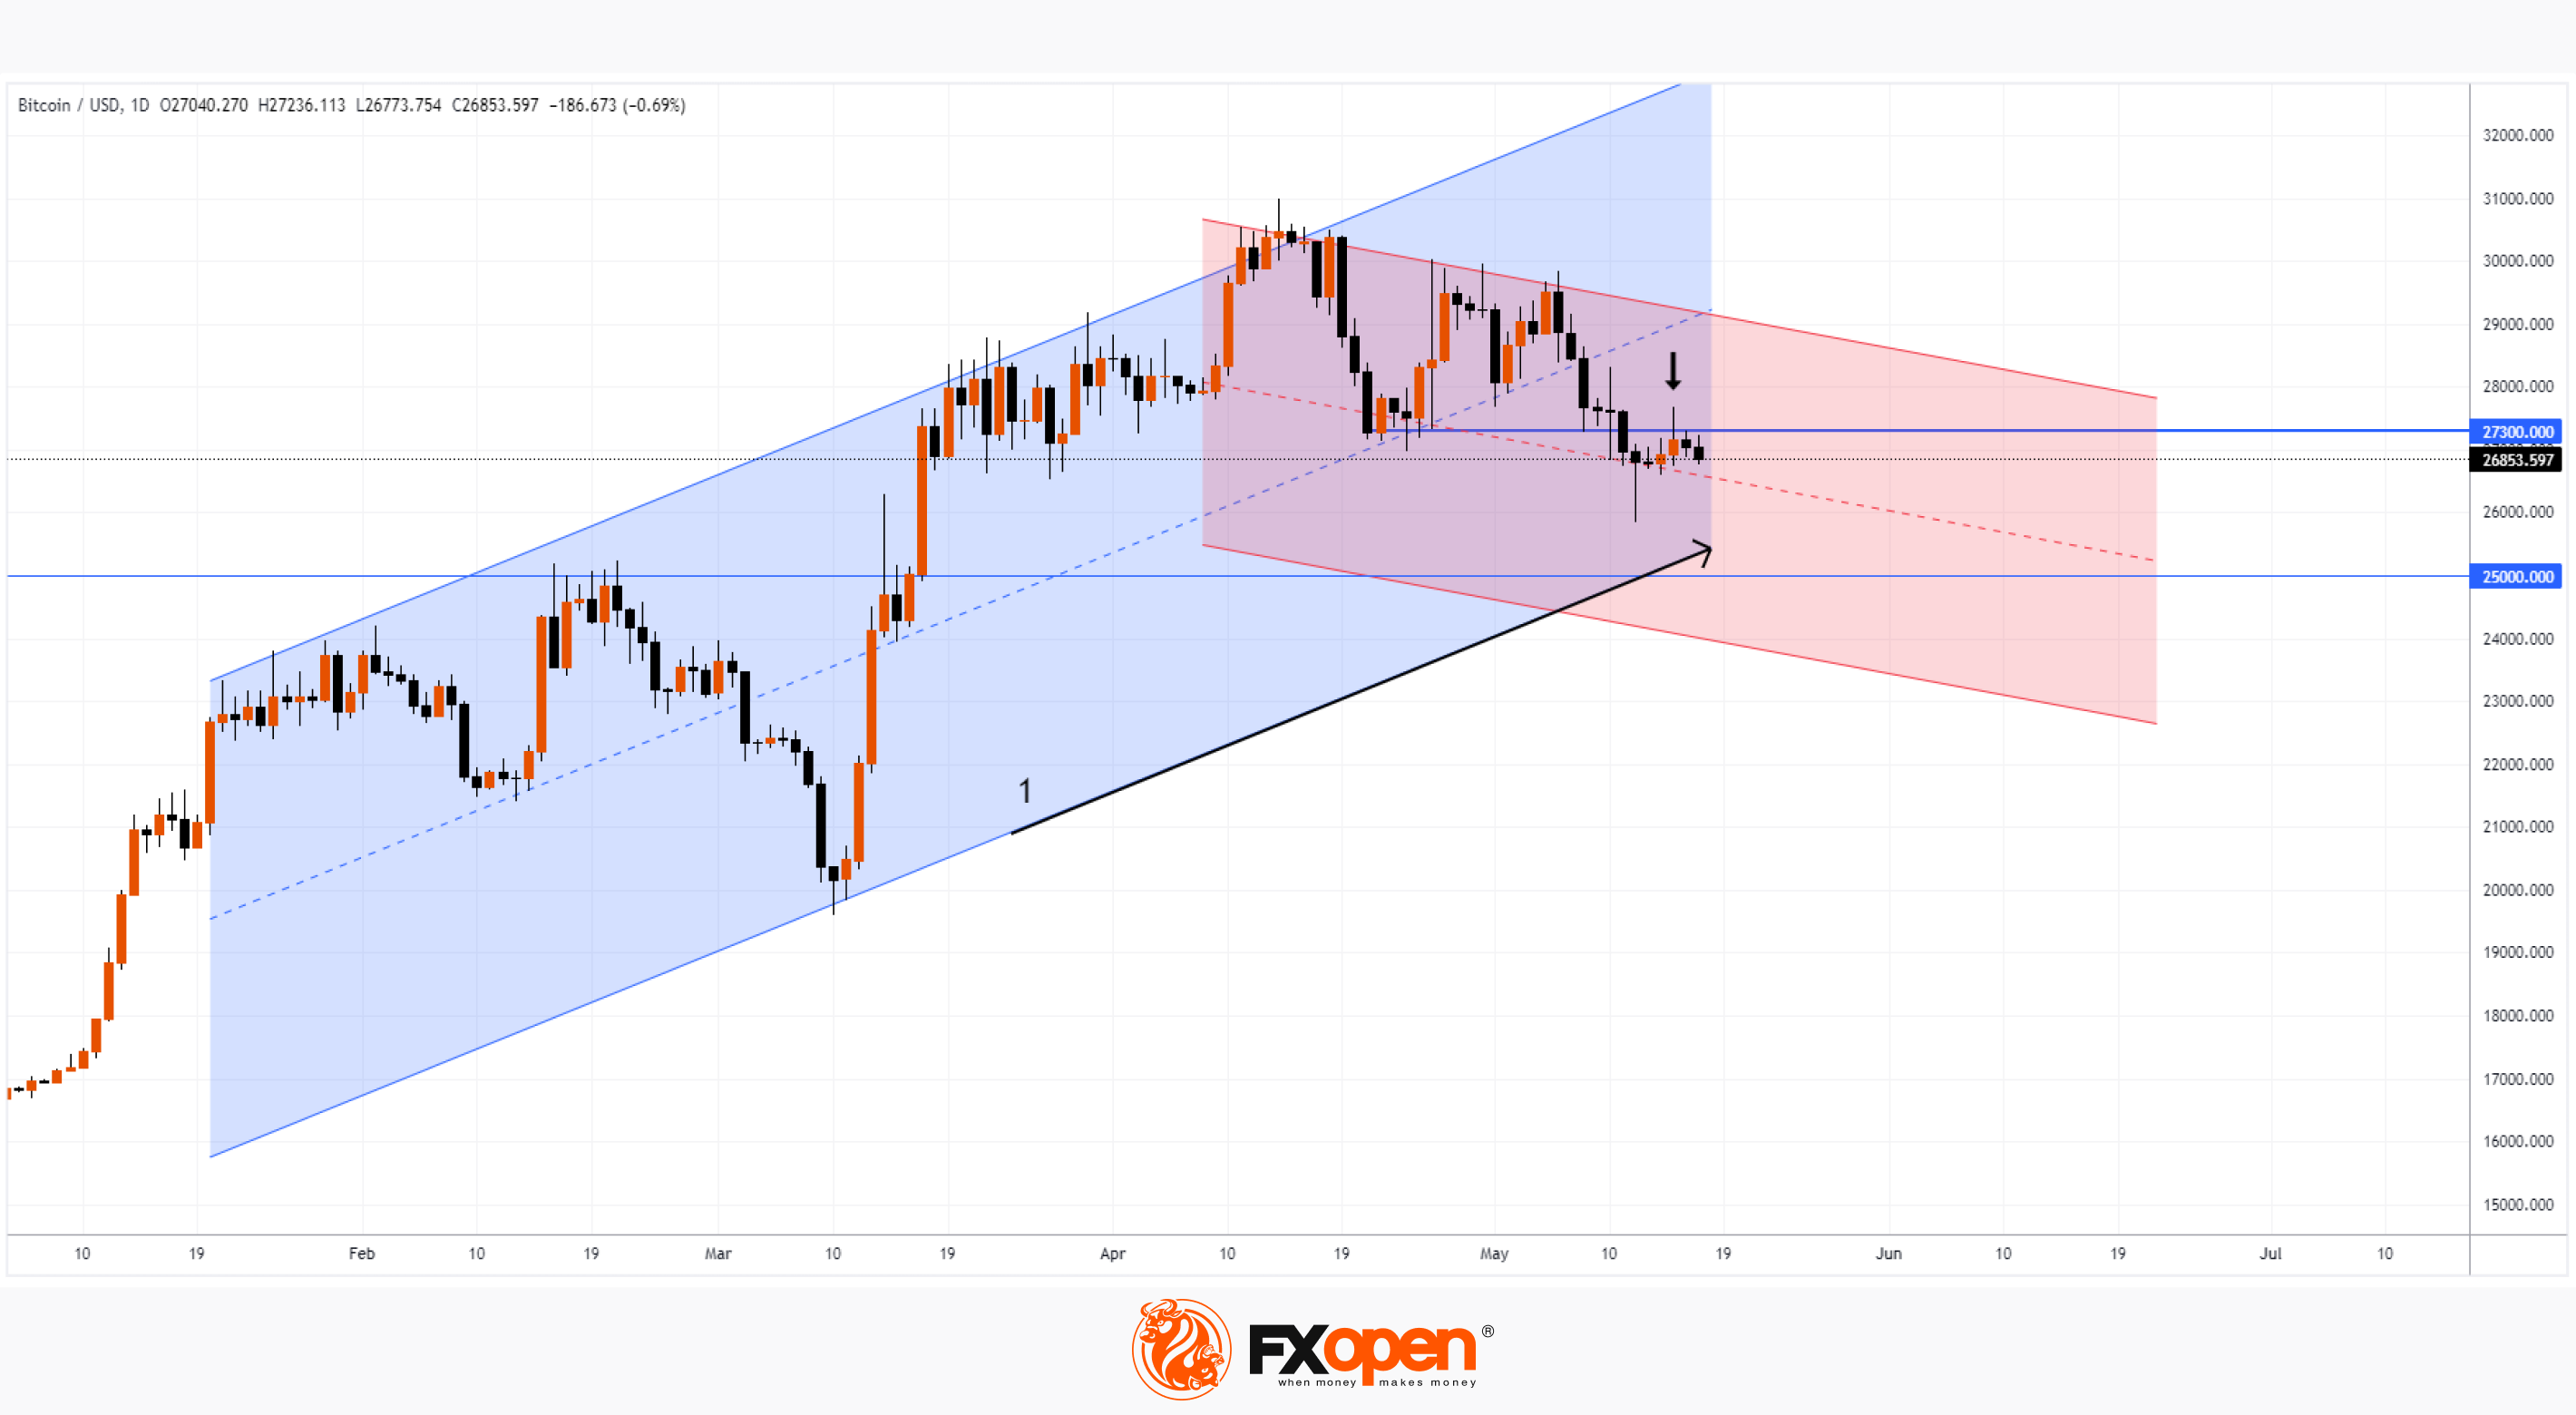
As the bitcoin chart shows today, the price is gradually declining along the median line of the descending channel (shown in red). Level 27,300, which previously served as support, is now resisting (shown by the arrow). If the trend continues, the price of bitcoin may reach the lower line (1) of the ascending channel that has been in effect since the beginning of 2023.
To take advantage of the rise and fall of the price of bitcoin in US dollars, consider enlisting the services of a reliable broker like FXOpen.
⚠️
CFDs are complex instruments and come with a high risk of losing your money.
This article represents the opinion of the Companies operating under the FXOpen brand only. It is not to be construed as an offer, solicitation, or recommendation with respect to products and services provided by the Companies operating under the FXOpen brand, nor is it to be considered financial advice.
At FXOpen UK and FXOpen AU, Cryptocurrency CFDs are only available for trading by those clients categorised as Professional clients under FCA Rules and Professional clients under ASIC Rules, respectively. They are not available for trading by Retail clients.
Strengthening US Dollar Creates Pressure on Bitcoin and Other Assets
On Wednesday morning, the dollar index exceeded the high of April. The two following factors contributed to the strengthening of the USD:
→ Growing drama with public debt. Yesterday it became known that President Joe Biden and a senior Republican in Congress, Kevin McCarthy, are close to an agreement to raise the US national debt ceiling, but the decision has not yet been made. Goldman Sachs expects the US Treasury to run out June 8-13. And JPMorgan, Bank of America and Citigroup Inc executives say the damage to US business and the economy will begin long before a technical default. Investors see cash as a safe haven in case of default.
→ Strong retail sales data released yesterday. Core Retail Sales was +0.4%, while the values for the previous two months were negative.
The strengthening US dollar led to a fall in the exchange rate against the USD, to a decrease in the price of gold, as well as bitcoin.
As the bitcoin chart shows today, the price is gradually declining along the median line of the descending channel (shown in red). Level 27,300, which previously served as support, is now resisting (shown by the arrow). If the trend continues, the price of bitcoin may reach the lower line (1) of the ascending channel that has been in effect since the beginning of 2023.
To take advantage of the rise and fall of the price of bitcoin in US dollars, consider enlisting the services of a reliable broker like FXOpen.
⚠️
CFDs are complex instruments and come with a high risk of losing your money.
This article represents the opinion of the Companies operating under the FXOpen brand only. It is not to be construed as an offer, solicitation, or recommendation with respect to products and services provided by the Companies operating under the FXOpen brand, nor is it to be considered financial advice.
At FXOpen UK and FXOpen AU, Cryptocurrency CFDs are only available for trading by those clients categorised as Professional clients under FCA Rules and Professional clients under ASIC Rules, respectively. They are not available for trading by Retail clients.
#MarketNews #stocks
Nvidia Stock Could Grow 5x in 10 Years
This is reported by CNBC with reference to the opinion of a hedge fund manager who believes that AI-related demand will serve as a growth driver.
→ According to Goldman Sachs analysts, AI can increase the profits of S&P 500 companies by 30% in the next 10 years.
→ NVIDIA raises its FY2024 processor sales forecast due to demand for AI.
→ Billionaire Stanley Druckenmiller bought Nvidia and Microsoft shares in Q1 for USD 430M, betting on AI.
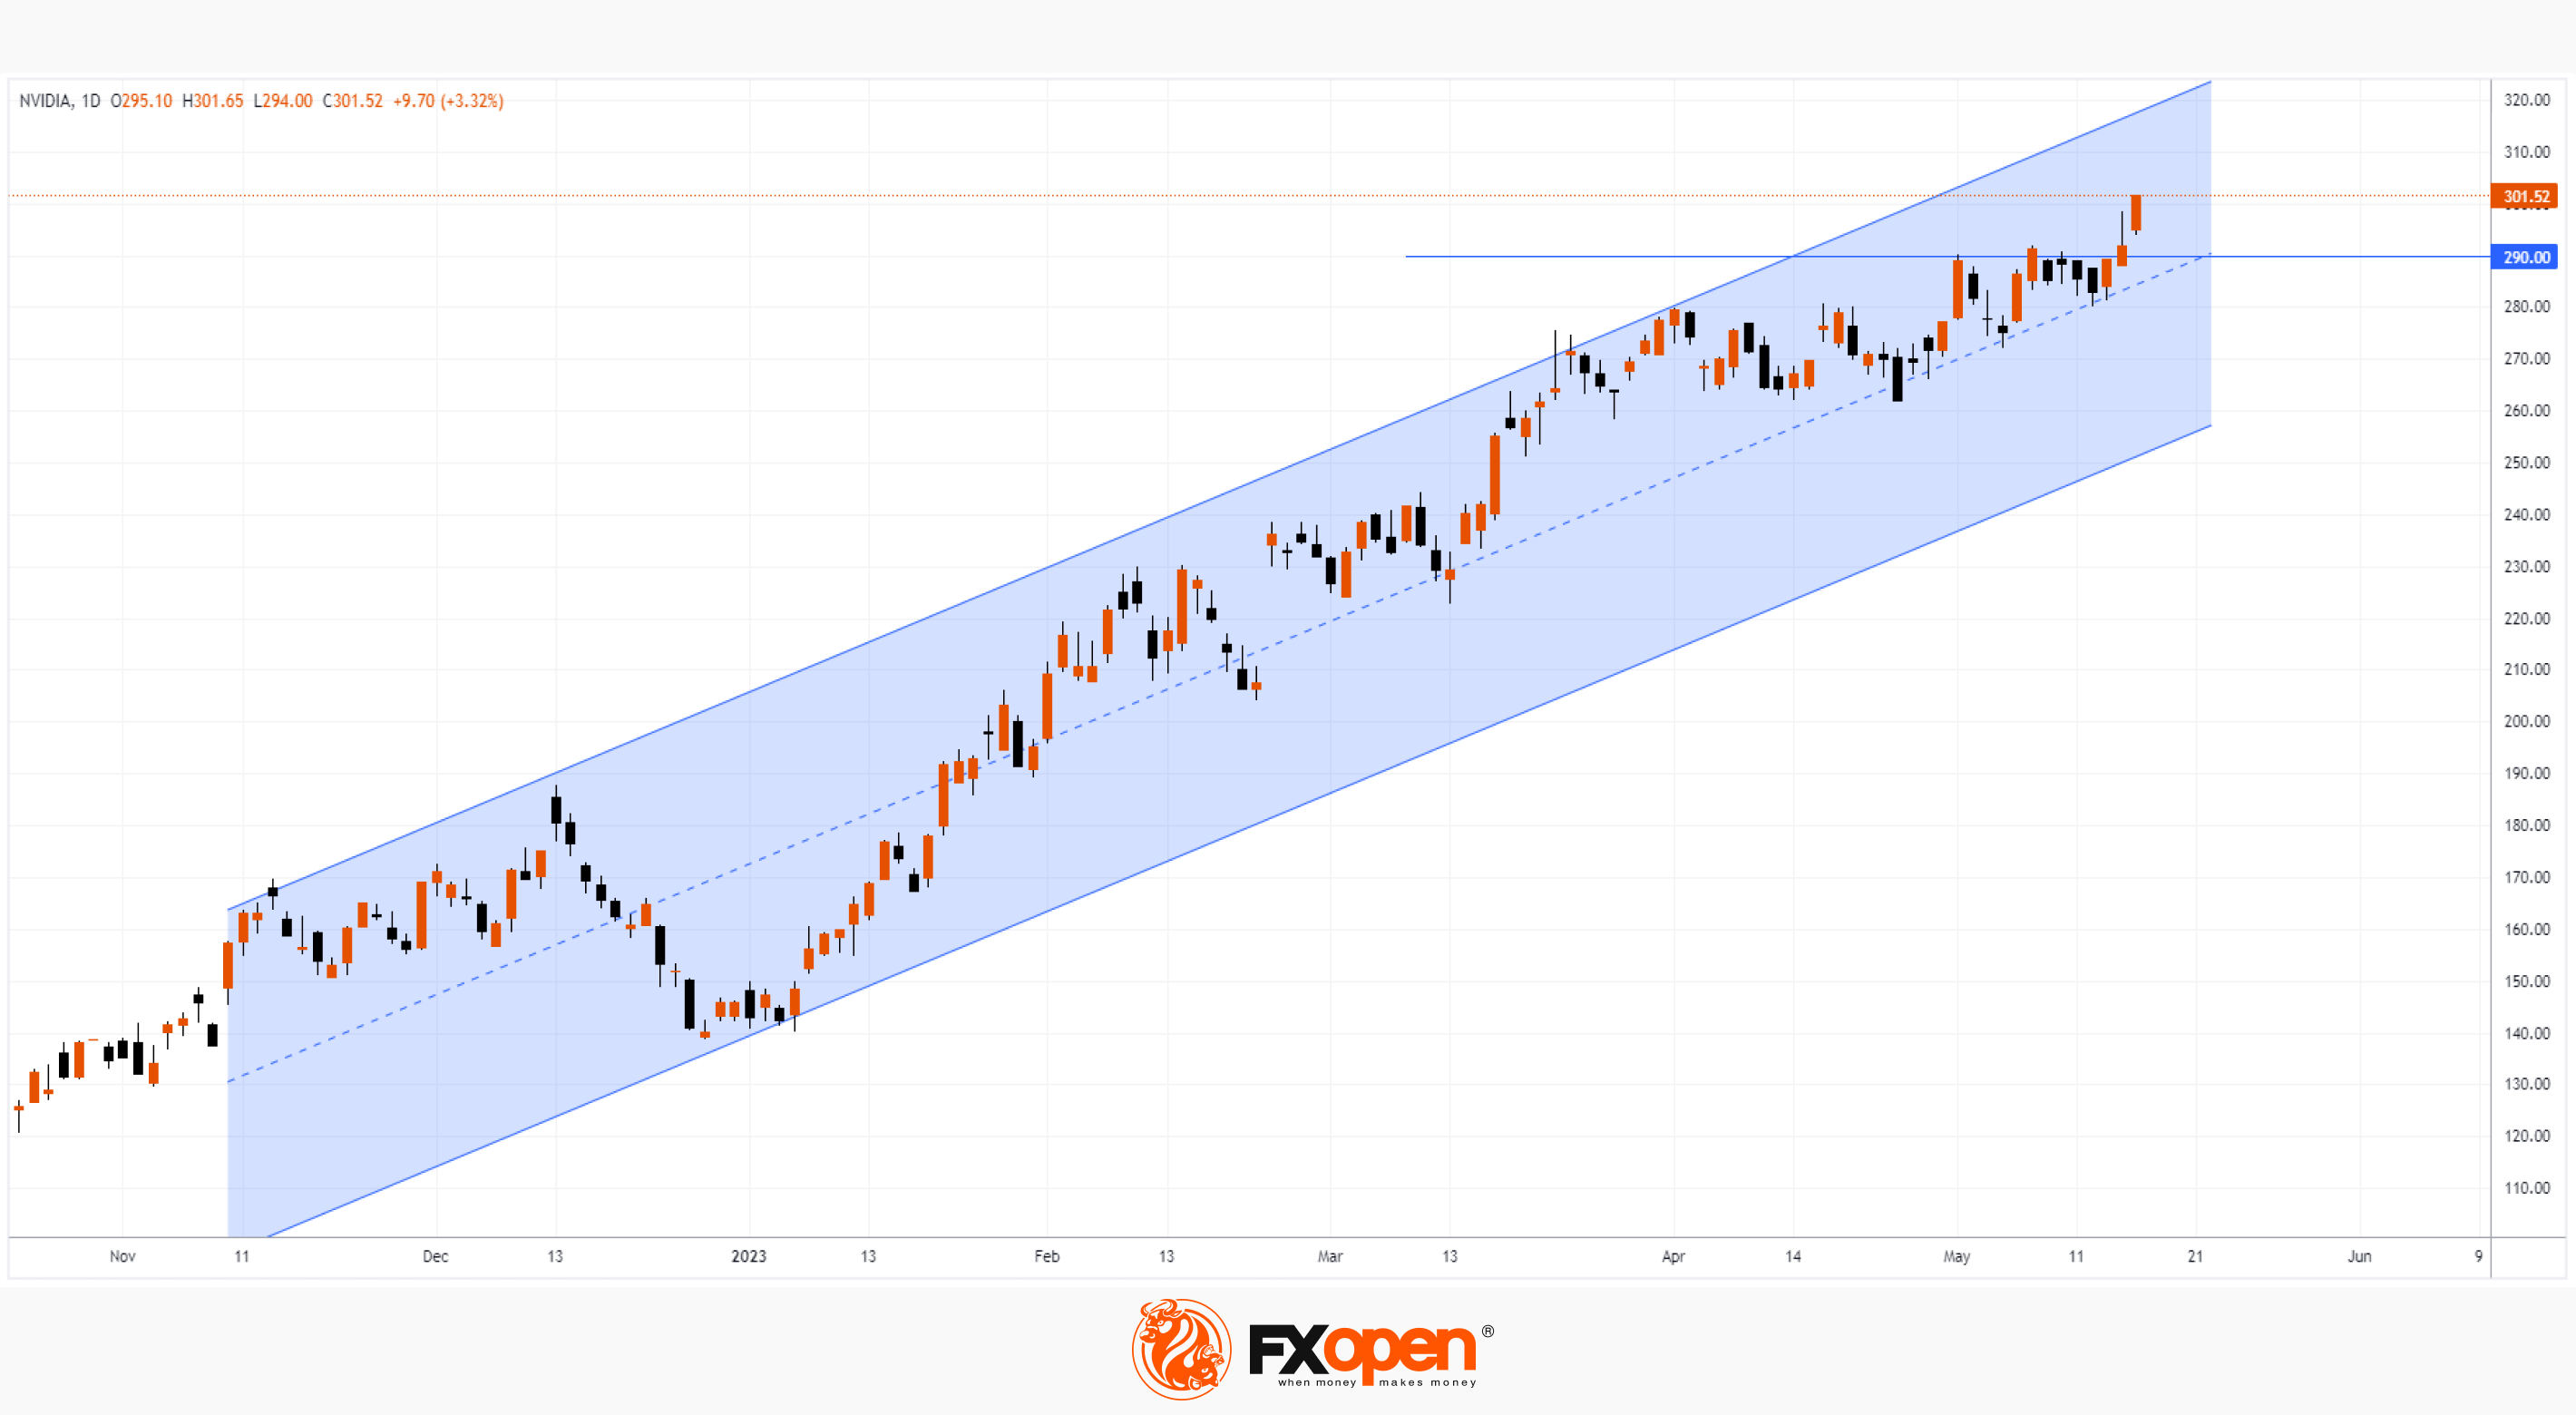
Meanwhile, NVDA's share price broke the psychological USD 300 mark, breaking the top of (1) March 2022. This is the average target price according to 46 analysts polled by the Wall Street Journal. They will probably have to raise their target price for NVDA stock now. By the way, none of them recommends selling the stock.
The chart shows that Nvidia's share price has risen more than 100% since the beginning of the year and is moving within an upward channel (shown in blue). The USD 290 level, which previously served as resistance, can now provide support. And if the bulls do not lose momentum, the price of NVDA shares may reach its upper limit.
To take advantage of trends in the stock markets of popular companies, consider enlisting the services of a reliable broker like FXOpen.
⚠️
CFDs are complex instruments and come with a high risk of losing your money.
This article represents the opinion of the Companies operating under the FXOpen brand only. It is not to be construed as an offer, solicitation, or recommendation with respect to products and services provided by the Companies operating under the FXOpen brand, nor is it to be considered financial advice.
Nvidia Stock Could Grow 5x in 10 Years
This is reported by CNBC with reference to the opinion of a hedge fund manager who believes that AI-related demand will serve as a growth driver.
→ According to Goldman Sachs analysts, AI can increase the profits of S&P 500 companies by 30% in the next 10 years.
→ NVIDIA raises its FY2024 processor sales forecast due to demand for AI.
→ Billionaire Stanley Druckenmiller bought Nvidia and Microsoft shares in Q1 for USD 430M, betting on AI.
Meanwhile, NVDA's share price broke the psychological USD 300 mark, breaking the top of (1) March 2022. This is the average target price according to 46 analysts polled by the Wall Street Journal. They will probably have to raise their target price for NVDA stock now. By the way, none of them recommends selling the stock.
The chart shows that Nvidia's share price has risen more than 100% since the beginning of the year and is moving within an upward channel (shown in blue). The USD 290 level, which previously served as resistance, can now provide support. And if the bulls do not lose momentum, the price of NVDA shares may reach its upper limit.
To take advantage of trends in the stock markets of popular companies, consider enlisting the services of a reliable broker like FXOpen.
⚠️
CFDs are complex instruments and come with a high risk of losing your money.
This article represents the opinion of the Companies operating under the FXOpen brand only. It is not to be construed as an offer, solicitation, or recommendation with respect to products and services provided by the Companies operating under the FXOpen brand, nor is it to be considered financial advice.
#tradingforex
Enjoy no commission fees on ECN accounts when you trade on MT4, MT5, or TickTrader platforms. Trading indices now becomes as affordable as possible for all our clients.
At present, FXOpen supports over 600 markets, including Index CFDs, FX, shares CFDs, commodities CFDs, and cryptocurrency CFDs*.
https://www.youtube.com/watch?v=aLuZeJ4jBa0
CFDs are complex instruments and come with a high risk of losing your money.
*At FXOpen UK and FXOpen AU, Cryptocurrency CFDs are only available for trading by those clients categorised as Professional clients under FCA Rules and Professional clients under ASIC Rules respectively. They are not available for trading by Retail clients.
Enjoy no commission fees on ECN accounts when you trade on MT4, MT5, or TickTrader platforms. Trading indices now becomes as affordable as possible for all our clients.
At present, FXOpen supports over 600 markets, including Index CFDs, FX, shares CFDs, commodities CFDs, and cryptocurrency CFDs*.
https://www.youtube.com/watch?v=aLuZeJ4jBa0
CFDs are complex instruments and come with a high risk of losing your money.
*At FXOpen UK and FXOpen AU, Cryptocurrency CFDs are only available for trading by those clients categorised as Professional clients under FCA Rules and Professional clients under ASIC Rules respectively. They are not available for trading by Retail clients.
YouTube
Zero commission with FXOpen
Enjoy no commission fees on ECN accounts when you trade on MT4, MT5, or TickTrader platforms. Trading indices now becomes as affordable as possible for all our clients.
At present, FXOpen supports over 600 markets, including Index CFDs, FX, shares CFDs,…
At present, FXOpen supports over 600 markets, including Index CFDs, FX, shares CFDs,…
#MarketNews #nikkei225
Nikkei 225 Heading Towards the Peak of the 1990s Bubble
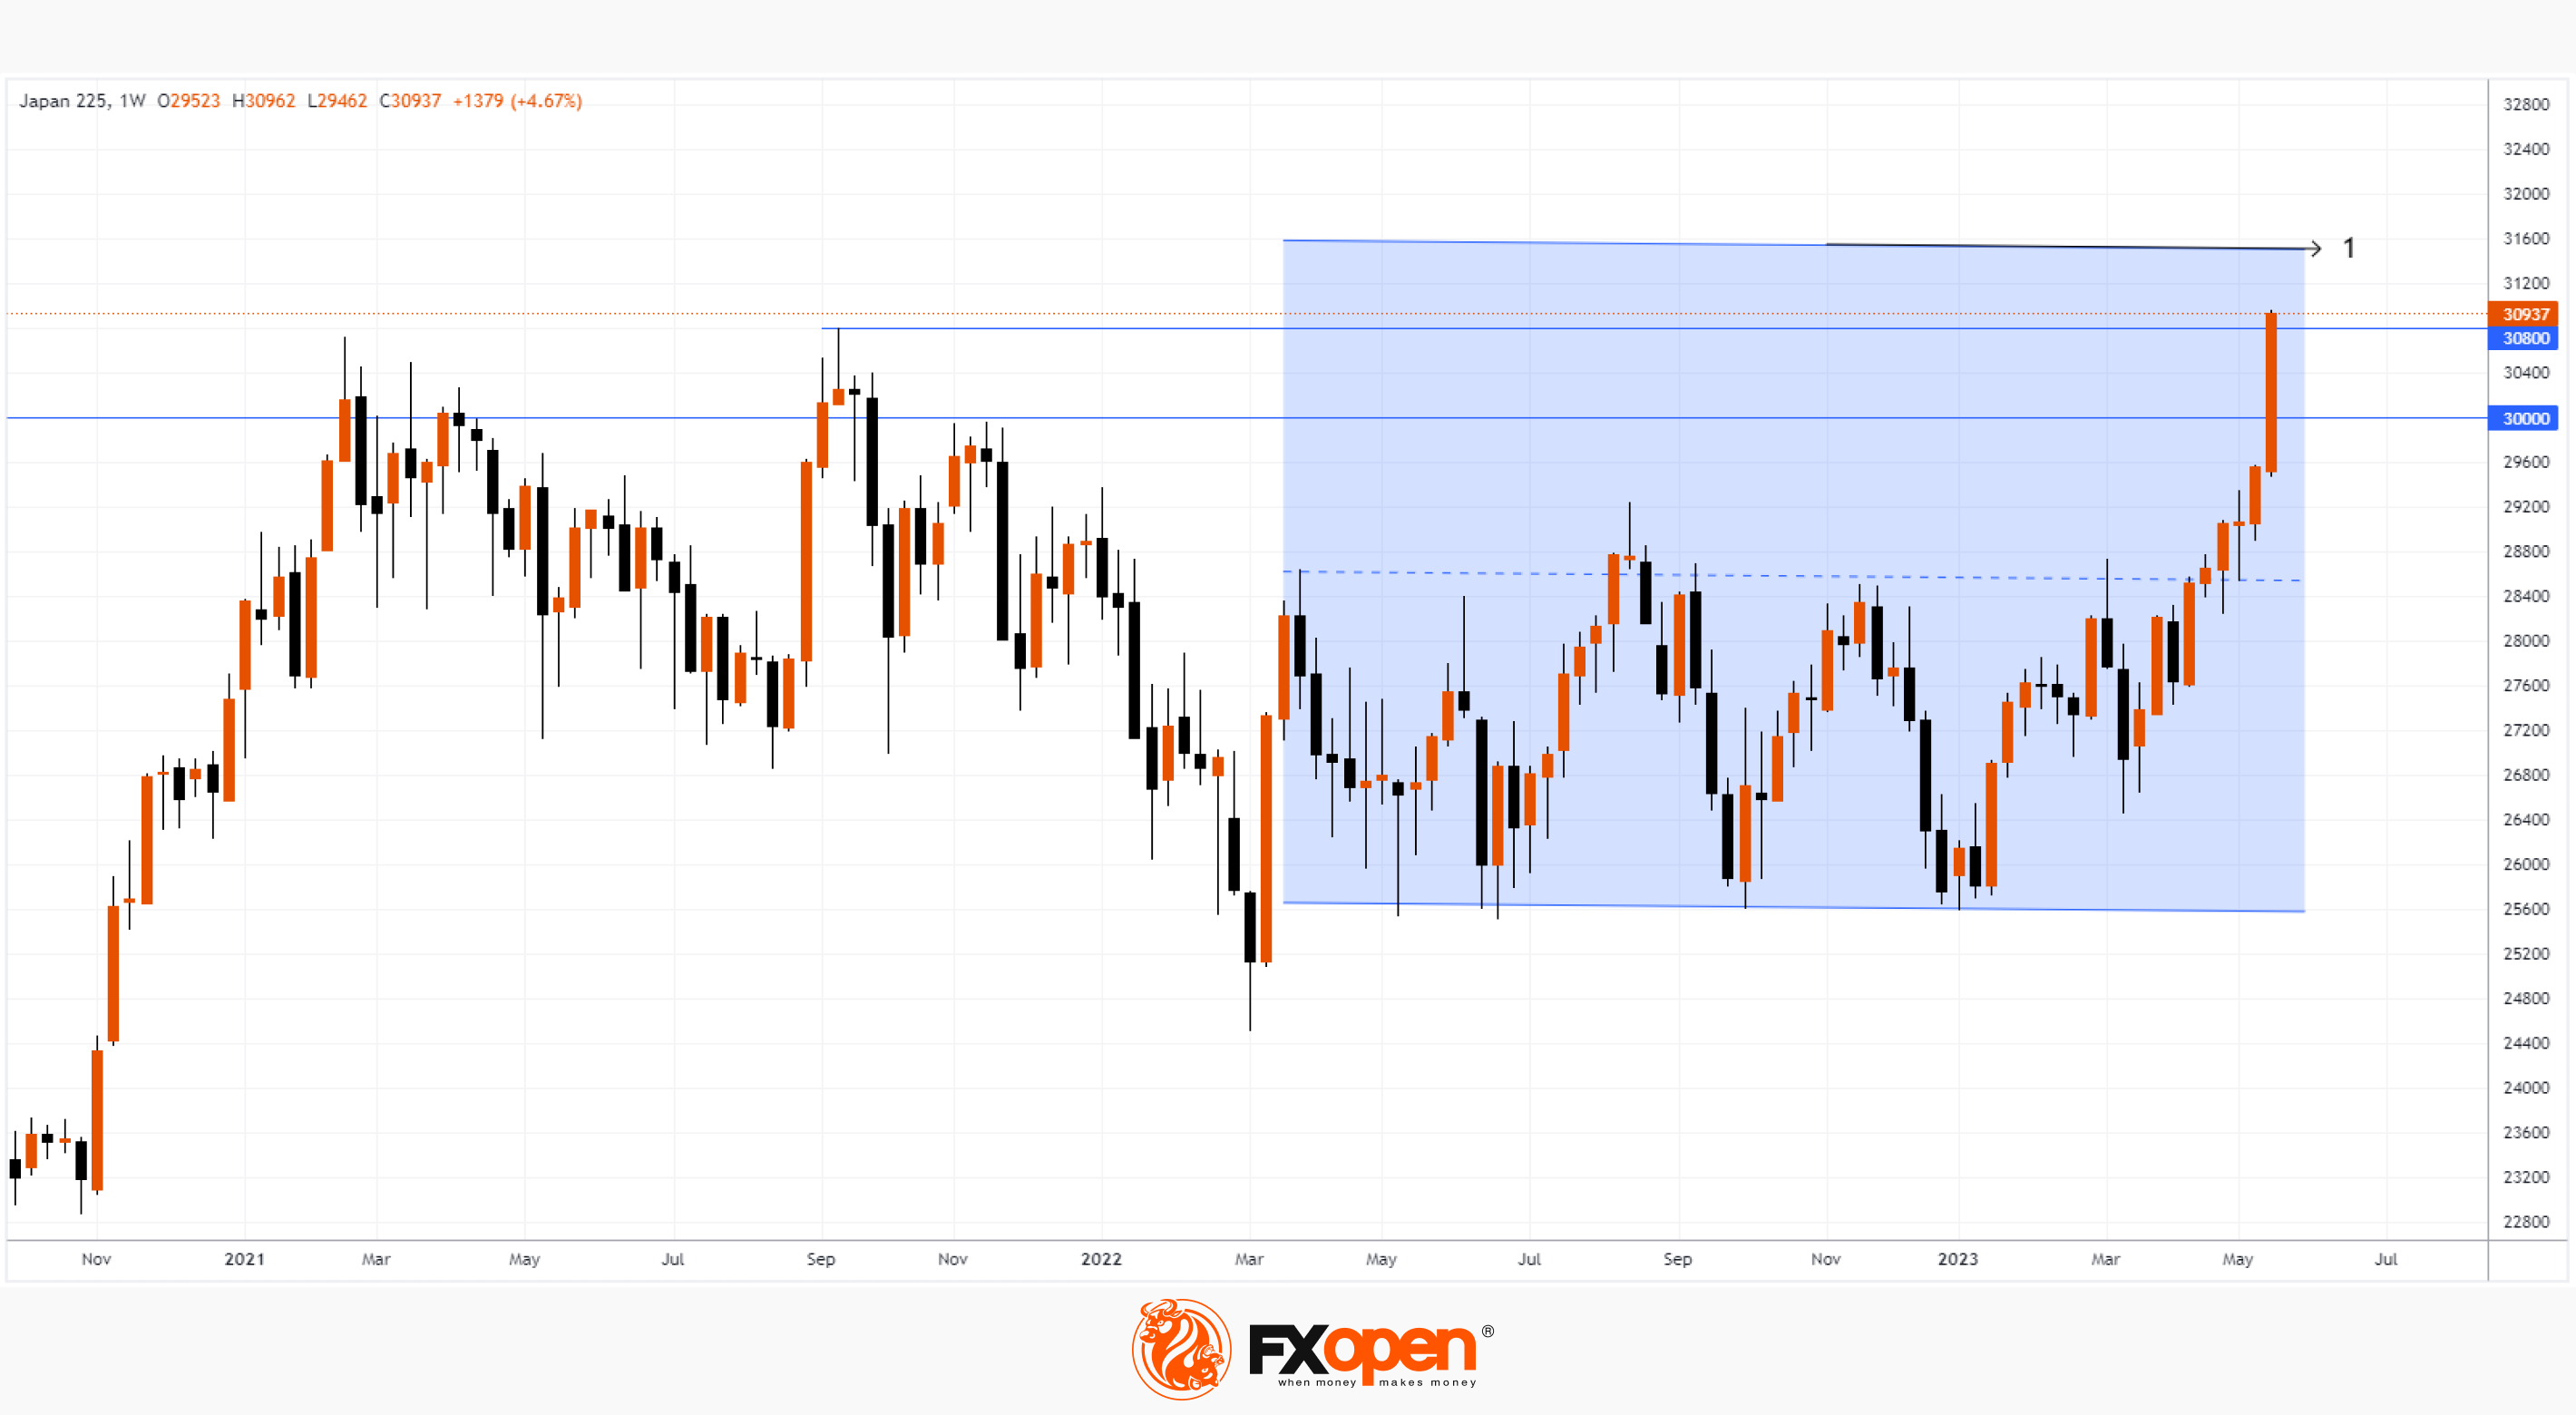
On Friday, the Japanese stock market index Nikkei 225 once again updated the maximum of the year. During this week, the bulls have overcome:
→ the psychological level of USD 30k;
→ the 2022 high around 30,800.
The strong momentum in the Nikkei 225 market is driven by:
→ the weak yen;
→ a strong reporting season for Japanese companies;
→ the news about foreign investment, including Warren Buffett's.
Today's bullish momentum is supported by the latest news that US lawmakers may reach an agreement on a debt ceiling. A bipartisan deal is scheduled to be voted on in the coming days to prevent a default in the US.
The Nikkei 225 chart shows that in case of further growth, the index value may encounter resistance in the 31,500 area — here lies the line (1) of the parallel channel, which is built on a series of important extremes in 2022-2023. At the same time, reasonable investors can take advantage of optimism to take profits on longs.
To take advantage of trends in the world's stock markets, consider enlisting the services of a reliable broker like FXOpen.
⚠️
CFDs are complex instruments and come with a high risk of losing your money.
This article represents the opinion of the Companies operating under the FXOpen brand only. It is not to be construed as an offer, solicitation, or recommendation with respect to products and services provided by the Companies operating under the FXOpen brand, nor is it to be considered financial advice.
Nikkei 225 Heading Towards the Peak of the 1990s Bubble
On Friday, the Japanese stock market index Nikkei 225 once again updated the maximum of the year. During this week, the bulls have overcome:
→ the psychological level of USD 30k;
→ the 2022 high around 30,800.
The strong momentum in the Nikkei 225 market is driven by:
→ the weak yen;
→ a strong reporting season for Japanese companies;
→ the news about foreign investment, including Warren Buffett's.
Today's bullish momentum is supported by the latest news that US lawmakers may reach an agreement on a debt ceiling. A bipartisan deal is scheduled to be voted on in the coming days to prevent a default in the US.
The Nikkei 225 chart shows that in case of further growth, the index value may encounter resistance in the 31,500 area — here lies the line (1) of the parallel channel, which is built on a series of important extremes in 2022-2023. At the same time, reasonable investors can take advantage of optimism to take profits on longs.
To take advantage of trends in the world's stock markets, consider enlisting the services of a reliable broker like FXOpen.
⚠️
CFDs are complex instruments and come with a high risk of losing your money.
This article represents the opinion of the Companies operating under the FXOpen brand only. It is not to be construed as an offer, solicitation, or recommendation with respect to products and services provided by the Companies operating under the FXOpen brand, nor is it to be considered financial advice.
👍1
#MarketNews
An Important Bullish Breakout in the Natural Gas Market
The price of natural gas in USD rose sharply on Thursday after the US Energy Information Administration (EIA) reported a slightly smaller-than-expected weekly increase in domestic natural gas inventories.
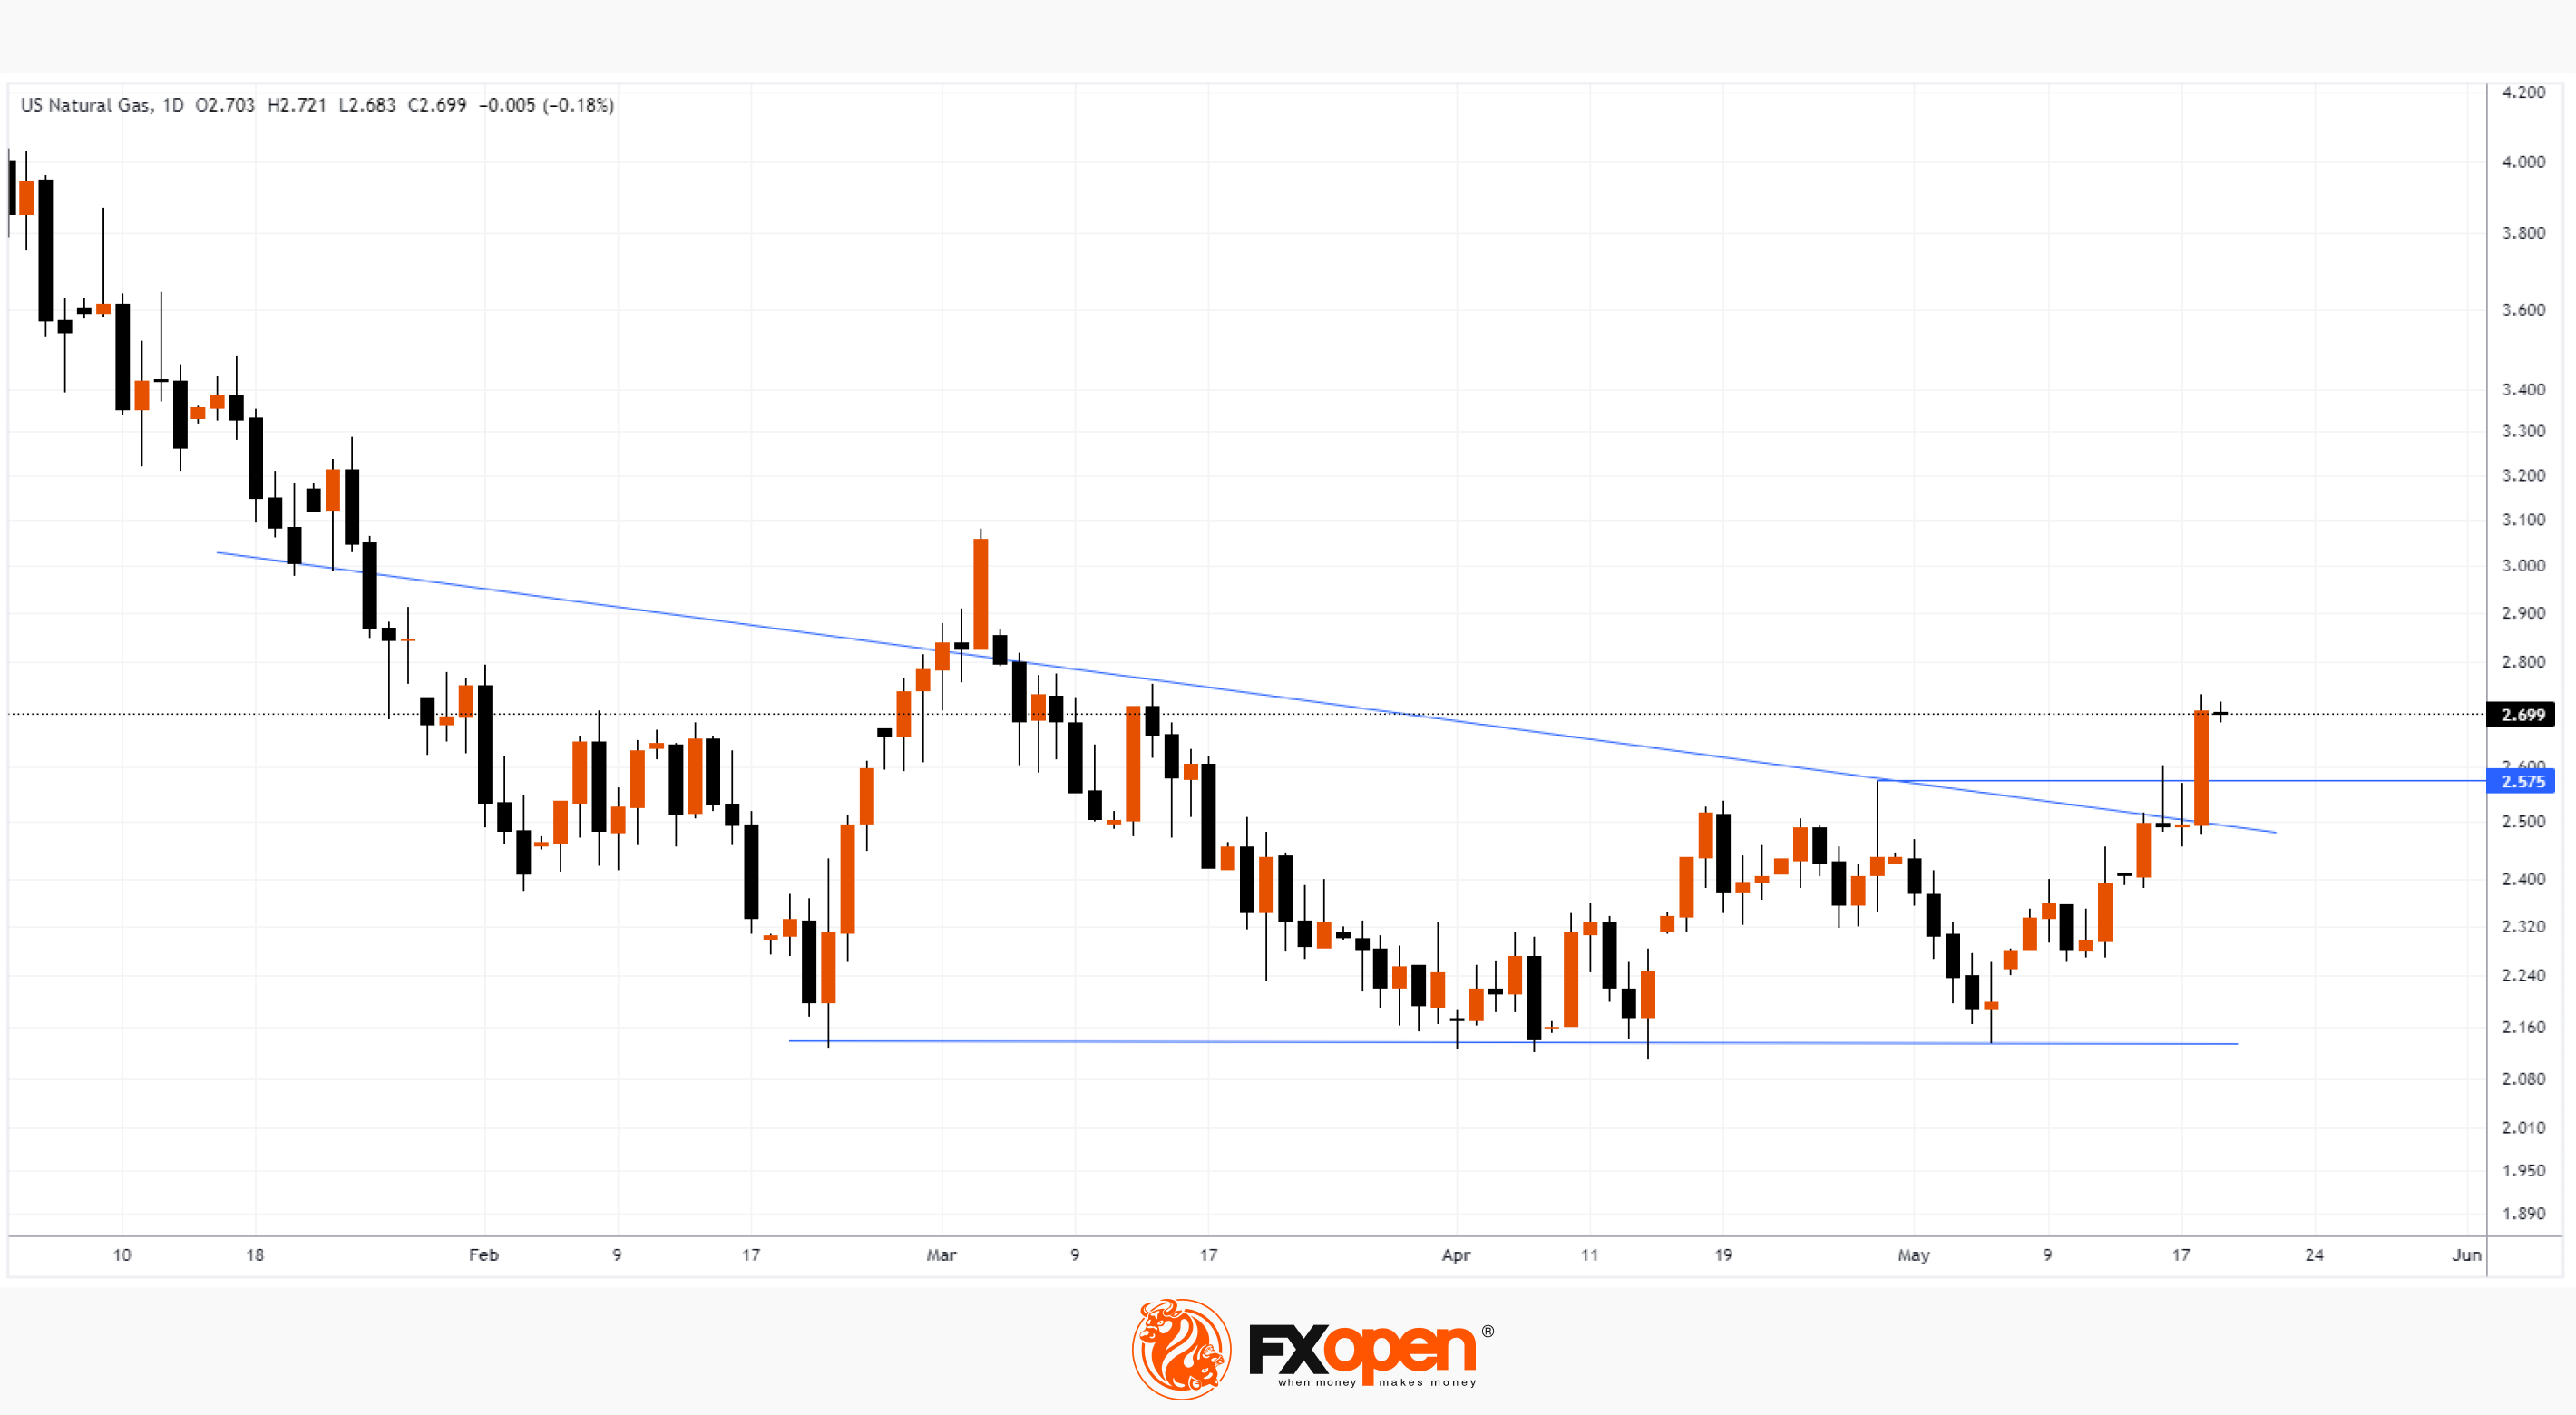
At the same time, an important breakdown of the contracting triangle pattern formed by 2 lines (shown in blue) has formed on the XNG/USD natural gas chart.
Presumably, this triangle delineates a market stage in which large players could accumulate long positions at low prices after the downtrend that has been in place in the natural gas market since the beginning of 2023.
On Friday morning, the bulls are able to keep the progress made, keeping the price of XNG above the former resistance at 2.575, which can now serve as support.
This breakdown may become a stage in the development of an important bullish trend. We previously reported that according to EIA forecasts, the average price of natural gas in 2023 could exceed USD 4.
To take advantage of trends in the natural gas market and other commodities, consider enlisting the services of a reliable broker like FXOpen.
⚠️
CFDs are complex instruments and come with a high risk of losing your money.
This article represents the opinion of the Companies operating under the FXOpen brand only. It is not to be construed as an offer, solicitation, or recommendation with respect to products and services provided by the Companies operating under the FXOpen brand, nor is it to be considered financial advice.
An Important Bullish Breakout in the Natural Gas Market
The price of natural gas in USD rose sharply on Thursday after the US Energy Information Administration (EIA) reported a slightly smaller-than-expected weekly increase in domestic natural gas inventories.
At the same time, an important breakdown of the contracting triangle pattern formed by 2 lines (shown in blue) has formed on the XNG/USD natural gas chart.
Presumably, this triangle delineates a market stage in which large players could accumulate long positions at low prices after the downtrend that has been in place in the natural gas market since the beginning of 2023.
On Friday morning, the bulls are able to keep the progress made, keeping the price of XNG above the former resistance at 2.575, which can now serve as support.
This breakdown may become a stage in the development of an important bullish trend. We previously reported that according to EIA forecasts, the average price of natural gas in 2023 could exceed USD 4.
To take advantage of trends in the natural gas market and other commodities, consider enlisting the services of a reliable broker like FXOpen.
⚠️
CFDs are complex instruments and come with a high risk of losing your money.
This article represents the opinion of the Companies operating under the FXOpen brand only. It is not to be construed as an offer, solicitation, or recommendation with respect to products and services provided by the Companies operating under the FXOpen brand, nor is it to be considered financial advice.
#MarketNews #bitcoin
Happy Bitcoin Pizza Day!
Exactly 13 years ago, programmer Laszlo Heinitz, for the first time in history, paid for a real product with bitcoins — two Papa John's mushroom pizzas with sausages, tomatoes and onions. The purchase cost him “only” 10k bitcoins (25 USD at the exchange rate at that time, almost $270 million at the current price of 1 bitcoin in US dollars).
Then cryptocurrencies were practically unknown, now they are being discussed at the G7 summit. At a meeting in Japan, the leaders agreed to continue consultations on how to regulate digital assets.
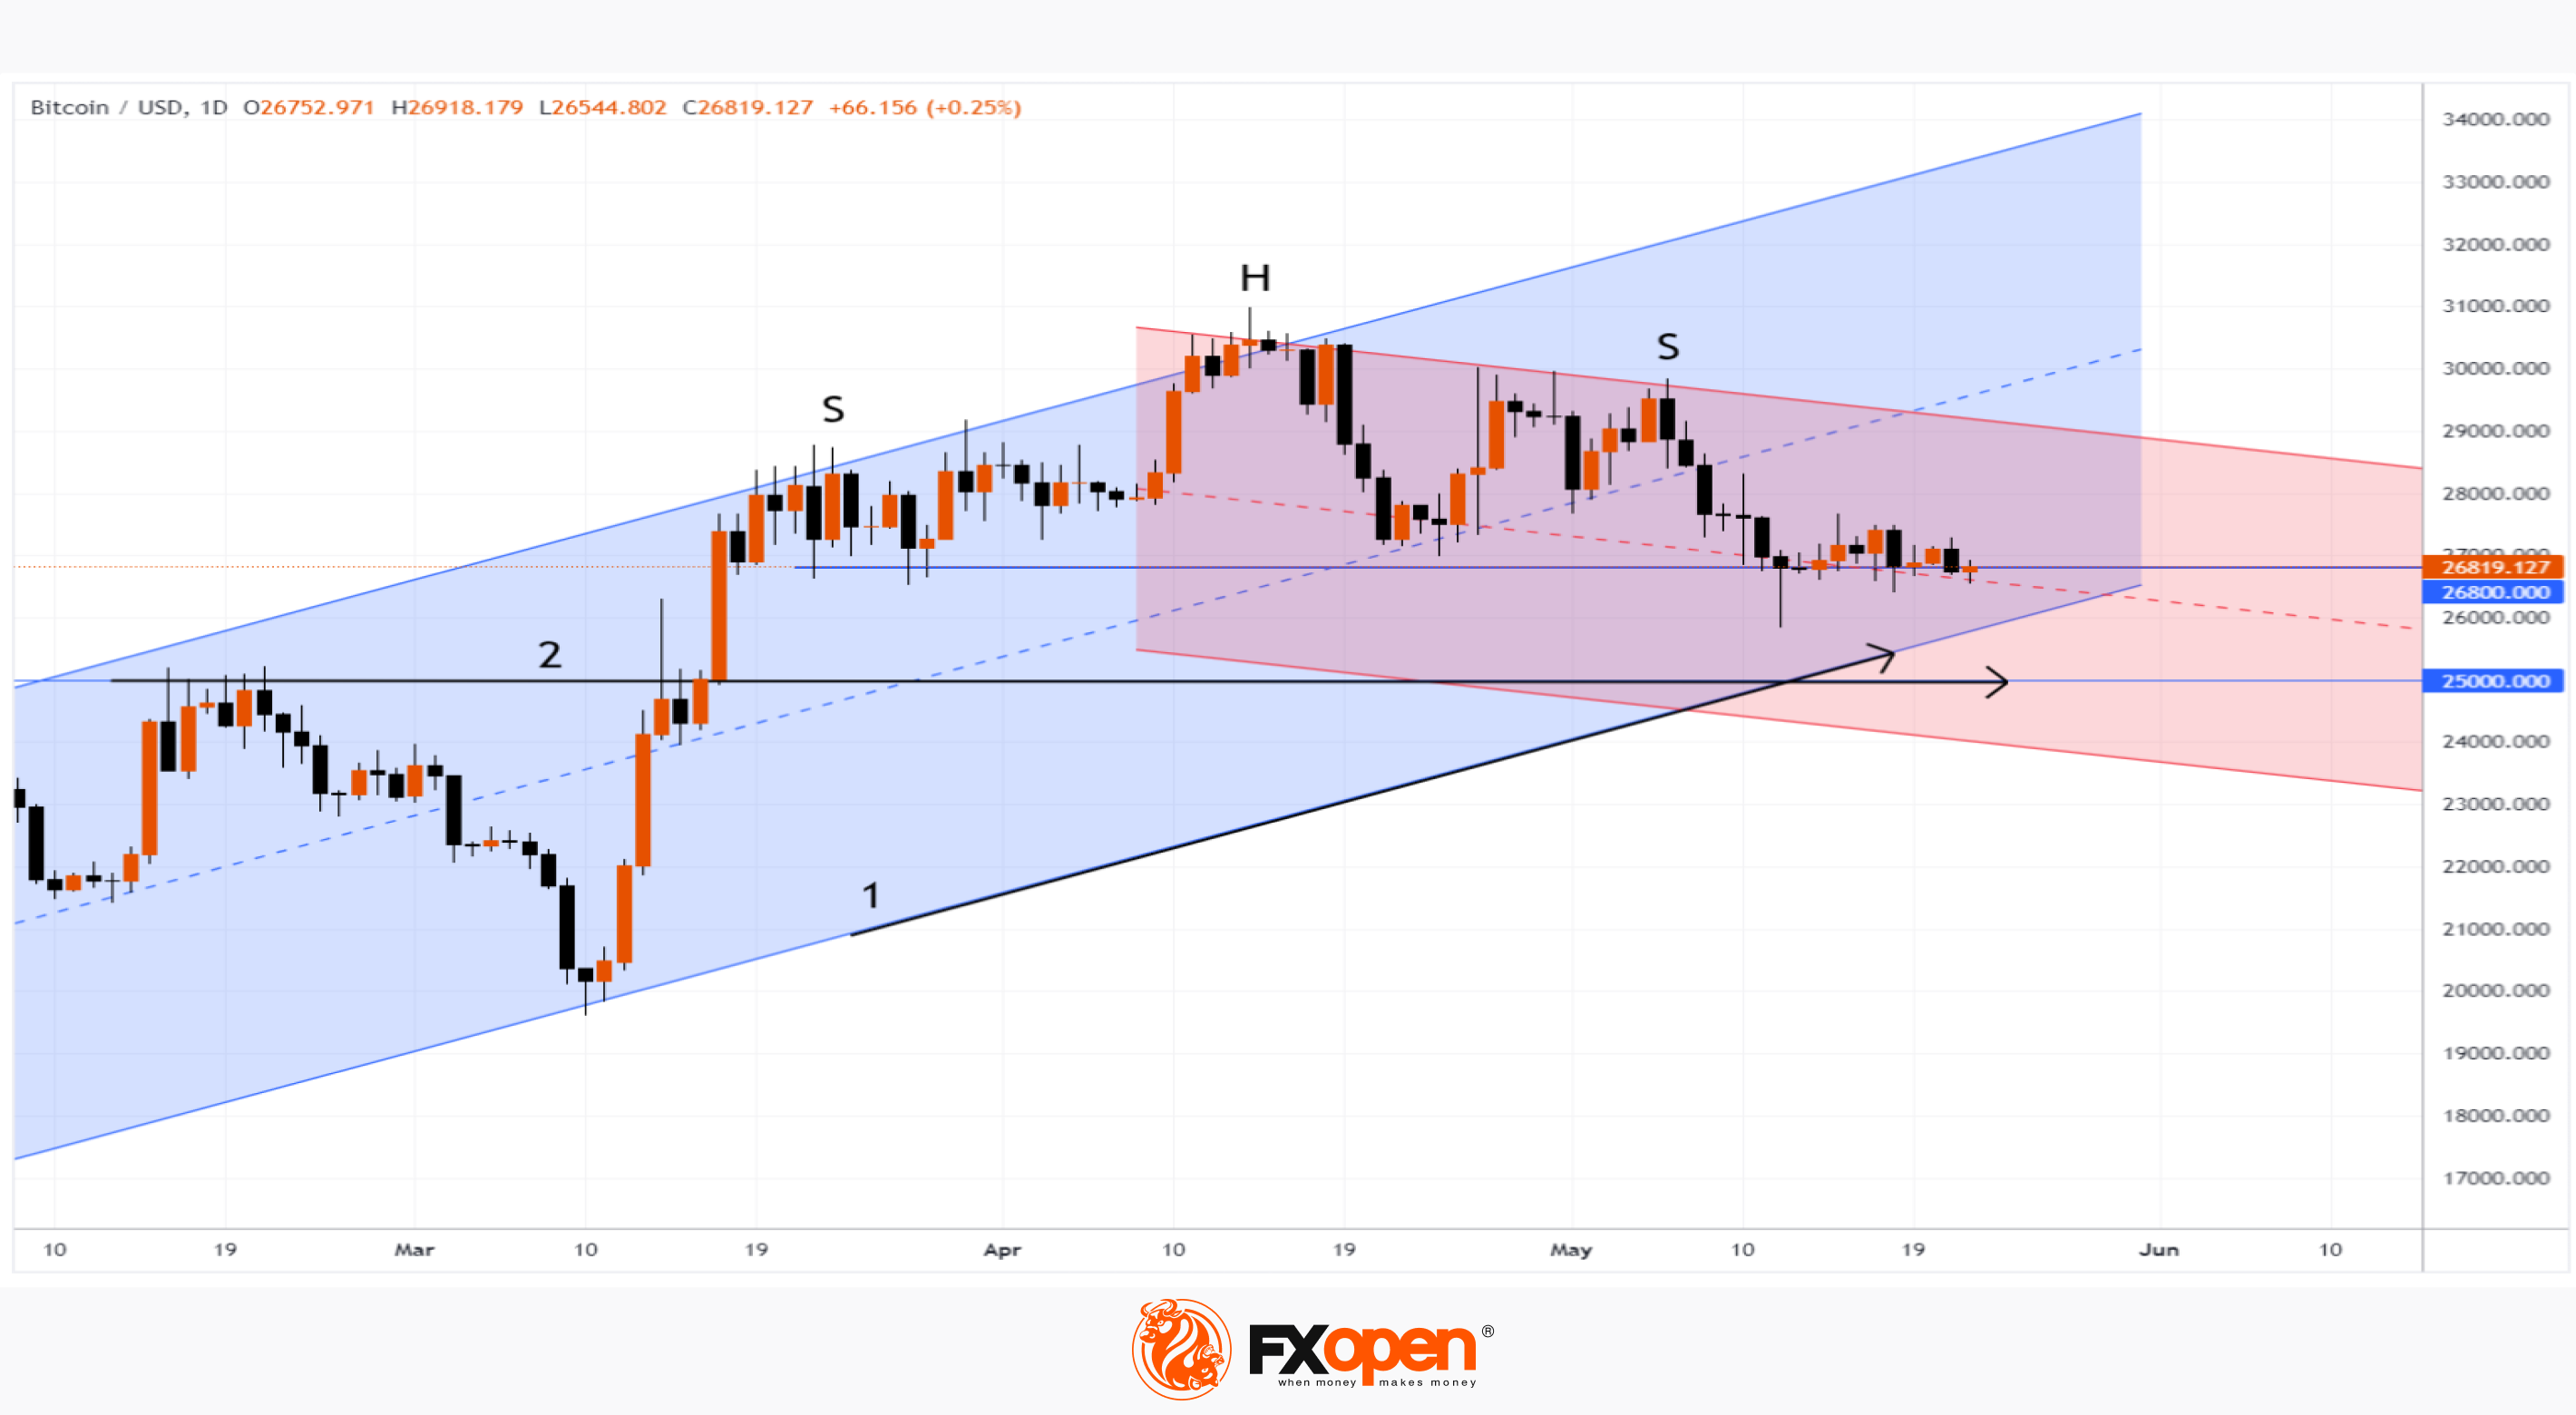
Meanwhile, bitcoin traders are looking with apprehension at the BTC/USD chart, which is forming a bearish head and shoulders (SHS) pattern. According to the classics of technical analysis, the breakdown of the “neck” level around 26,800 can lead to a downtrend. However, for this, sellers will have to apply serious pressure to overcome the support from the bottom line (1) of the ascending channel and the psychological mark (2) of USD 25k per bitcoin.
Your reliable broker FXOpen wishes you the best of luck with your transactions in the cryptocurrency markets.
⚠️
CFDs are complex instruments and come with a high risk of losing your money.
This article represents the opinion of the Companies operating under the FXOpen brand only. It is not to be construed as an offer, solicitation, or recommendation with respect to products and services provided by the Companies operating under the FXOpen brand, nor is it to be considered financial advice.
At FXOpen UK and FXOpen AU, Cryptocurrency CFDs are only available for trading by those clients categorised as Professional clients under FCA Rules and Professional clients under ASIC Rules, respectively. They are not available for trading by Retail clients.
Happy Bitcoin Pizza Day!
Exactly 13 years ago, programmer Laszlo Heinitz, for the first time in history, paid for a real product with bitcoins — two Papa John's mushroom pizzas with sausages, tomatoes and onions. The purchase cost him “only” 10k bitcoins (25 USD at the exchange rate at that time, almost $270 million at the current price of 1 bitcoin in US dollars).
Then cryptocurrencies were practically unknown, now they are being discussed at the G7 summit. At a meeting in Japan, the leaders agreed to continue consultations on how to regulate digital assets.
Meanwhile, bitcoin traders are looking with apprehension at the BTC/USD chart, which is forming a bearish head and shoulders (SHS) pattern. According to the classics of technical analysis, the breakdown of the “neck” level around 26,800 can lead to a downtrend. However, for this, sellers will have to apply serious pressure to overcome the support from the bottom line (1) of the ascending channel and the psychological mark (2) of USD 25k per bitcoin.
Your reliable broker FXOpen wishes you the best of luck with your transactions in the cryptocurrency markets.
⚠️
CFDs are complex instruments and come with a high risk of losing your money.
This article represents the opinion of the Companies operating under the FXOpen brand only. It is not to be construed as an offer, solicitation, or recommendation with respect to products and services provided by the Companies operating under the FXOpen brand, nor is it to be considered financial advice.
At FXOpen UK and FXOpen AU, Cryptocurrency CFDs are only available for trading by those clients categorised as Professional clients under FCA Rules and Professional clients under ASIC Rules, respectively. They are not available for trading by Retail clients.
#MarketNews #forex
Market Analysis: GBP/USD Struggles Below 1.2500 While EUR/GBP Remains at Risk
🔸 The British Pound is trading in a bearish zone below 1.2500 against the US Dollar.
🔸 There was a break above a key bearish trend line with resistance near 1.2445 on the hourly chart of GBP/USD at FXOpen.
🔸 EUR/GBP started a fresh decline from the 0.8710 resistance zone.
🔸 There is a major bearish trend line forming with resistance near 0.8700 on the hourly chart at FXOpen.
https://cutt.ly/jwqupw7u
To take advantage of price fluctuations in the foreign exchange markets, consider enlisting the services of a reliable broker like FXOpen.
⚠️
This forecast represents FXOpen Companies opinion only, it should not be construed as an offer, invitation or recommendation in respect to FXOpen Companies products and services or as financial advice
Market Analysis: GBP/USD Struggles Below 1.2500 While EUR/GBP Remains at Risk
🔸 The British Pound is trading in a bearish zone below 1.2500 against the US Dollar.
🔸 There was a break above a key bearish trend line with resistance near 1.2445 on the hourly chart of GBP/USD at FXOpen.
🔸 EUR/GBP started a fresh decline from the 0.8710 resistance zone.
🔸 There is a major bearish trend line forming with resistance near 0.8700 on the hourly chart at FXOpen.
https://cutt.ly/jwqupw7u
To take advantage of price fluctuations in the foreign exchange markets, consider enlisting the services of a reliable broker like FXOpen.
⚠️
This forecast represents FXOpen Companies opinion only, it should not be construed as an offer, invitation or recommendation in respect to FXOpen Companies products and services or as financial advice
Market Pulse
GBP/USD Struggles Below 1.2500 While EUR/GBP Remains at Risk
GBP/USD is struggling to clear the 1.2500 resistance zone. EUR/GBP is now consolidating losses below the 0.8700 resistance.
#MarketNews #stockmarket
AMD Share Price Breaks August 2022 High
It happened last week. Since the beginning of 2023, AMD's share price has risen by 66%. According to technical analysts at Bank of America, AMD's share price has a bullish outlook; interestingly, just 2 weeks ago, the bank downgraded the stock.
According to analysts polled by the WSJ, AMD's average target price for a share is USD 102.68, which is below current levels.
How can the price of Advanced Micro Devices stock change?
From the point of view of technical analysis of AMD shares, the following barriers to continued growth can occur:
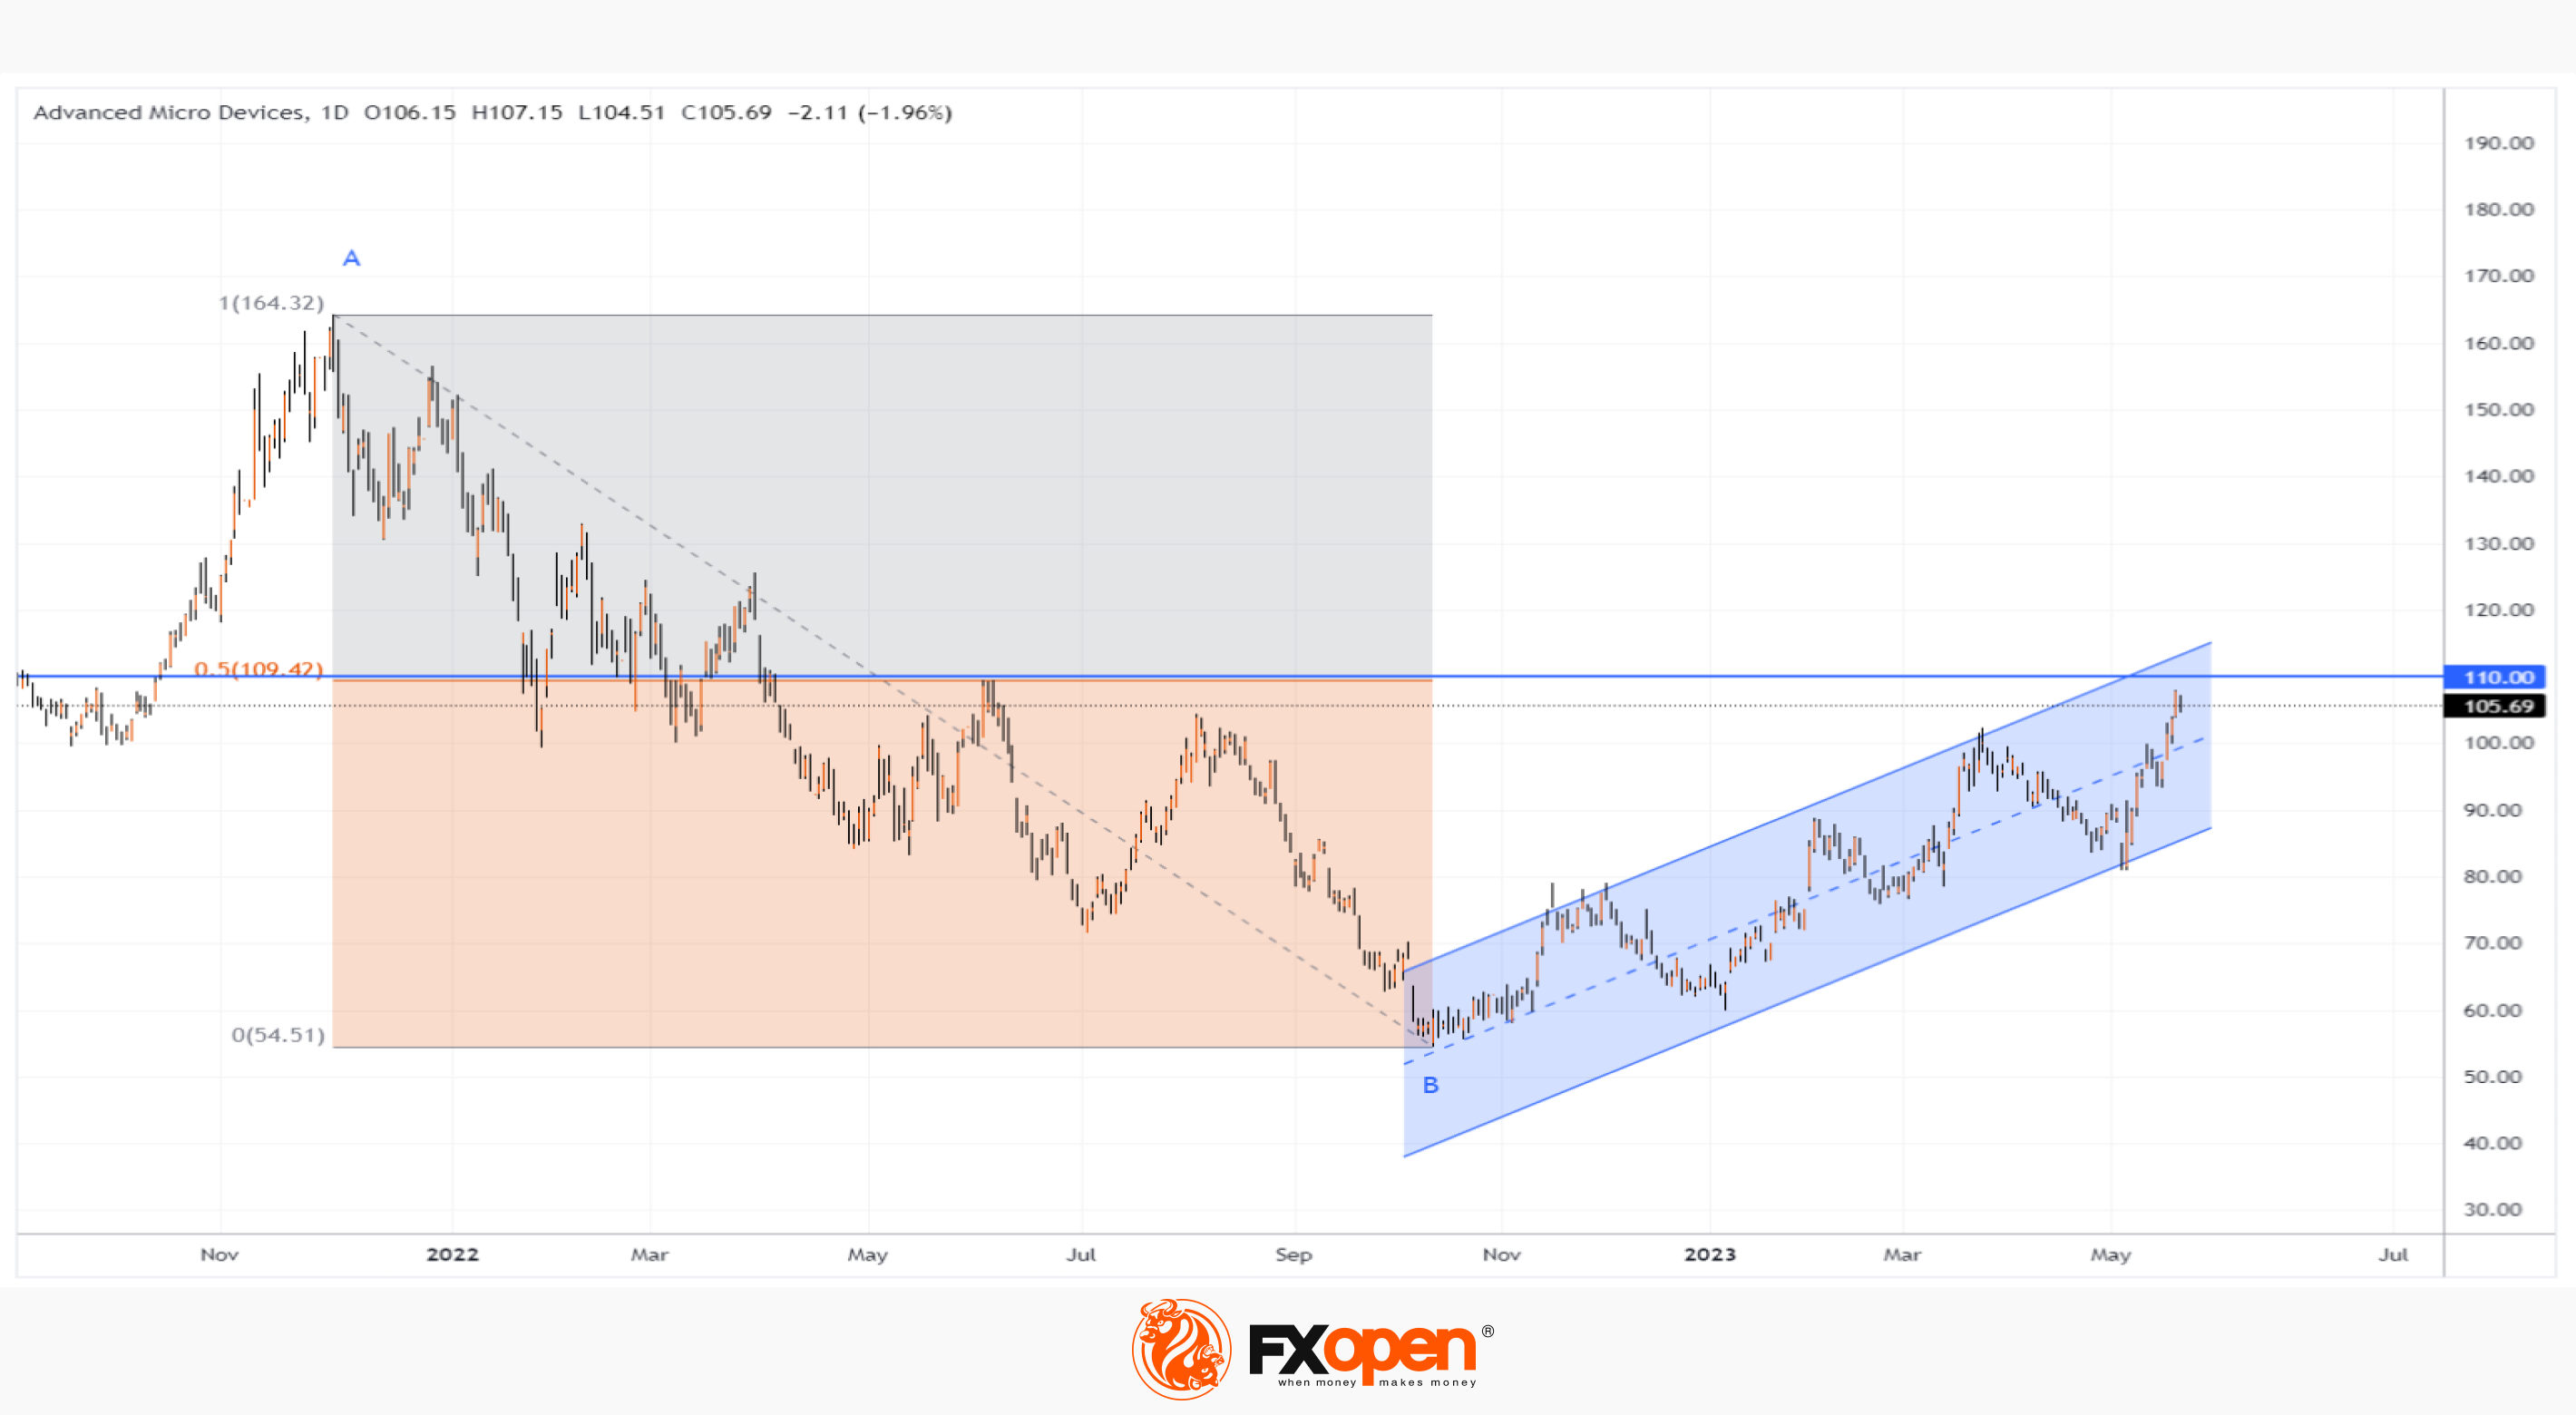
→ the level of 109.42, which is 50% of the decline in A→B;
→ the psychological level of USD 110;
→ the upper line of the ascending channel (shown in blue).
It is also worth noting the unfavorable fundamental background, where the news about raising the US national debt ceiling comes to the fore. ECB President Christine Lagarde on Sunday appealed to US politicians to resolve the conflict. And Treasury Secretary Janet Yellen told NBC that the US is unlikely to survive until mid-June still able to pay its bills.
Therefore, if the AMD stock chart pulls back — for instance, to the lower border of the blue ascending channel — this should not come as a surprise.
To take advantage of trends in the stock markets of popular companies, consider enlisting the services of a reliable broker like FXOpen.
⚠️
CFDs are complex instruments and come with a high risk of losing your money.
This article represents the opinion of the Companies operating under the FXOpen brand only. It is not to be construed as an offer, solicitation, or recommendation with respect to products and services provided by the Companies operating under the FXOpen brand, nor is it to be considered financial advice.
AMD Share Price Breaks August 2022 High
It happened last week. Since the beginning of 2023, AMD's share price has risen by 66%. According to technical analysts at Bank of America, AMD's share price has a bullish outlook; interestingly, just 2 weeks ago, the bank downgraded the stock.
According to analysts polled by the WSJ, AMD's average target price for a share is USD 102.68, which is below current levels.
How can the price of Advanced Micro Devices stock change?
From the point of view of technical analysis of AMD shares, the following barriers to continued growth can occur:
→ the level of 109.42, which is 50% of the decline in A→B;
→ the psychological level of USD 110;
→ the upper line of the ascending channel (shown in blue).
It is also worth noting the unfavorable fundamental background, where the news about raising the US national debt ceiling comes to the fore. ECB President Christine Lagarde on Sunday appealed to US politicians to resolve the conflict. And Treasury Secretary Janet Yellen told NBC that the US is unlikely to survive until mid-June still able to pay its bills.
Therefore, if the AMD stock chart pulls back — for instance, to the lower border of the blue ascending channel — this should not come as a surprise.
To take advantage of trends in the stock markets of popular companies, consider enlisting the services of a reliable broker like FXOpen.
⚠️
CFDs are complex instruments and come with a high risk of losing your money.
This article represents the opinion of the Companies operating under the FXOpen brand only. It is not to be construed as an offer, solicitation, or recommendation with respect to products and services provided by the Companies operating under the FXOpen brand, nor is it to be considered financial advice.
#MarketNews #forex
USD/JPY Updates the High of the Year
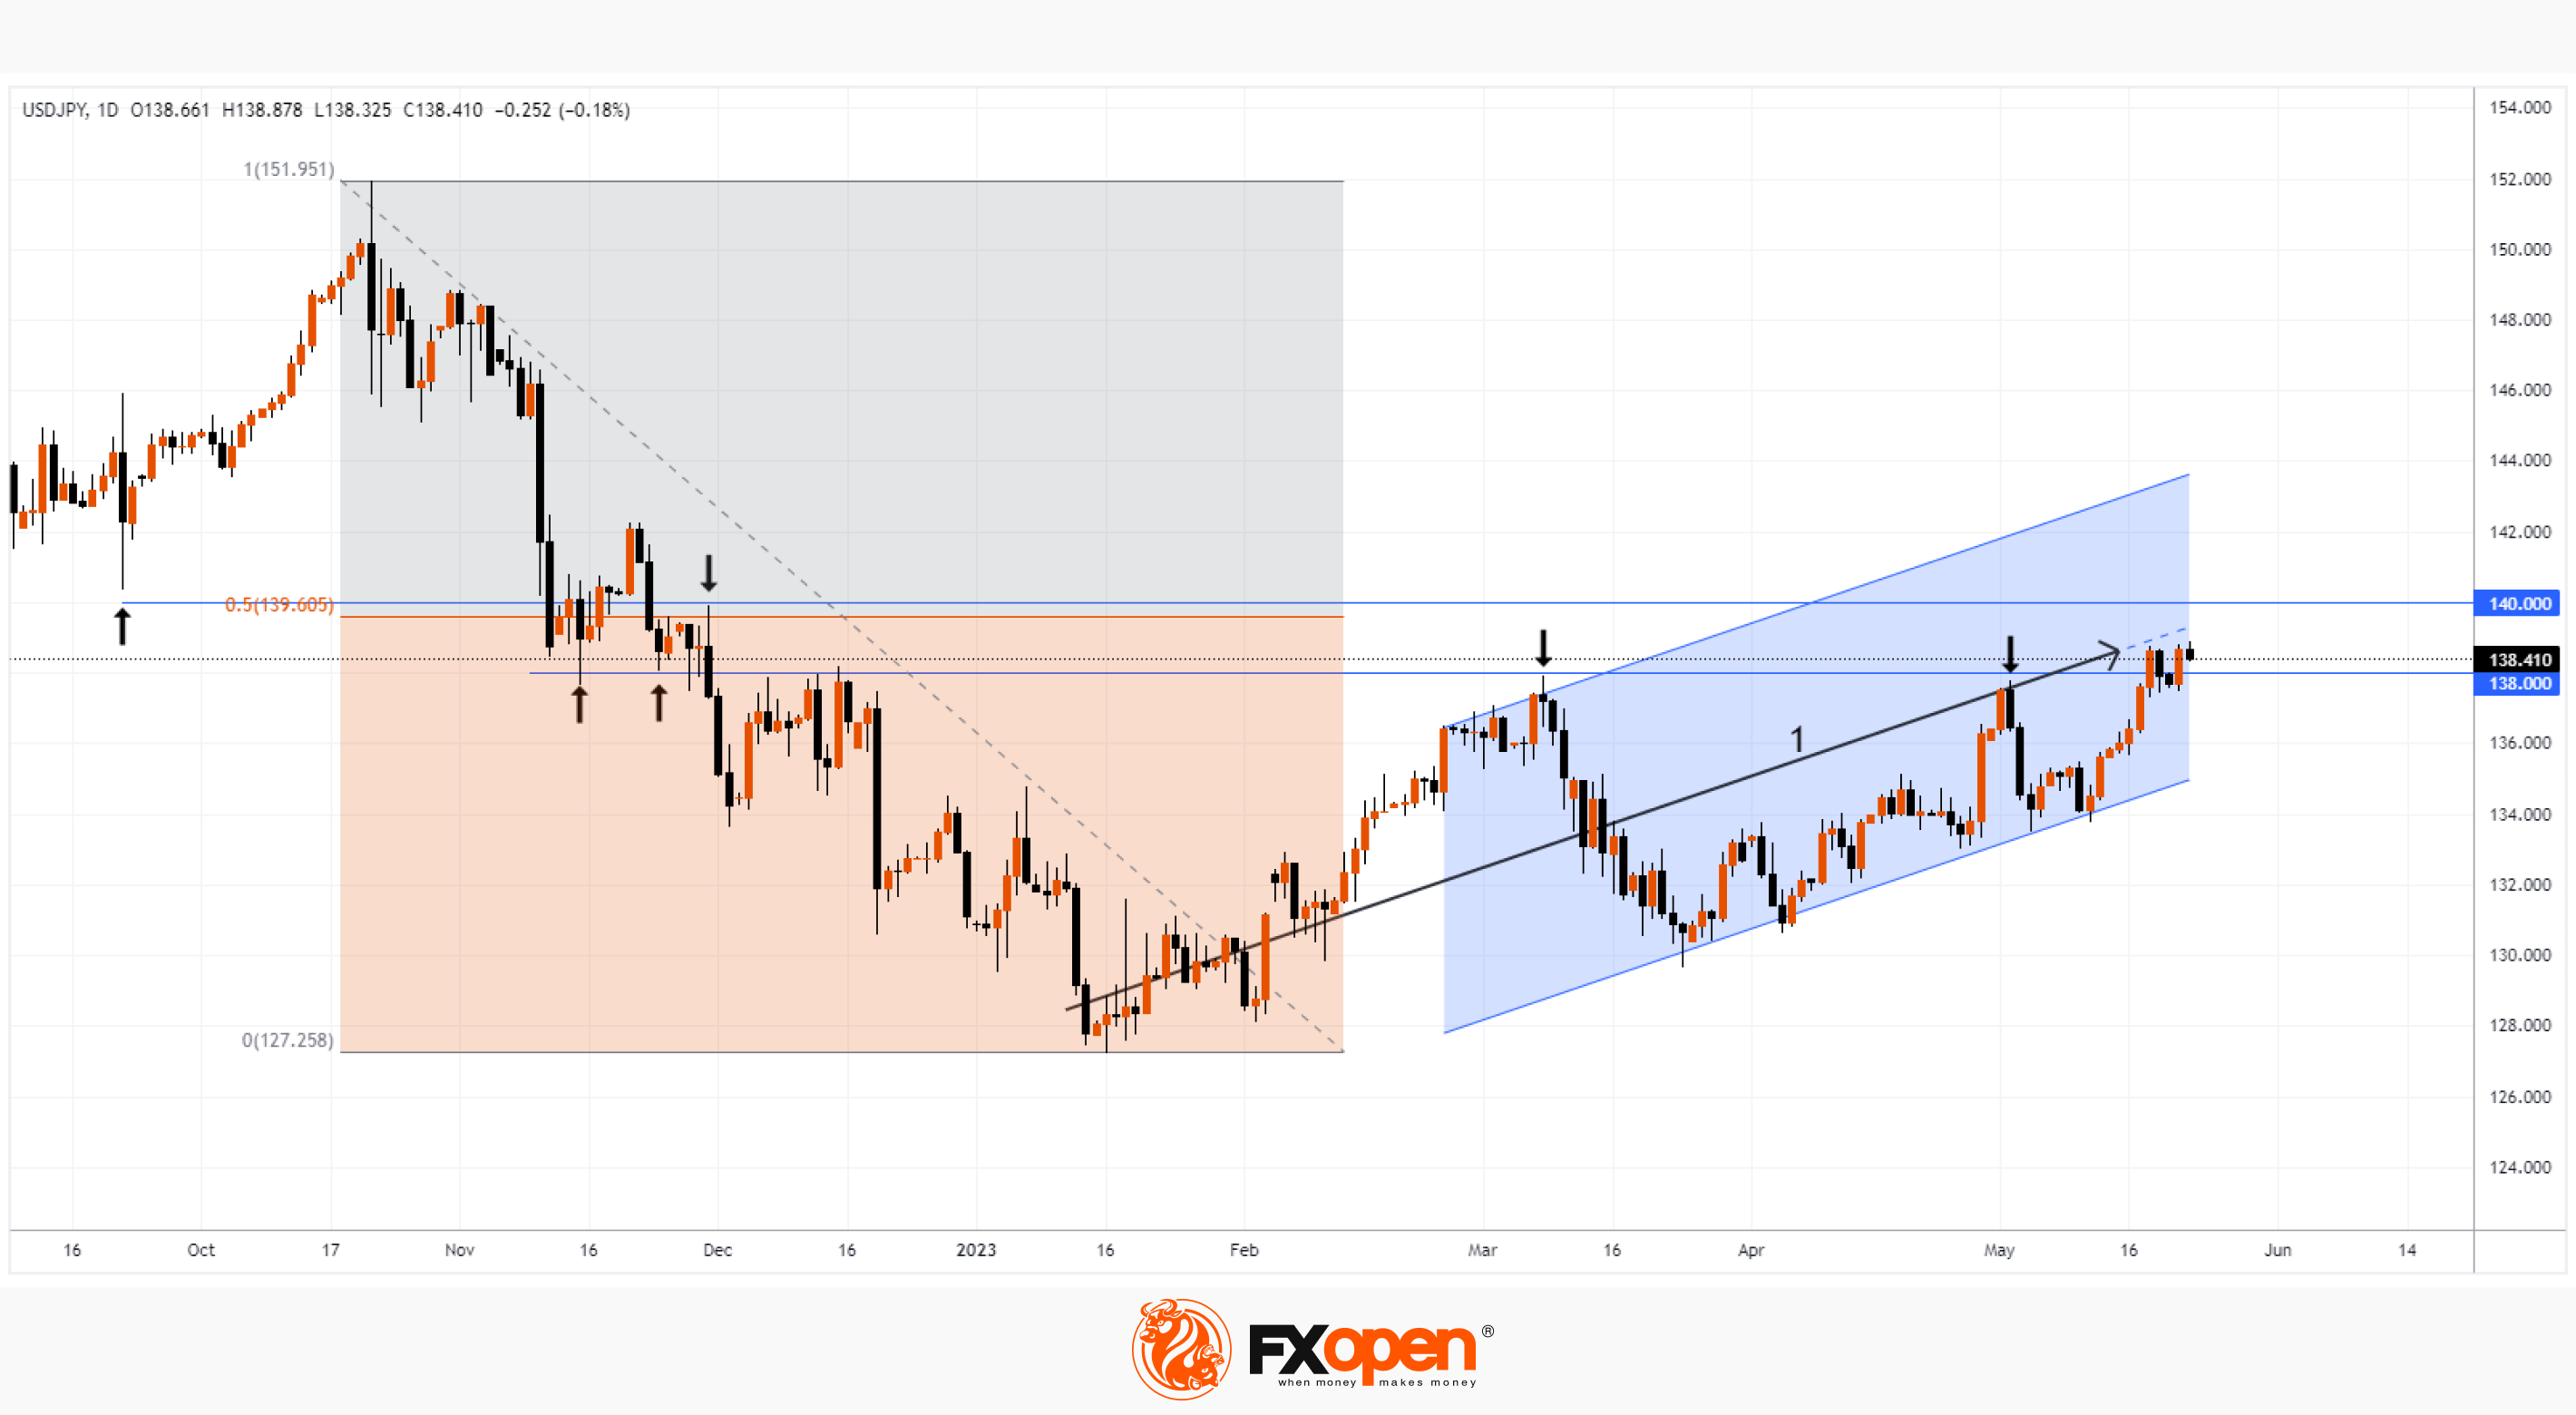
As the USD/JPY chart shows, the Japanese currency exchange rate exceeded 138.8 yen per dollar this morning – the last time such a yen rate against the US dollar was fixed was in November 2022.
The USD/JPY peak was helped by statements from the Fed on Monday, signaling that monetary policy could remain tight for a long time to bring inflation back to the 2% target.
Based on the technical analysis of the USD/JPY pair, it is acceptable to assume that the rate may roll back, as the bulls are hindered by:
→ the presence of offers above the level of 138.0 is noticeable by the bearish candle on Friday;
→ approaching the psychological level of 140 yen per US dollar;
→ 50% level of decline from October 2022 peaks to January 2023 lows;
→ median line of the ascending channel (1).
To take advantage of fluctuations in USD/JPY and other currencies, consider enlisting the services of a reliable broker like FXOpen.
⚠️
CFDs are complex instruments and come with a high risk of losing your money.
This article represents the opinion of the Companies operating under the FXOpen brand only. It is not to be construed as an offer, solicitation, or recommendation with respect to products and services provided by the Companies operating under the FXOpen brand, nor is it to be considered financial advice.
USD/JPY Updates the High of the Year
As the USD/JPY chart shows, the Japanese currency exchange rate exceeded 138.8 yen per dollar this morning – the last time such a yen rate against the US dollar was fixed was in November 2022.
The USD/JPY peak was helped by statements from the Fed on Monday, signaling that monetary policy could remain tight for a long time to bring inflation back to the 2% target.
Based on the technical analysis of the USD/JPY pair, it is acceptable to assume that the rate may roll back, as the bulls are hindered by:
→ the presence of offers above the level of 138.0 is noticeable by the bearish candle on Friday;
→ approaching the psychological level of 140 yen per US dollar;
→ 50% level of decline from October 2022 peaks to January 2023 lows;
→ median line of the ascending channel (1).
To take advantage of fluctuations in USD/JPY and other currencies, consider enlisting the services of a reliable broker like FXOpen.
⚠️
CFDs are complex instruments and come with a high risk of losing your money.
This article represents the opinion of the Companies operating under the FXOpen brand only. It is not to be construed as an offer, solicitation, or recommendation with respect to products and services provided by the Companies operating under the FXOpen brand, nor is it to be considered financial advice.
#MarketNews #bitcoin #BTCUSD
BTCUSD Analysis: Bullish Harami Pattern Above $26,394
Bitcoin’s price continues its bullish momentum from last week, and after touching a low of USD 26,394 on May 18, we can see a move towards a consolidation phase, after which we are expecting upsides in the range of USD 28500 and USD 29000.
https://cutt.ly/YwqdSg0x
To take advantage of price fluctuations in the foreign exchange markets, consider enlisting the services of a reliable broker like FXOpen.
⚠️
This forecast represents FXOpen Companies opinion only, it should not be construed as an offer, invitation or recommendation in respect to FXOpen Companies products and services or as financial advice
At FXOpen UK and FXOpen AU, Cryptocurrency CFDs are only available for trading by those clients categorised as Professional clients under FCA Rules and Professional clients under ASIC Rules respectively. They are not available for trading by Retail clients.
BTCUSD Analysis: Bullish Harami Pattern Above $26,394
Bitcoin’s price continues its bullish momentum from last week, and after touching a low of USD 26,394 on May 18, we can see a move towards a consolidation phase, after which we are expecting upsides in the range of USD 28500 and USD 29000.
https://cutt.ly/YwqdSg0x
To take advantage of price fluctuations in the foreign exchange markets, consider enlisting the services of a reliable broker like FXOpen.
⚠️
This forecast represents FXOpen Companies opinion only, it should not be construed as an offer, invitation or recommendation in respect to FXOpen Companies products and services or as financial advice
At FXOpen UK and FXOpen AU, Cryptocurrency CFDs are only available for trading by those clients categorised as Professional clients under FCA Rules and Professional clients under ASIC Rules respectively. They are not available for trading by Retail clients.
Market Pulse
BTCUSD Analysis: Bullish Harami Pattern Above $26,394
Bitcoin’s price continues its bullish momentum from last week, and after touching a low of USD 26,394 on May 18, we can see a move towards a consolidation phase
#MarketNews #ftse100
FTSE Drops Rapidly to April Lows Today
The FTSE 100 index is rapidly declining on Wednesday morning amid news of another spike in inflation. The Core CPI (excluding energy, food and tobacco prices) reached 6.8%, the highest in over 30 years. Market participants are now almost certain that the Bank of England will raise interest rates at its next meeting.
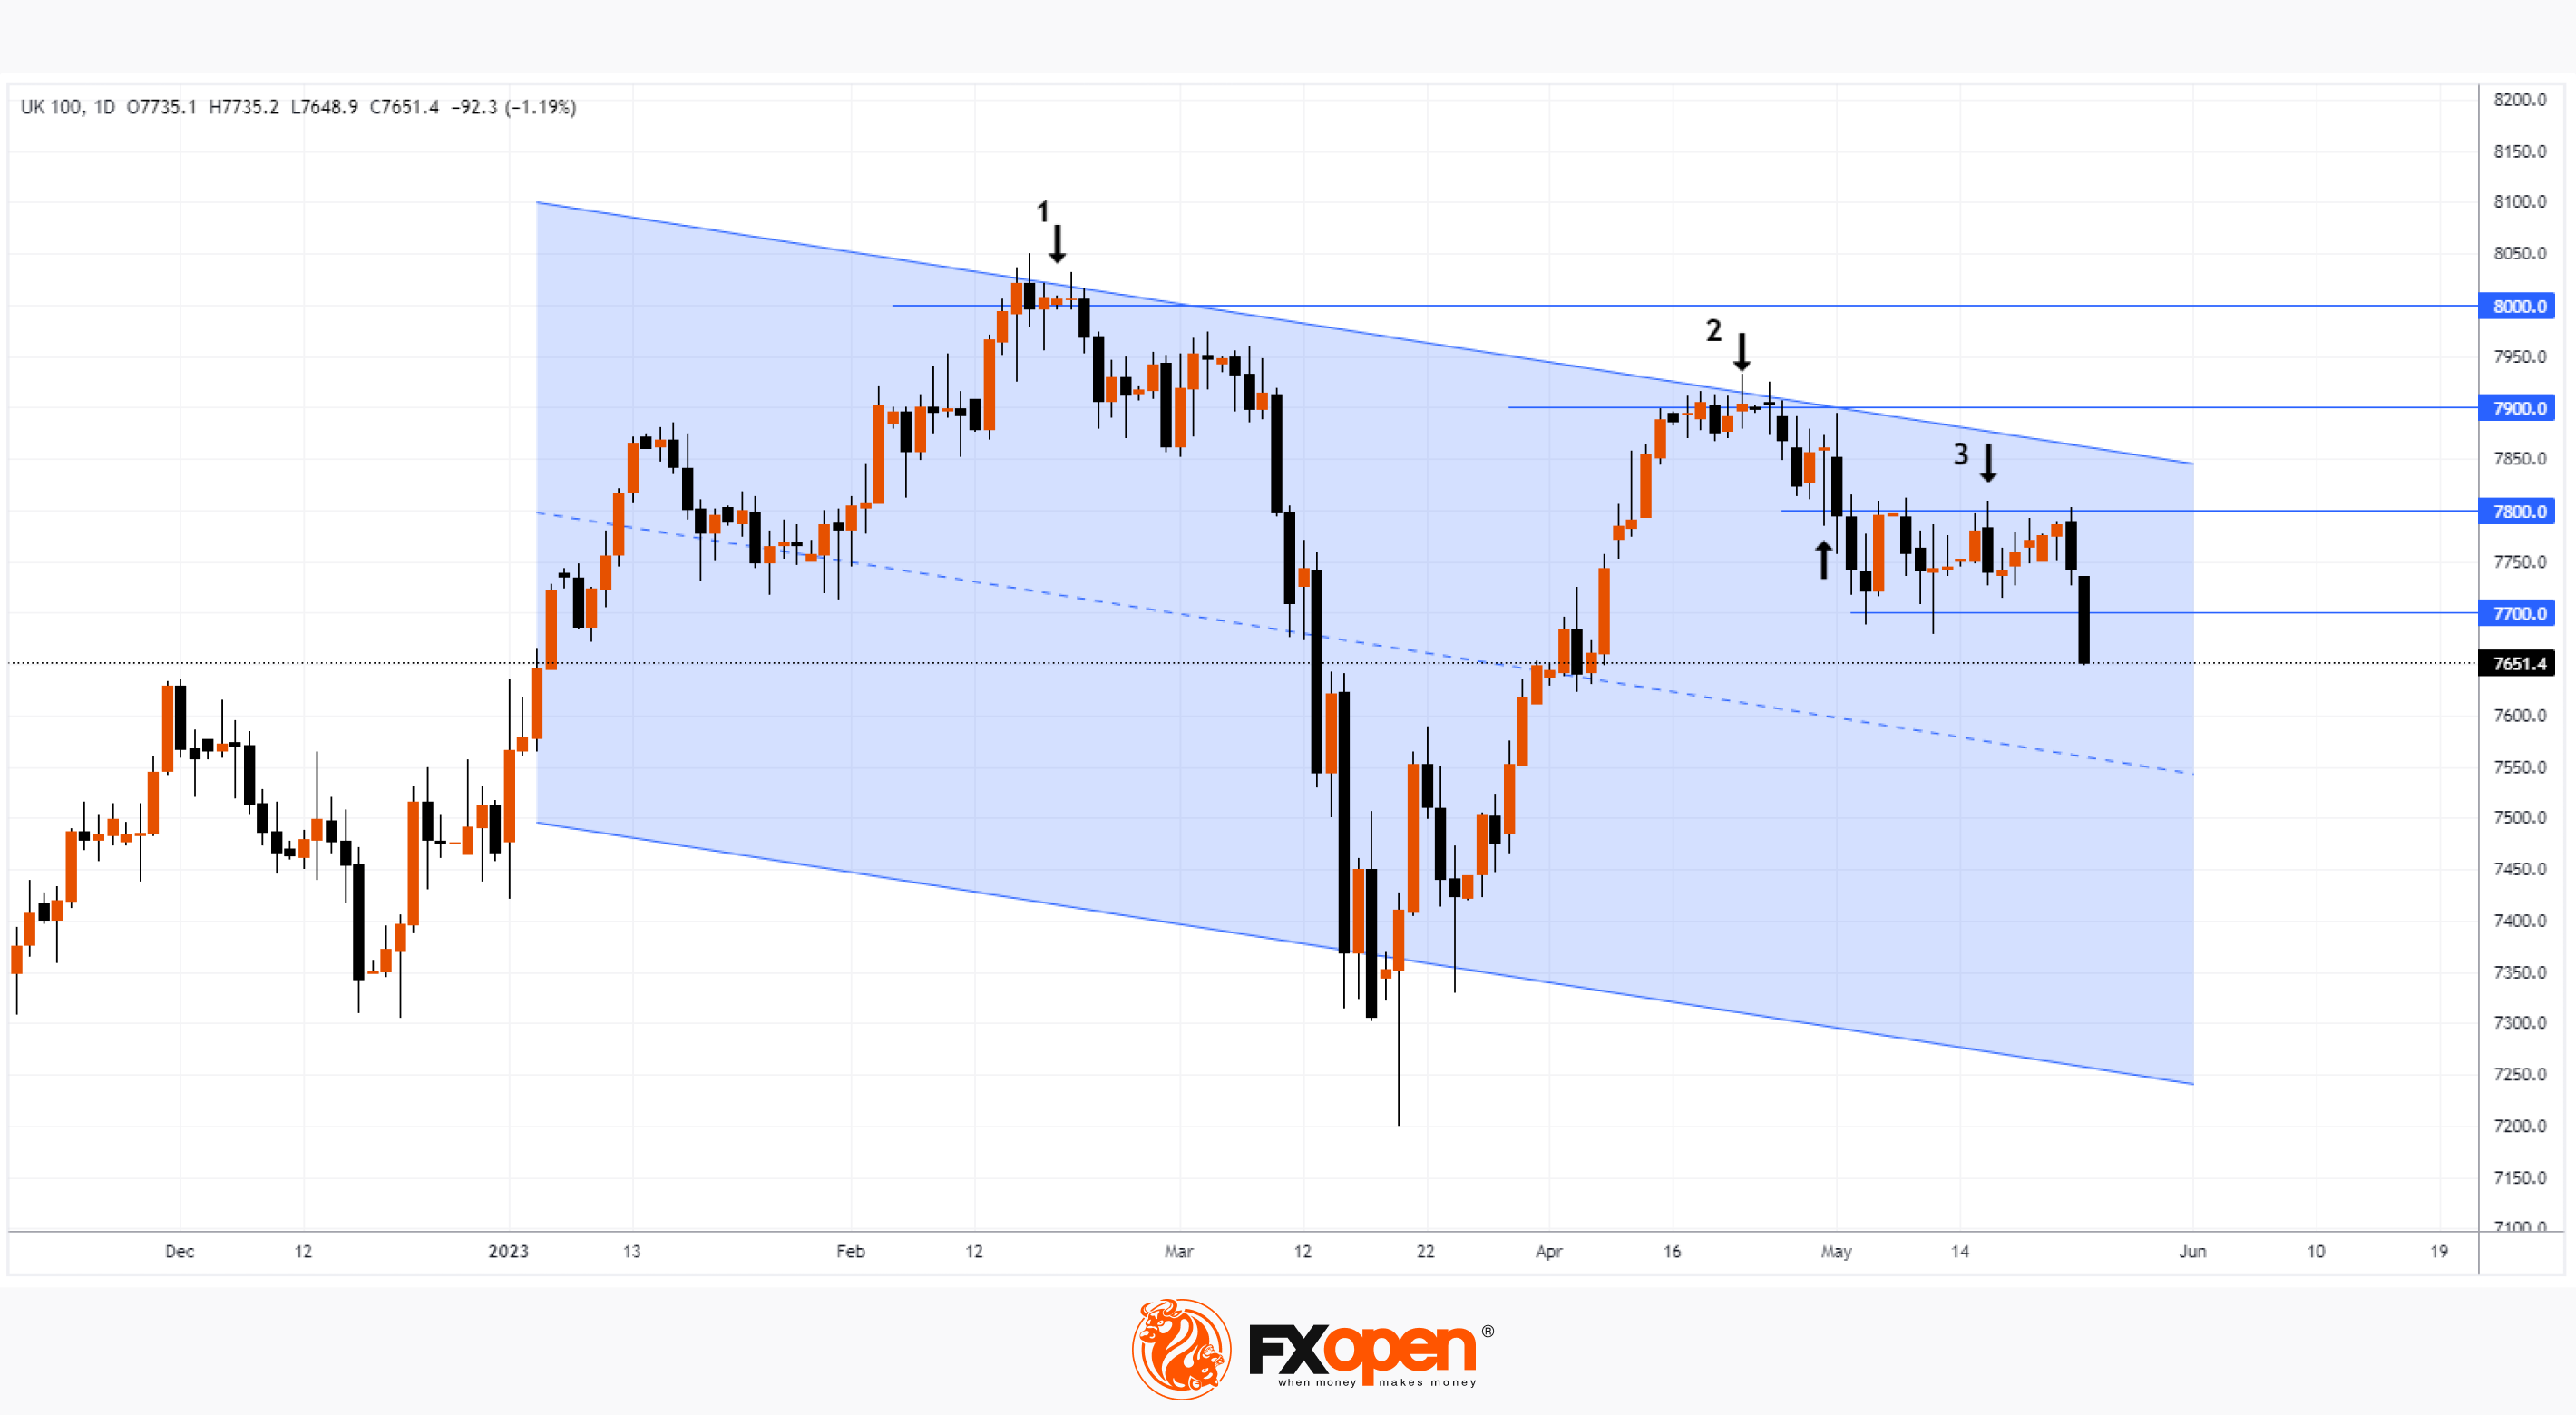
The UK100 chart (a tool that reflects the dynamics of the FTSE 100 index) shows a consistent series of bull failures around psychologically significant levels:
1→ UK100 price failed to settle above 8,000 in February;
2→ UK100 price did not fix above 7,900 in April;
3 → level 7,800 used to be support but is now resisting.
The action of the UK100 price today suggests that the level of 7,700 may now also provide resistance in an attempt to increase. If the downtrend strengthens, the FTSE may continue to decline within the channel (shown in blue), reaching its median line (or even the lower border — which would mean a 2023 low).
To take advantage of the UK100 price movement, consider enlisting the services of a reliable broker like FXOpen.
⚠️
CFDs are complex instruments and come with a high risk of losing your money.
This article represents the opinion of the Companies operating under the FXOpen brand only. It is not to be construed as an offer, solicitation, or recommendation with respect to products and services provided by the Companies operating under the FXOpen brand, nor is it to be considered financial advice.
FTSE Drops Rapidly to April Lows Today
The FTSE 100 index is rapidly declining on Wednesday morning amid news of another spike in inflation. The Core CPI (excluding energy, food and tobacco prices) reached 6.8%, the highest in over 30 years. Market participants are now almost certain that the Bank of England will raise interest rates at its next meeting.
The UK100 chart (a tool that reflects the dynamics of the FTSE 100 index) shows a consistent series of bull failures around psychologically significant levels:
1→ UK100 price failed to settle above 8,000 in February;
2→ UK100 price did not fix above 7,900 in April;
3 → level 7,800 used to be support but is now resisting.
The action of the UK100 price today suggests that the level of 7,700 may now also provide resistance in an attempt to increase. If the downtrend strengthens, the FTSE may continue to decline within the channel (shown in blue), reaching its median line (or even the lower border — which would mean a 2023 low).
To take advantage of the UK100 price movement, consider enlisting the services of a reliable broker like FXOpen.
⚠️
CFDs are complex instruments and come with a high risk of losing your money.
This article represents the opinion of the Companies operating under the FXOpen brand only. It is not to be construed as an offer, solicitation, or recommendation with respect to products and services provided by the Companies operating under the FXOpen brand, nor is it to be considered financial advice.
#MarketNews #crypto
Hong Kong to Open Cryptocurrency Trading to Retail Investors
While Coinbase is launching an advertising campaign in Washington to convey to government officials that cryptocurrencies are technologies that can move the country forward, Hong Kong has taken a step towards a regulated cryptocurrency market.
The Hong Kong Securities and Futures Commission (SFC) announced on May 23 that rules for retail investors to trade cryptocurrencies on licensed exchanges will come into effect on June 1. It also became known that 152 applications have already been received from key industry players, professional associations and consulting firms.
The regulatory framework will cover important aspects, including asset storage security requirements, avoidance of conflicts of interest, and other standards.
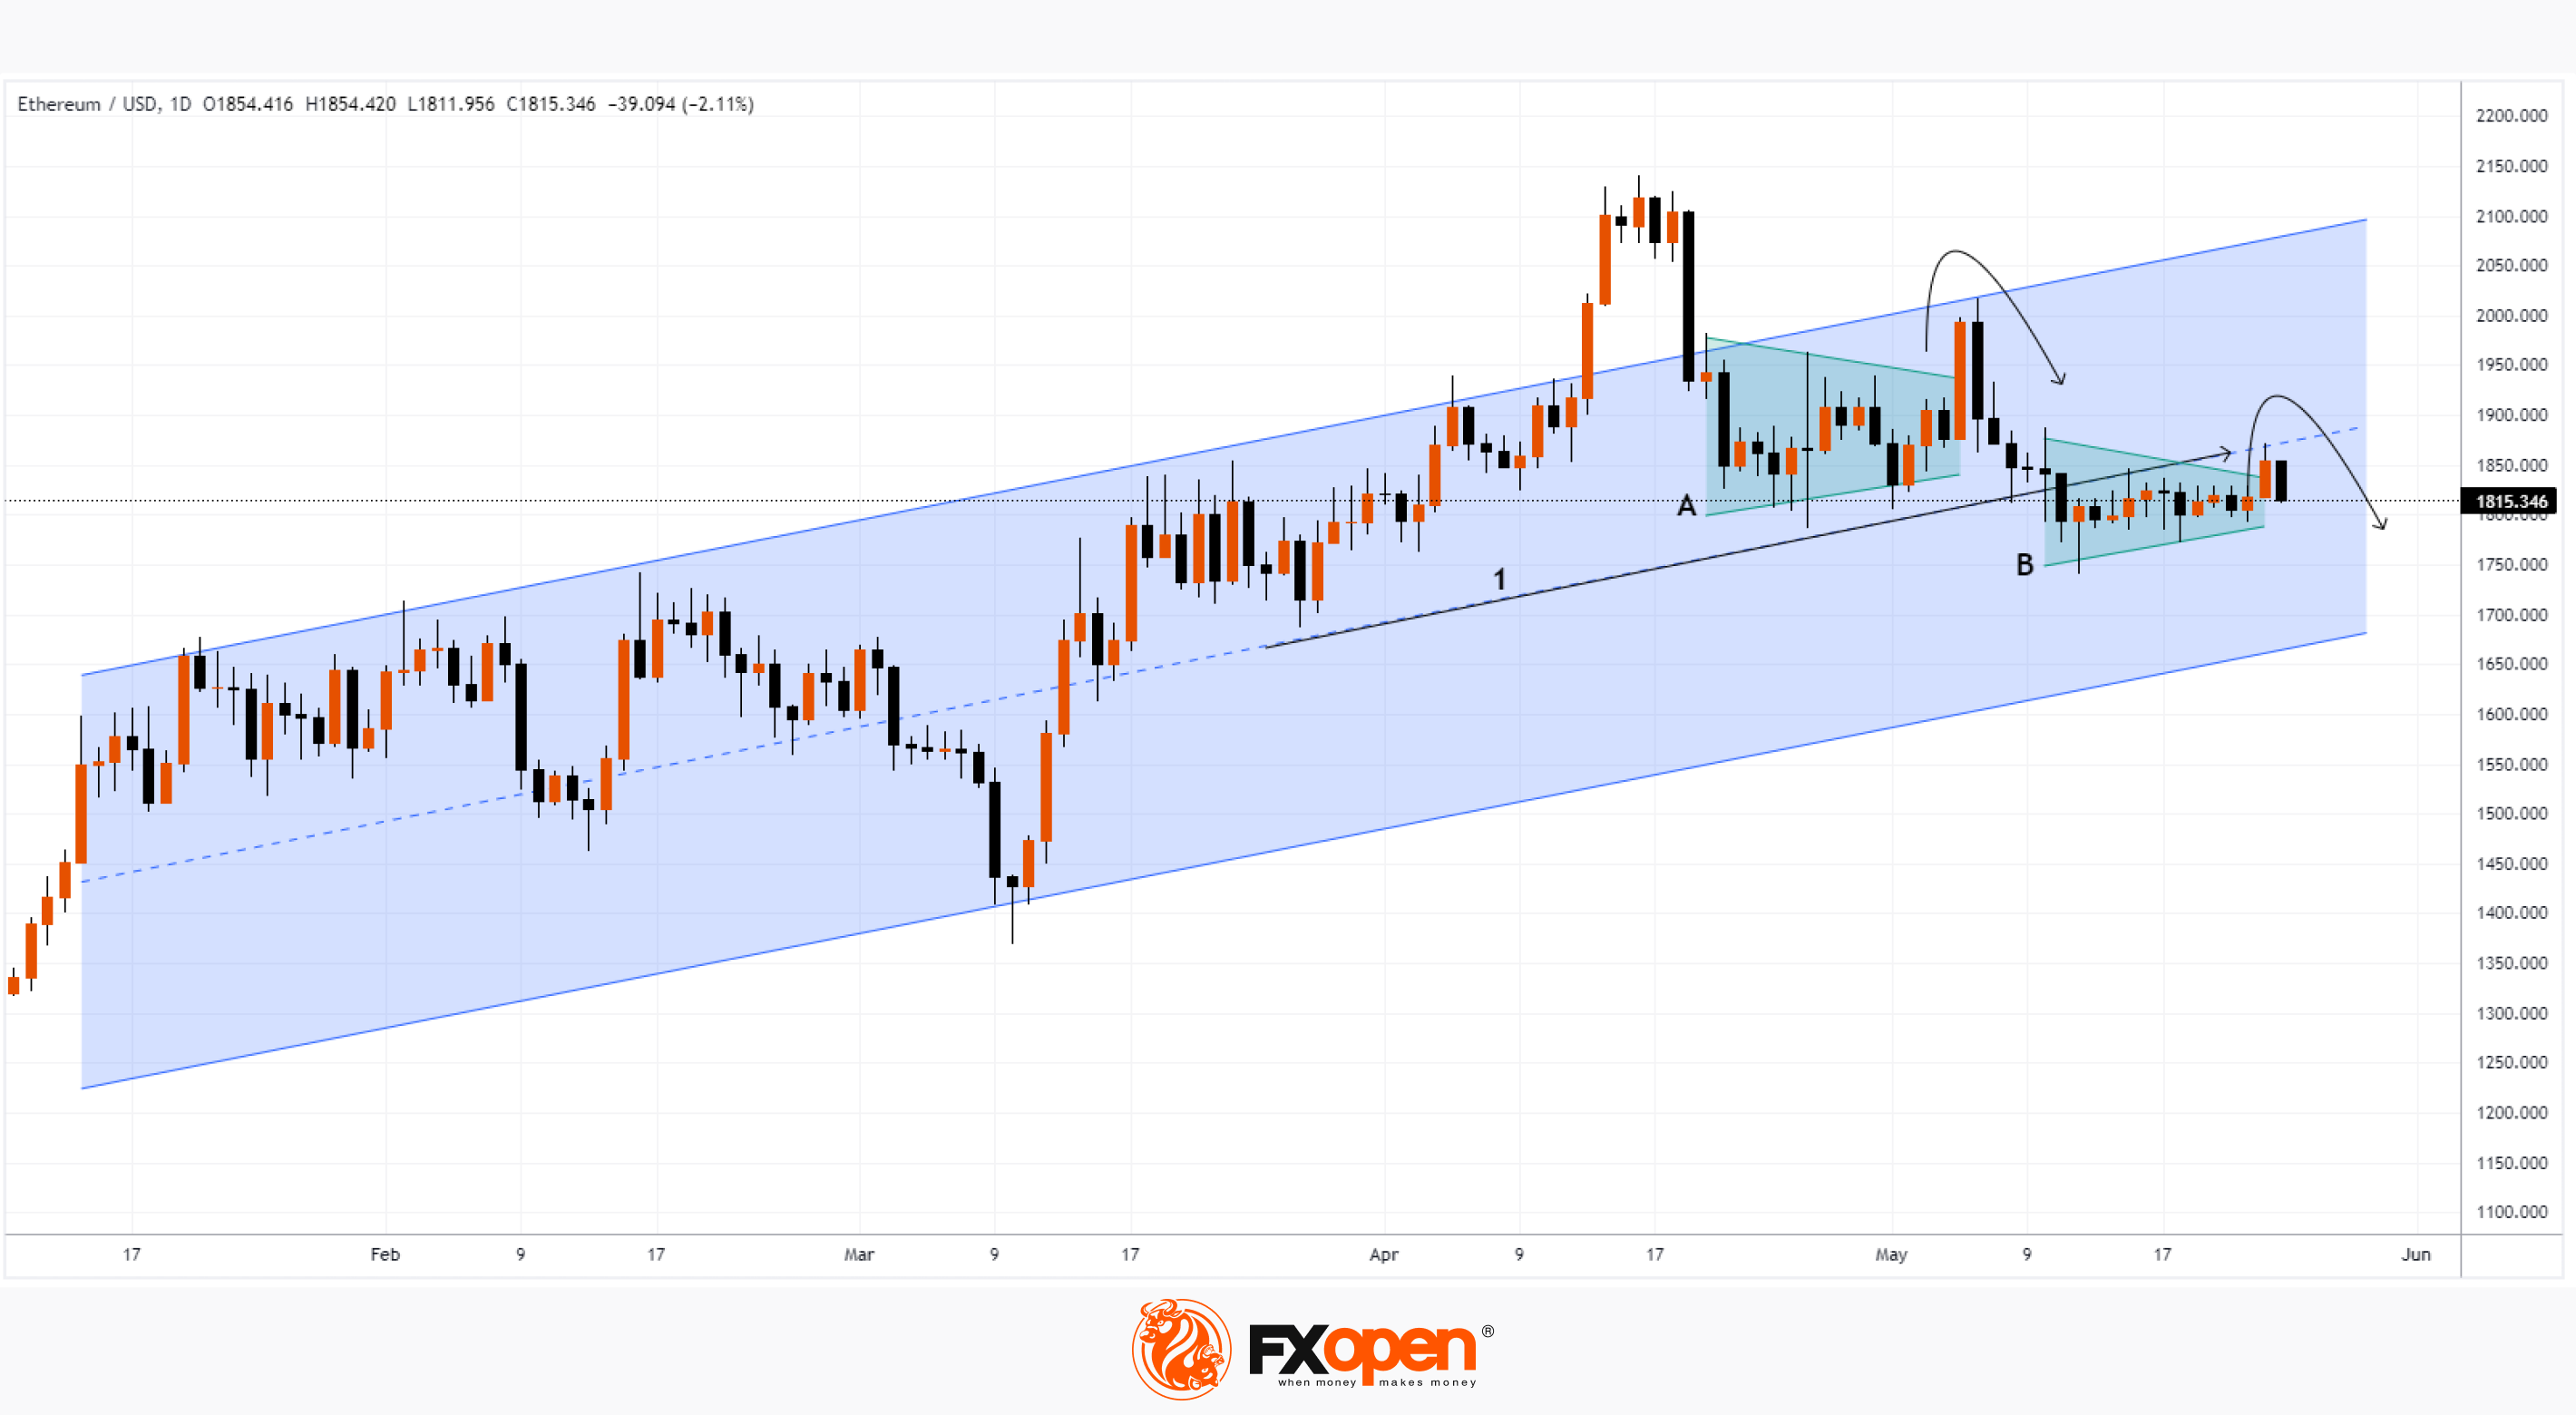
Against the backdrop of positive news from Hong Kong, the price of cryptocurrencies rose yesterday. But today it is declining. For example, the price of ETH on Wednesday morning is down about 3% from the high of May 23rd.
The daily ETH chart shows a disturbing picture.
Firstly, the price of Ethereum tested the median line (1) of the ascending channel yesterday (shown in blue).
Secondly, the pattern of yesterday’s and today’s candlesticks can form a false breakout of balance B. And if the ETH price dynamics develops in the same direction as during the false breakout of balance A (in early May), then the ETH rate against USD may update the lows of the year.
To take advantage of price changes in ETH and other cryptocurrencies, consider enlisting the services of a reliable broker like FXOpen.
⚠️
CFDs are complex instruments and come with a high risk of losing your money.
This article represents the opinion of the Companies operating under the FXOpen brand only. It is not to be construed as an offer, solicitation, or recommendation with respect to products and services provided by the Companies operating under the FXOpen brand, nor is it to be considered financial advice.
At FXOpen UK and FXOpen AU, Cryptocurrency CFDs are only available for trading by those clients categorised as Professional clients under FCA Rules and Professional clients under ASIC Rules, respectively. They are not available for trading by Retail clients.
Hong Kong to Open Cryptocurrency Trading to Retail Investors
While Coinbase is launching an advertising campaign in Washington to convey to government officials that cryptocurrencies are technologies that can move the country forward, Hong Kong has taken a step towards a regulated cryptocurrency market.
The Hong Kong Securities and Futures Commission (SFC) announced on May 23 that rules for retail investors to trade cryptocurrencies on licensed exchanges will come into effect on June 1. It also became known that 152 applications have already been received from key industry players, professional associations and consulting firms.
The regulatory framework will cover important aspects, including asset storage security requirements, avoidance of conflicts of interest, and other standards.
Against the backdrop of positive news from Hong Kong, the price of cryptocurrencies rose yesterday. But today it is declining. For example, the price of ETH on Wednesday morning is down about 3% from the high of May 23rd.
The daily ETH chart shows a disturbing picture.
Firstly, the price of Ethereum tested the median line (1) of the ascending channel yesterday (shown in blue).
Secondly, the pattern of yesterday’s and today’s candlesticks can form a false breakout of balance B. And if the ETH price dynamics develops in the same direction as during the false breakout of balance A (in early May), then the ETH rate against USD may update the lows of the year.
To take advantage of price changes in ETH and other cryptocurrencies, consider enlisting the services of a reliable broker like FXOpen.
⚠️
CFDs are complex instruments and come with a high risk of losing your money.
This article represents the opinion of the Companies operating under the FXOpen brand only. It is not to be construed as an offer, solicitation, or recommendation with respect to products and services provided by the Companies operating under the FXOpen brand, nor is it to be considered financial advice.
At FXOpen UK and FXOpen AU, Cryptocurrency CFDs are only available for trading by those clients categorised as Professional clients under FCA Rules and Professional clients under ASIC Rules, respectively. They are not available for trading by Retail clients.
#MarketNews #EURUSD
Market Analysis: EUR/USD Turns Red, USD/CHF Bulls in Control
🔸The Euro struggled to clear the 1.0845 resistance against the US Dollar.
🔸There is a major bearish trend line forming with resistance near 1.0800 on the hourly chart of EUR/USD at FXOpen.
🔸USD/CHF is gaining pace above the 0.9000 resistance zone.
🔸There is a key bearish trend line forming with resistance near 0.9020 on the hourly chart at FXOpen.
https://cutt.ly/KwqjvpUz
To take advantage of price fluctuations in the foreign exchange markets, consider enlisting the services of a reliable broker like FXOpen.
⚠️
This forecast represents FXOpen Companies opinion only, it should not be construed as an offer, invitation or recommendation in respect to FXOpen Companies products and services or as financial advice
Market Analysis: EUR/USD Turns Red, USD/CHF Bulls in Control
🔸The Euro struggled to clear the 1.0845 resistance against the US Dollar.
🔸There is a major bearish trend line forming with resistance near 1.0800 on the hourly chart of EUR/USD at FXOpen.
🔸USD/CHF is gaining pace above the 0.9000 resistance zone.
🔸There is a key bearish trend line forming with resistance near 0.9020 on the hourly chart at FXOpen.
https://cutt.ly/KwqjvpUz
To take advantage of price fluctuations in the foreign exchange markets, consider enlisting the services of a reliable broker like FXOpen.
⚠️
This forecast represents FXOpen Companies opinion only, it should not be construed as an offer, invitation or recommendation in respect to FXOpen Companies products and services or as financial advice
Market Pulse
Market Analysis: EUR/USD Turns Red, USD/CHF Bulls in Control
EUR/USD started a fresh decline from the 1.0830 resistance. USD/CHF is rising and might aim a move toward the 0.9060 resistance.
#MarketNews #stocks
Dow Jones Hits May Lows
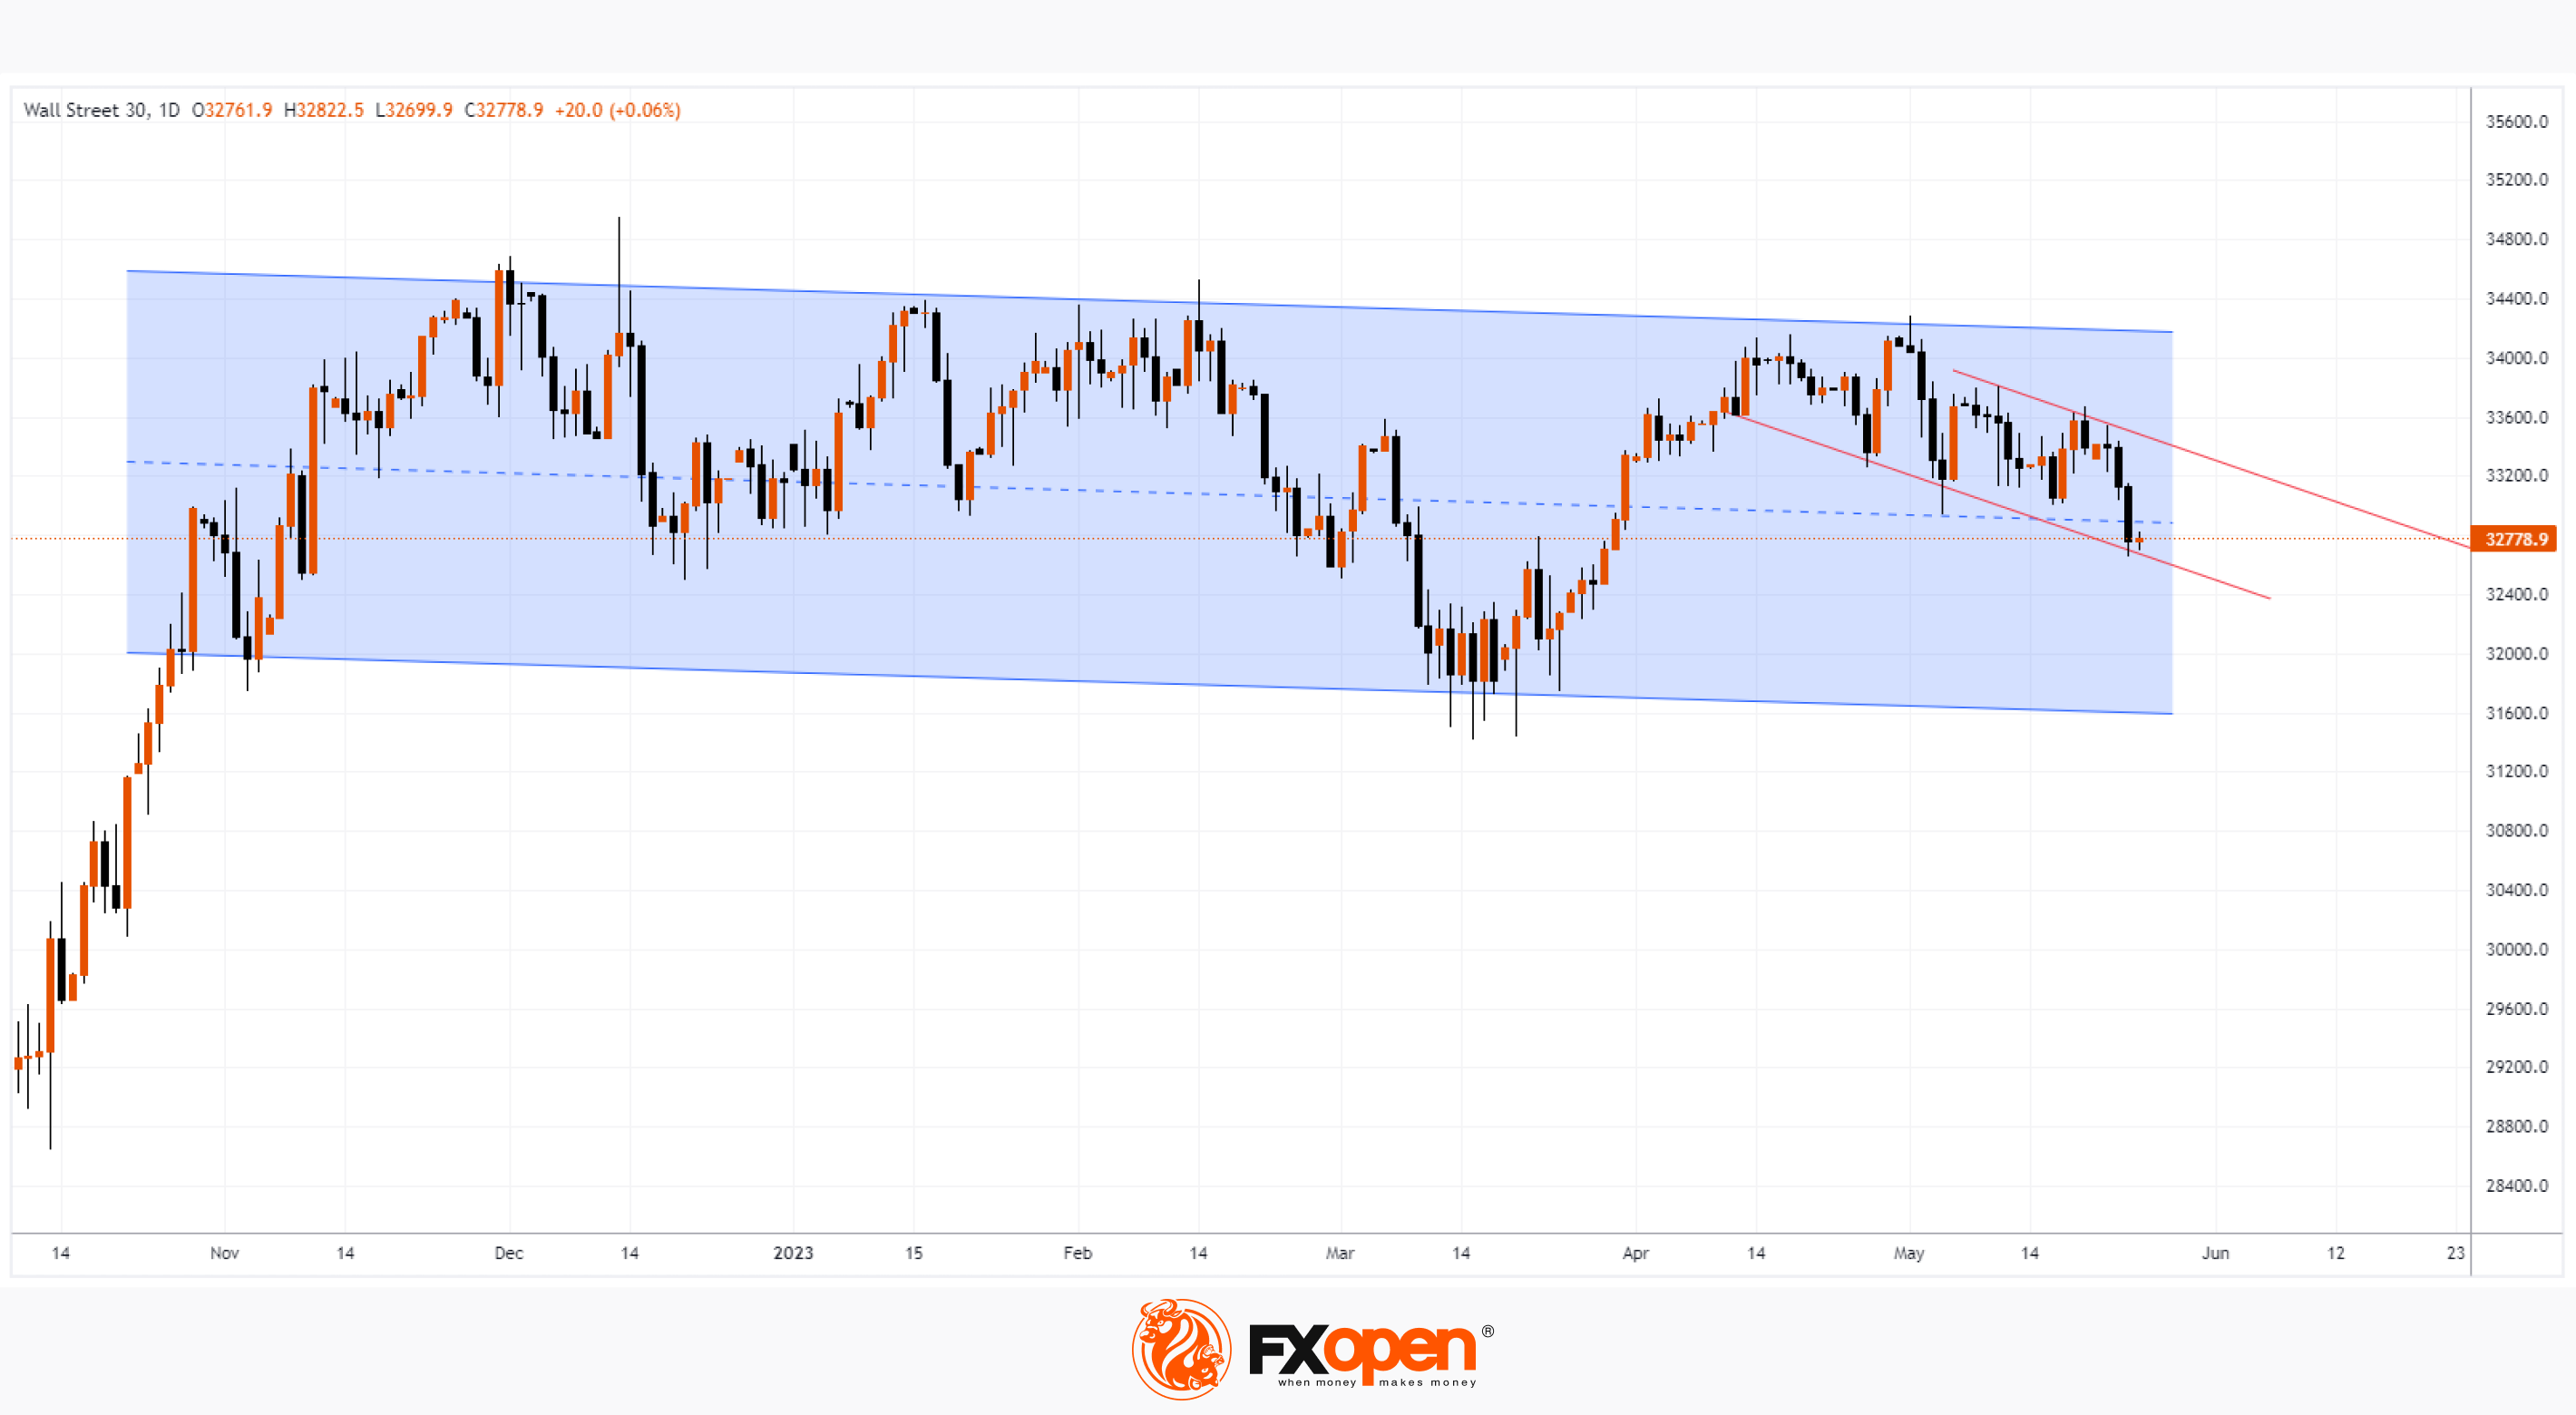
US30, or the Dow Jones index, which is calculated based on the value of shares of 30 companies traded on Wall Street, fell below 32,800.
This happened against the backdrop of growing concerns about raising the US national debt ceiling. Fitch has even placed the long-term AAA US rating on review. According to JPMorgan analysts, despite the fact that the most expected scenario is the increase in the debt ceiling, the probability of a default at the moment is 25% and is increasing every day.
US30 is faring noticeably weaker than the index of technology stocks, which are in demand in the context of the AI-related boom. For example, NVDA shares soared 25% to USD 380 after yesterday's report, and Nvidia sharply raised its revenue and profit forecasts due to the demand for AI chips (we wrote about NVDA's bullish outlook just a week ago).
The US30 chart shows that the index value has fallen into the lower half of the channel it has been in since November 2022. If default anxiety builds, it is possible that the Dow Jones will continue to decline within the short-term channel (shown in red lines) towards the lows of the year.
To take advantage of trends in the world's stock markets, consider enlisting the services of a reliable broker like FXOpen.
⚠️
CFDs are complex instruments and come with a high risk of losing your money.
This article represents the opinion of the Companies operating under the FXOpen brand only. It is not to be construed as an offer, solicitation, or recommendation with respect to products and services provided by the Companies operating under the FXOpen brand, nor is it to be considered financial advice.
Dow Jones Hits May Lows
US30, or the Dow Jones index, which is calculated based on the value of shares of 30 companies traded on Wall Street, fell below 32,800.
This happened against the backdrop of growing concerns about raising the US national debt ceiling. Fitch has even placed the long-term AAA US rating on review. According to JPMorgan analysts, despite the fact that the most expected scenario is the increase in the debt ceiling, the probability of a default at the moment is 25% and is increasing every day.
US30 is faring noticeably weaker than the index of technology stocks, which are in demand in the context of the AI-related boom. For example, NVDA shares soared 25% to USD 380 after yesterday's report, and Nvidia sharply raised its revenue and profit forecasts due to the demand for AI chips (we wrote about NVDA's bullish outlook just a week ago).
The US30 chart shows that the index value has fallen into the lower half of the channel it has been in since November 2022. If default anxiety builds, it is possible that the Dow Jones will continue to decline within the short-term channel (shown in red lines) towards the lows of the year.
To take advantage of trends in the world's stock markets, consider enlisting the services of a reliable broker like FXOpen.
⚠️
CFDs are complex instruments and come with a high risk of losing your money.
This article represents the opinion of the Companies operating under the FXOpen brand only. It is not to be construed as an offer, solicitation, or recommendation with respect to products and services provided by the Companies operating under the FXOpen brand, nor is it to be considered financial advice.
🤔1
#MarketNews #EURUSD
Market Analysis: EUR/USD Approaches Important Support
Yesterday, EUR/USD hit new May’s lows. This week’s latest news contributed to the decline:
→ Germany's GDP in Q1 2023 decreased by 0.3% compared to the previous three months. German media write about the official start of the recession.
→ The US economy in Q1 grew by 1.3% in annual terms.
→ Worrying opinions are spreading about a possible crisis due to the situation in the US housing market. According to JPMorgan analysts, the next shock to the US banking system could be loans for commercial real estate.
→ Traders see the dollar as a reliable asset in the face of the not yet raised US government debt ceiling.
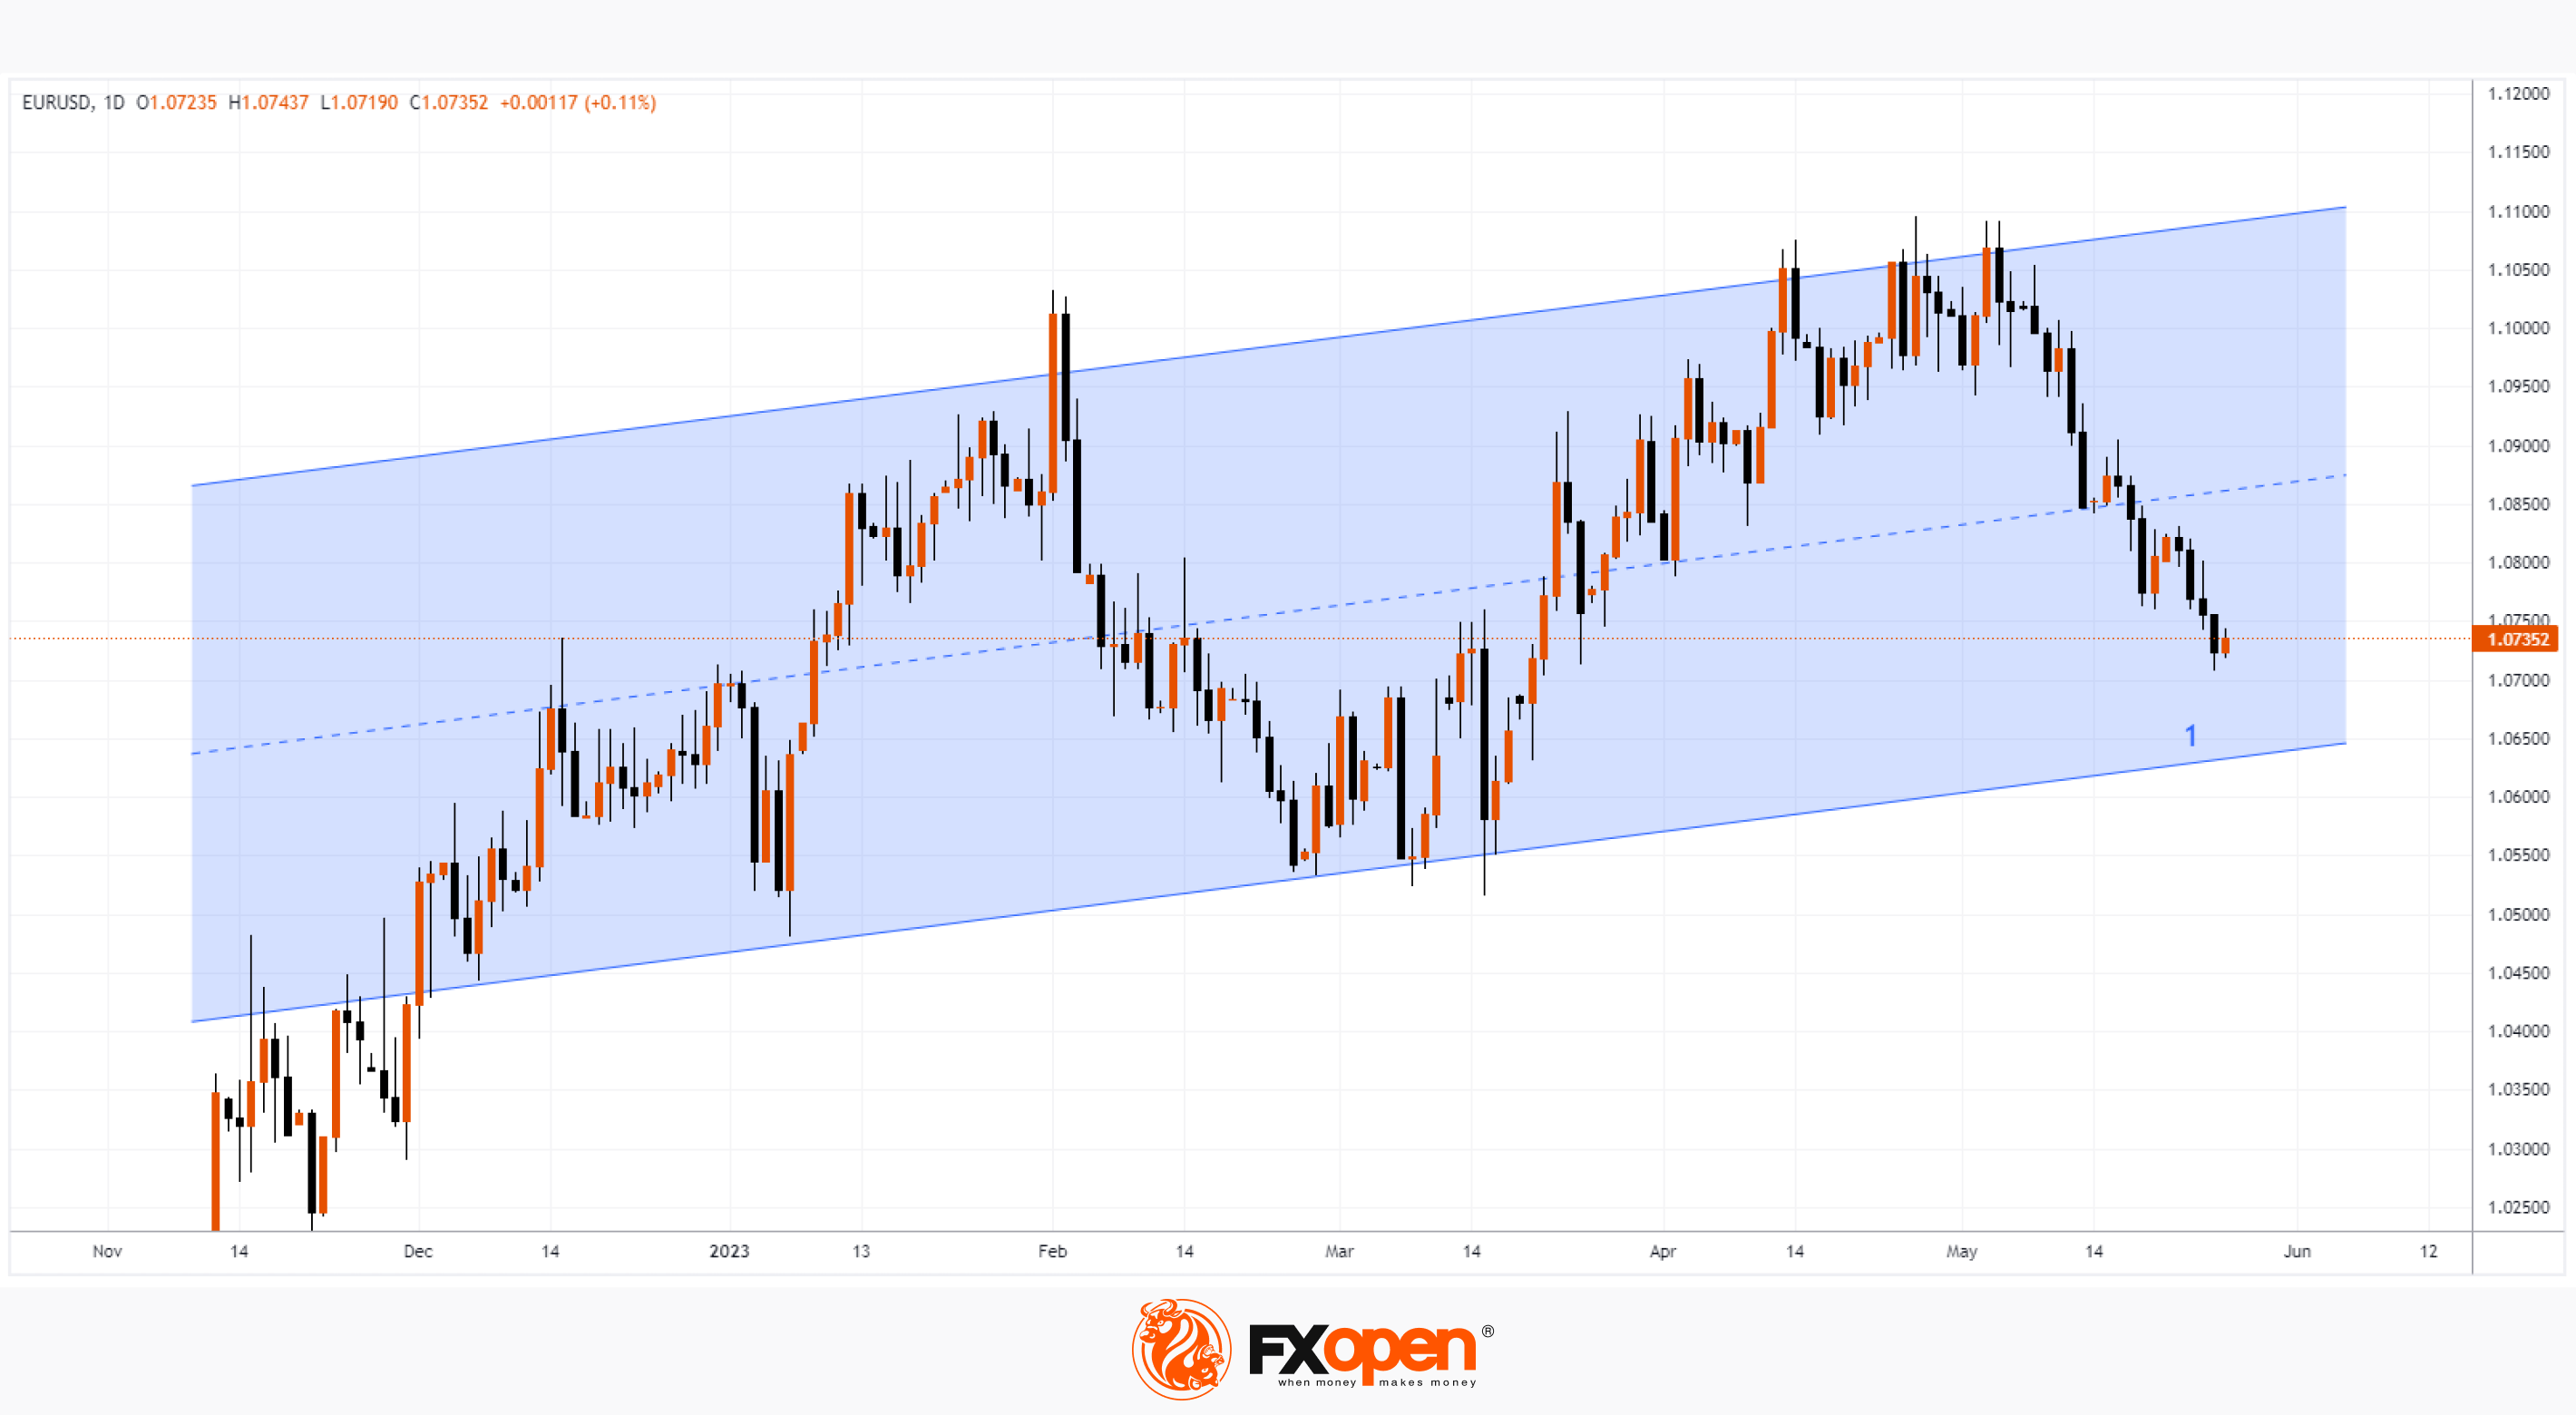
The EUR/USD chart shows that the rate has already fallen by 3.3% from the peaks of May. The rate is approaching the psychological mark of USD 1.07 per euro, which may support the market.
The technical analysis of EUR/USD gives reason to count on another potential support level. We are talking about the lower line (1) of an important ascending channel that has been operating since last year — if it is reached, buyers may become more active using the rebound trading strategy on the EUR/USD market.
To take advantage of trends in the currency markets, consider enlisting the services of a reliable broker like FXOpen.
⚠️
CFDs are complex instruments and come with a high risk of losing your money.
This article represents the opinion of the Companies operating under the FXOpen brand only. It is not to be construed as an offer, solicitation, or recommendation with respect to products and services provided by the Companies operating under the FXOpen brand, nor is it to be considered financial advice.
Market Analysis: EUR/USD Approaches Important Support
Yesterday, EUR/USD hit new May’s lows. This week’s latest news contributed to the decline:
→ Germany's GDP in Q1 2023 decreased by 0.3% compared to the previous three months. German media write about the official start of the recession.
→ The US economy in Q1 grew by 1.3% in annual terms.
→ Worrying opinions are spreading about a possible crisis due to the situation in the US housing market. According to JPMorgan analysts, the next shock to the US banking system could be loans for commercial real estate.
→ Traders see the dollar as a reliable asset in the face of the not yet raised US government debt ceiling.
The EUR/USD chart shows that the rate has already fallen by 3.3% from the peaks of May. The rate is approaching the psychological mark of USD 1.07 per euro, which may support the market.
The technical analysis of EUR/USD gives reason to count on another potential support level. We are talking about the lower line (1) of an important ascending channel that has been operating since last year — if it is reached, buyers may become more active using the rebound trading strategy on the EUR/USD market.
To take advantage of trends in the currency markets, consider enlisting the services of a reliable broker like FXOpen.
⚠️
CFDs are complex instruments and come with a high risk of losing your money.
This article represents the opinion of the Companies operating under the FXOpen brand only. It is not to be construed as an offer, solicitation, or recommendation with respect to products and services provided by the Companies operating under the FXOpen brand, nor is it to be considered financial advice.
👍1
#MarketNews #bitcoin #BTCUSD
BTC/USD Market Analysis: Bitcoin Tower May Be Built in Dubai
Positive news reports for crypto enthusiasts:
→ This week, the official presentation of the Bitcoin Tower project, which can be built in Dubai, took place. Although a building permit has not yet been received, this is quite realistic, given the loyalty of the UAE authorities to cryptocurrency projects.
→ Ron DeSantis, known for his support of cryptocurrencies, has joined the US presidential race. DeSantis has pledged to protect people's rights to use bitcoin and believes four more years of Biden will hurt BTC.
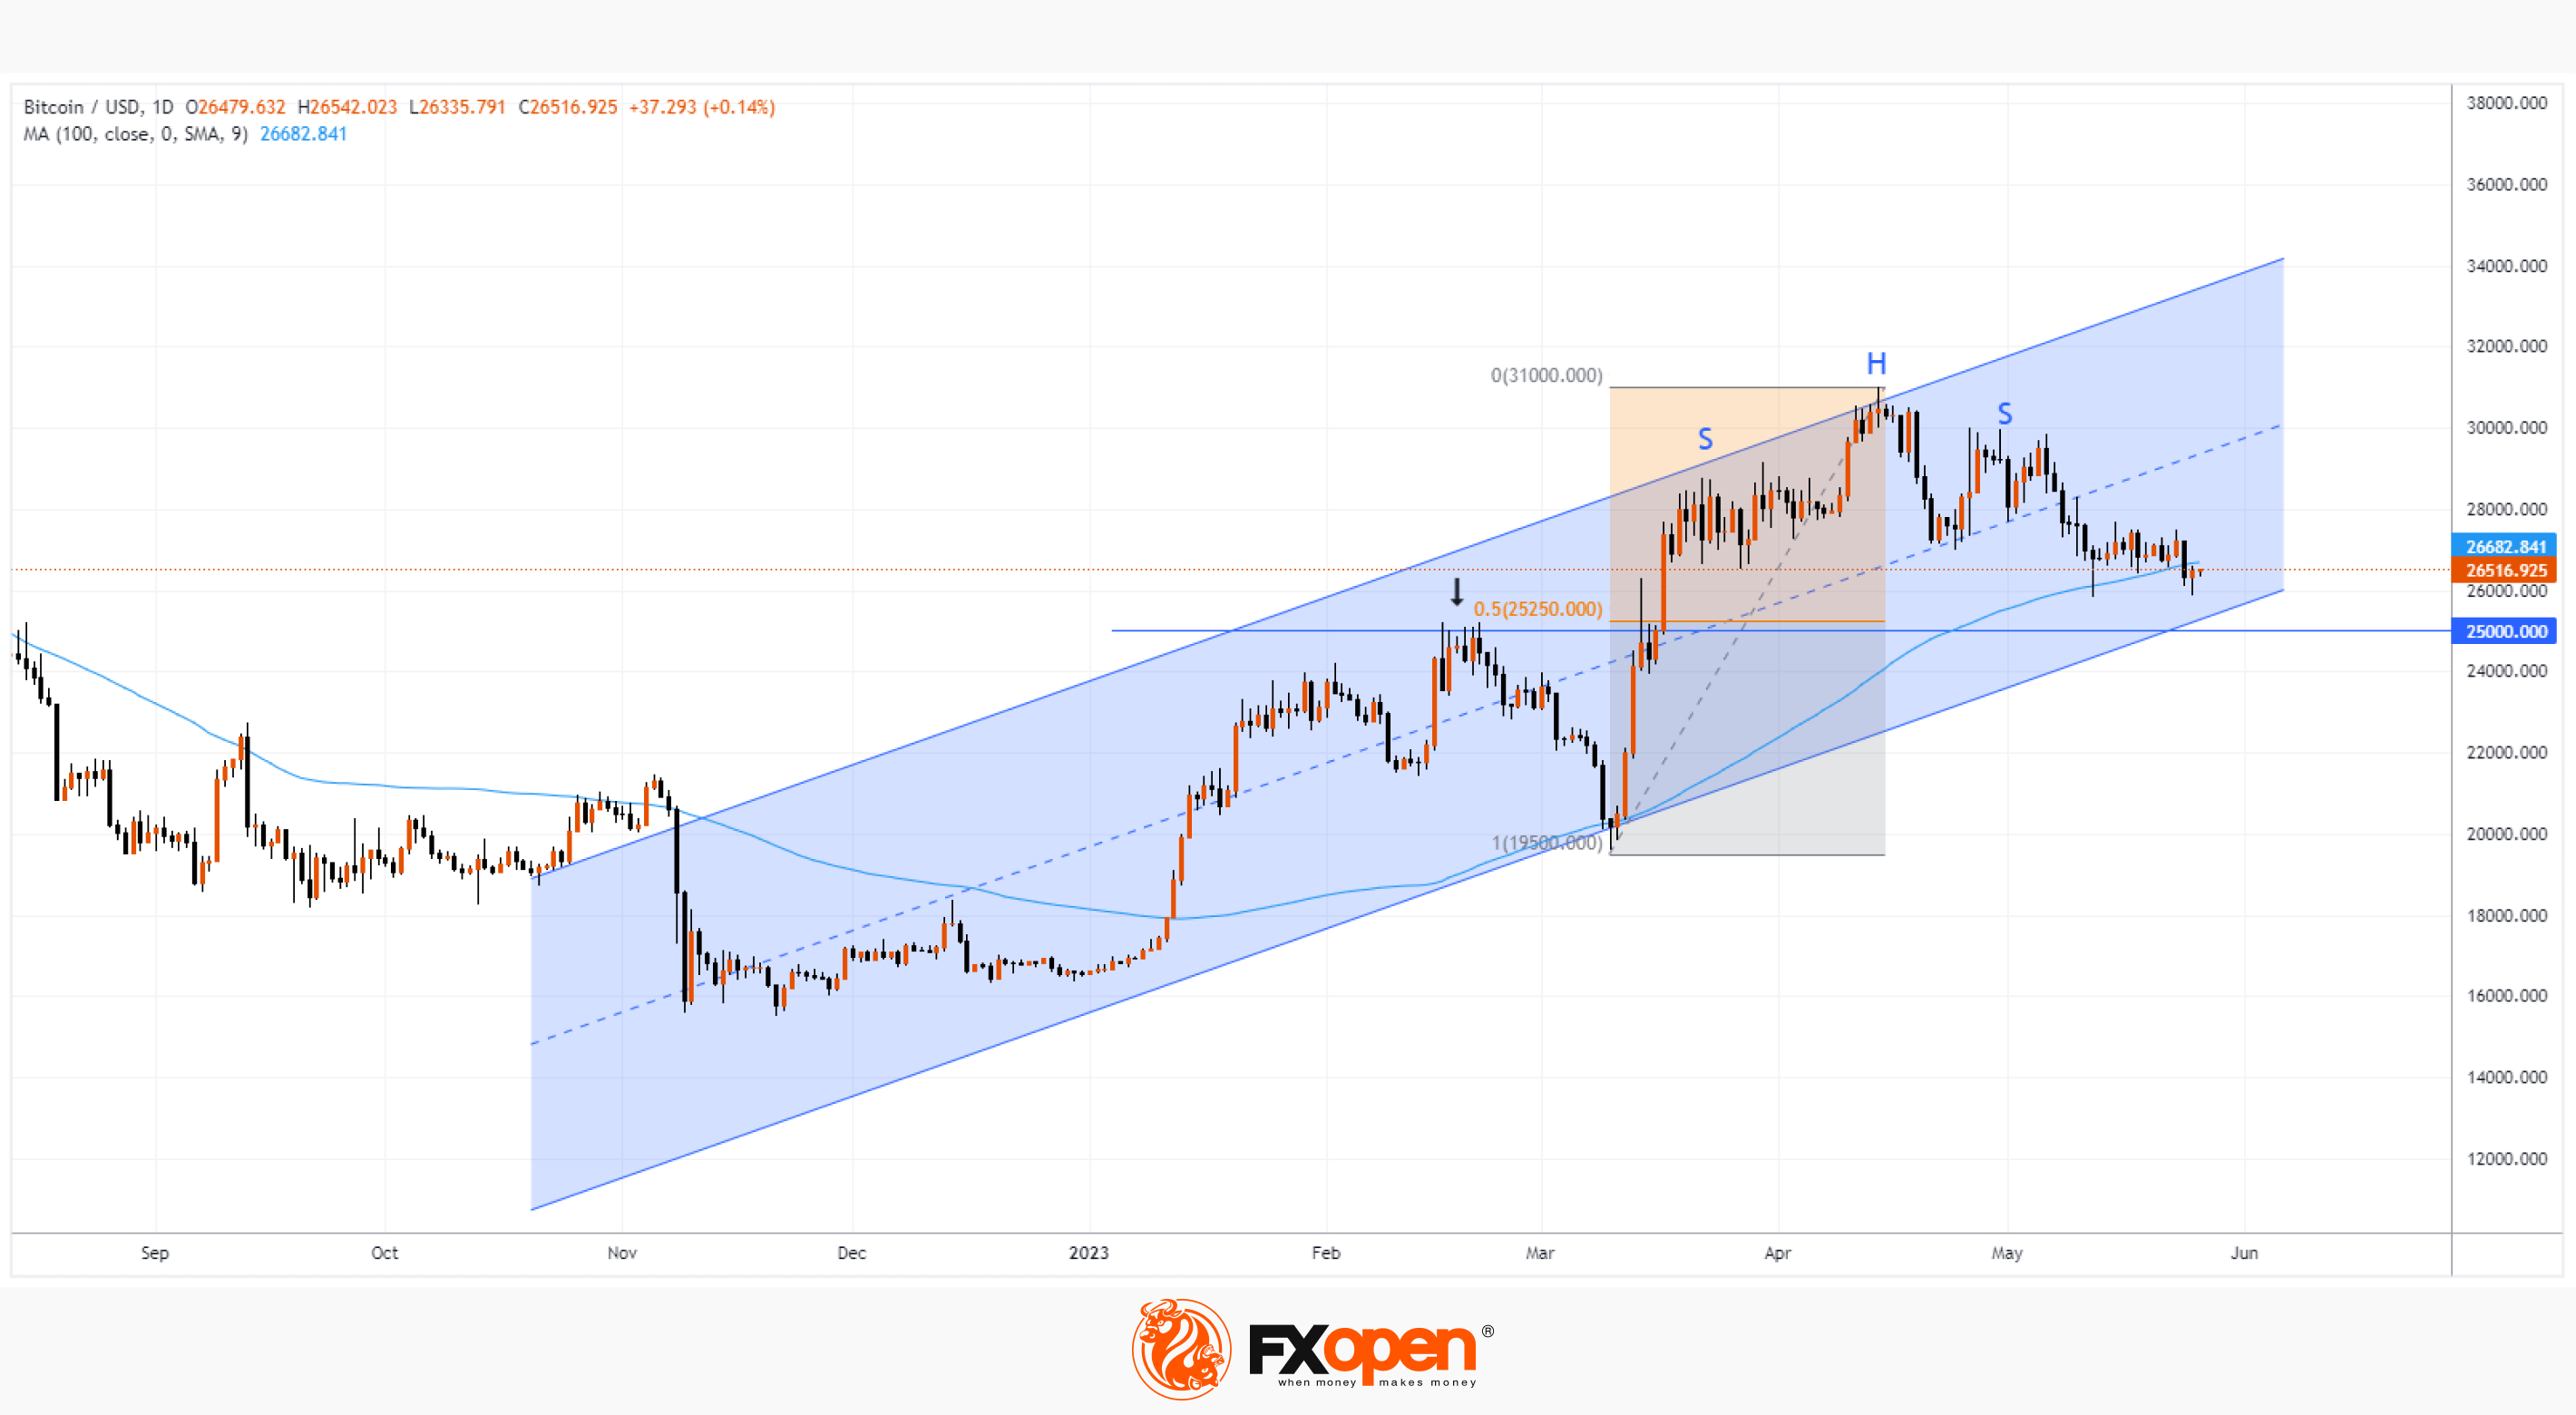
The negative news is that on the chart, the BTC/USD rate fell below the 100-day SMA. This is especially worrisome given the ongoing SHS, a bearish BTC/USD technical analysis pattern.
Although the buyers on the BTC/USD chart have their own arguments:
→ support from the ascending channel line (shown in blue);
→ support from the USD 25k psychological level, which acted as resistance in February;
→ support for the 50% level (around 25,250) from the rise in the price of bitcoin from the March low (around 19,500) to the April high (around 31,000).
Therefore, it is reasonable to expect that in the event of a decrease to the area of three supports, the price of bitcoin may attract new buyers.
To take advantage of the rise and fall of bitcoin against the US dollar, consider enlisting the services of a reliable broker like FXOpen.
⚠️
CFDs are complex instruments and come with a high risk of losing your money.
This article represents the opinion of the Companies operating under the FXOpen brand only. It is not to be construed as an offer, solicitation, or recommendation with respect to products and services provided by the Companies operating under the FXOpen brand, nor is it to be considered financial advice.
At FXOpen UK and FXOpen AU, Cryptocurrency CFDs are only available for trading by those clients categorised as Professional clients under FCA Rules and Professional clients under ASIC Rules, respectively. They are not available for trading by Retail clients.
BTC/USD Market Analysis: Bitcoin Tower May Be Built in Dubai
Positive news reports for crypto enthusiasts:
→ This week, the official presentation of the Bitcoin Tower project, which can be built in Dubai, took place. Although a building permit has not yet been received, this is quite realistic, given the loyalty of the UAE authorities to cryptocurrency projects.
→ Ron DeSantis, known for his support of cryptocurrencies, has joined the US presidential race. DeSantis has pledged to protect people's rights to use bitcoin and believes four more years of Biden will hurt BTC.
The negative news is that on the chart, the BTC/USD rate fell below the 100-day SMA. This is especially worrisome given the ongoing SHS, a bearish BTC/USD technical analysis pattern.
Although the buyers on the BTC/USD chart have their own arguments:
→ support from the ascending channel line (shown in blue);
→ support from the USD 25k psychological level, which acted as resistance in February;
→ support for the 50% level (around 25,250) from the rise in the price of bitcoin from the March low (around 19,500) to the April high (around 31,000).
Therefore, it is reasonable to expect that in the event of a decrease to the area of three supports, the price of bitcoin may attract new buyers.
To take advantage of the rise and fall of bitcoin against the US dollar, consider enlisting the services of a reliable broker like FXOpen.
⚠️
CFDs are complex instruments and come with a high risk of losing your money.
This article represents the opinion of the Companies operating under the FXOpen brand only. It is not to be construed as an offer, solicitation, or recommendation with respect to products and services provided by the Companies operating under the FXOpen brand, nor is it to be considered financial advice.
At FXOpen UK and FXOpen AU, Cryptocurrency CFDs are only available for trading by those clients categorised as Professional clients under FCA Rules and Professional clients under ASIC Rules, respectively. They are not available for trading by Retail clients.
👍1