
BTC: Bullish Above, Bearish Below
Must Read
https://www.tradingview.com/chart/XBTUSD/zX2phEew-BTC-Bullish-Above-Bearish-Below/
❗️Guys, please, click the LIKE button. We would appreciate it
Must Read
https://www.tradingview.com/chart/XBTUSD/zX2phEew-BTC-Bullish-Above-Bearish-Below/
❗️Guys, please, click the LIKE button. We would appreciate it
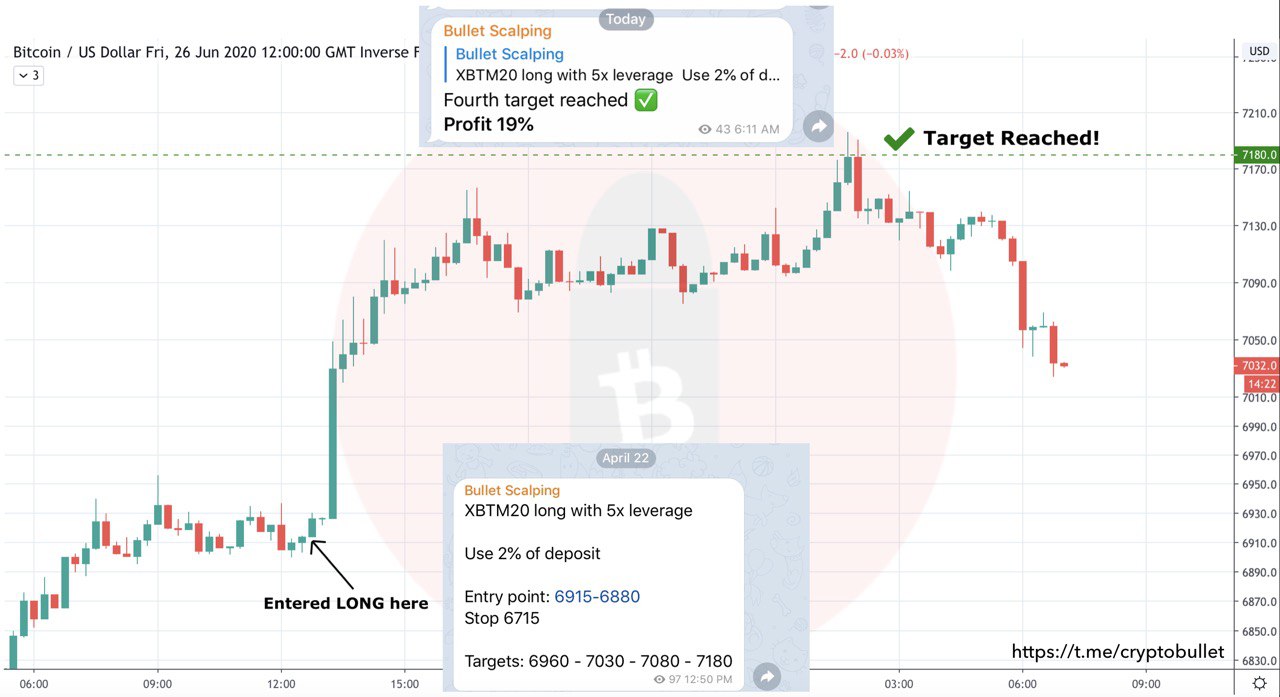
🔥🚀 Good profit for the members of Bullet Scalping channel!
Look at that: yesterday we entered a long position at 6915 and now you see that BTC pumped by $300 exactly hitting our last target! We managed to catch this move perfectly. Profit 19%!
If you want to buy our Bullet Scalping subscription - contact @Likeniss
Look at that: yesterday we entered a long position at 6915 and now you see that BTC pumped by $300 exactly hitting our last target! We managed to catch this move perfectly. Profit 19%!
If you want to buy our Bullet Scalping subscription - contact @Likeniss
BTC update
The price found support above that cluster of moving averages and skyrocketed by $700! Like I’ve been saying: the bias is bullish as long as we are above EMA200
This upward channel keeps working insanely well. Look at where the price got rejected - right at the mid line of the channel (wait for the candle closure)
📌Decent Volume finally showed up
BTC 1D chart
📍BTC is at a massive Resistance Cluster: MA200 + EMA200 + Strong Horizontal Level + Mid Line of the Channel
Let’s recall previous times when BTC was attacking resistance clusters earlier this year and BTC broke them fairly easily. Resistances are meant to be broken one day.
💡From that stand point, if we break the resistance at ~7.9k, we can expect a continuation to the upside to fill the CME Gap
CryptoBullet
📈 Look at this surge in Google Searches for «Bitcoin halving» Can you imagine how high the interest will be one month before it and the day of the halving? Actually yes. Just take a look at what happened in 2016. The question is Will it be higher than…
🚀BTC halving: less than 2 weeks to go!
As expected, the number of Google Searches for «Bitcoin halving» has already exceeded the 2016 numbers, which means the interest is much higher (no surprise, this time there are more people involved)
As expected, the number of Google Searches for «Bitcoin halving» has already exceeded the 2016 numbers, which means the interest is much higher (no surprise, this time there are more people involved)
CryptoBullet
BTC 1D chart 📍BTC is at a massive Resistance Cluster: MA200 + EMA200 + Strong Horizontal Level + Mid Line of the Channel Let’s recall previous times when BTC was attacking resistance clusters earlier this year and BTC broke them fairly easily. Resistances…
BTC 1D chart update
Quote from the previous analysis: «Resistances are meant to be broken one day»
And here it is - we broke through the resistance cluster like we did in the past, nothing new.
Previous support now will act as a strong support
📌Moreover, we entered the CME Gap territory. There is plenty of room to go up according to it
We started closing this humongous CME Gap + BTC halving coming in 12 days = 🚀 or a perfect trap?
Final Results
40%
🚀
60%
Perfect Trap!
CryptoBullet
BTC 1D chart 📍BTC is at a massive Resistance Cluster: MA200 + EMA200 + Strong Horizontal Level + Mid Line of the Channel Let’s recall previous times when BTC was attacking resistance clusters earlier this year and BTC broke them fairly easily. Resistances…
BTC 1D update
Quote from the initial analysis: «…if we break the resistance at ~7.9k, we can expect a continuation to the upside to fill the CME Gap»
🎯Now you see that the CME Gap is filled. We reached as high as the top of this upward channel
Quote from the initial analysis: «…if we break the resistance at ~7.9k, we can expect a continuation to the upside to fill the CME Gap»
🎯Now you see that the CME Gap is filled. We reached as high as the top of this upward channel
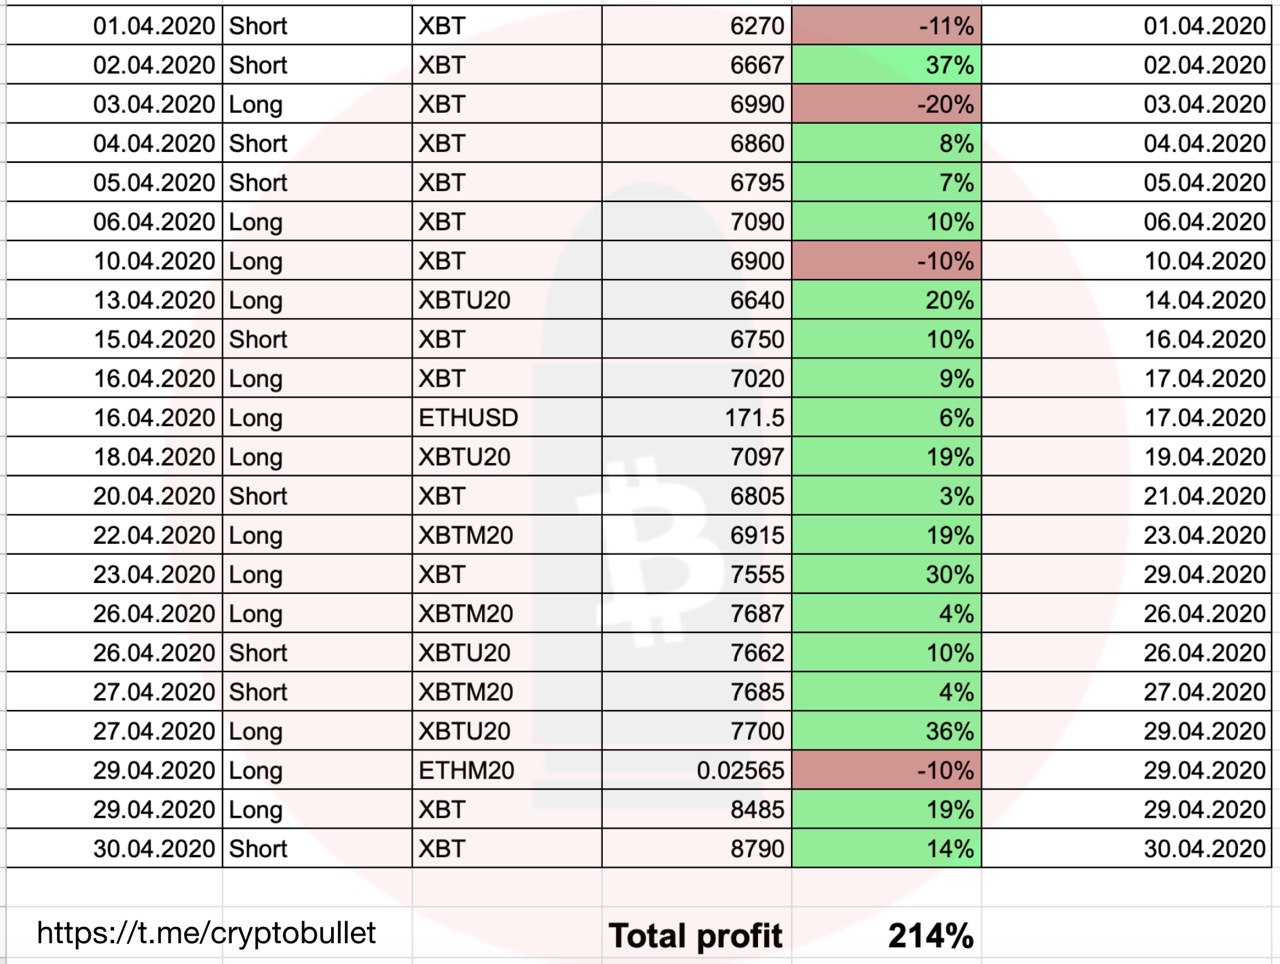
🚀💰 214% Profit in April! That's our Bullet Scalping channel statistics
There are hundreds of supposed experts with “years” of experience in trading and 100% accuracy rate, yet none of them has shown any proof of it. They just give random signals in their VIP groups and show you only profitable trades, which are the minority.
👉 Our VIP members have been making HUGE profits this month. We took 22 trades, 18 of them were closed in profit, in 4 cases out of 22 we were stopped out in a loss
The accuracy rate is amazing 81%. Total profit is 214%
If you want to buy our Bullet Scalping subscription - contact @Likeniss
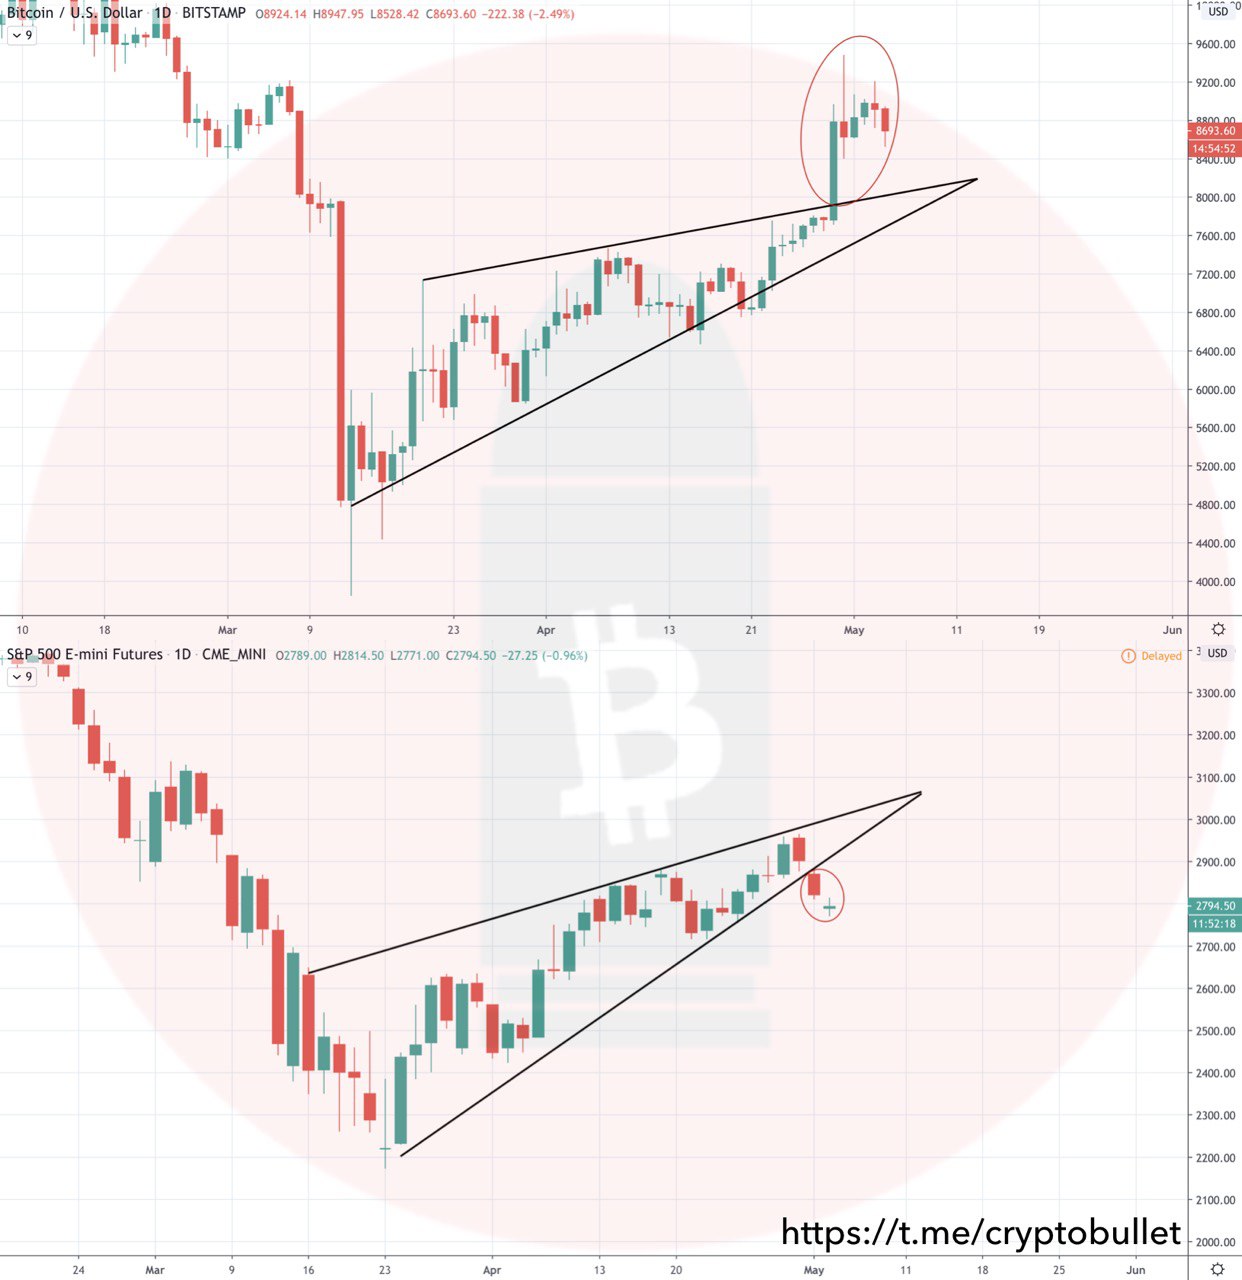
Last few trading days have been bad for stocks and metals, but great for Bitcoin
💭Has the highly anticipated decoupling finally begun?
It's a little too early to tell. Bitcoin has its own momentum and a lot of it has to do with the halving
📌What you have to understand is that a ten year trend does not get broken on one day! We need to see a different weekly trend confirmed on both assets as they are trending
BTC: Sell in May and Go Away?
https://www.tradingview.com/chart/XBTUSD/CUfU5cPC-BTC-Sell-in-May-and-Go-Away/
❗️Guys, please, click the LIKE button. We would appreciate it
https://www.tradingview.com/chart/XBTUSD/CUfU5cPC-BTC-Sell-in-May-and-Go-Away/
❗️Guys, please, click the LIKE button. We would appreciate it
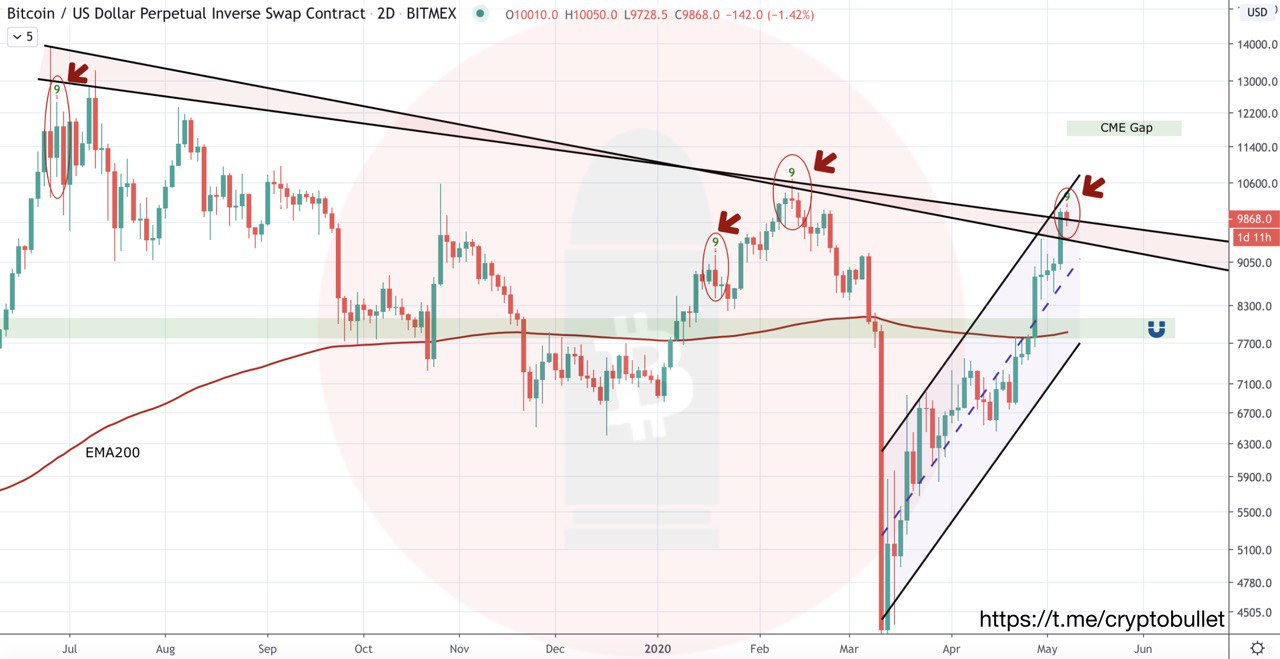
BTC 2D chart
Here is something really important
The current 2d candle is on a TD-9 sell
Check prior three times when the market gave us such a signal:
- 28th of June, 2019 (near the top)
- 19th of January, 2020 (led to a small correction)
- 12th of February, 2020 (perfectly marked the top before a complete meltdown) this 2d candle also contained a 1d td-9 sell
Current 2d candle started today, so there are 36 hours before the closure
📍The daily is also coming up on a TD-9 sell on May 10th if nothing extraordinary happens
By the way, the halving (the event that everyone has been talking about and what’s been driving the market) is scheduled to occur on May 11th
⚠️Be extremely cautious these days! "Sell the news" action can start harshly and all of a sudden
CryptoBullet
BTC 2D chart Here is something really important The current 2d candle is on a TD-9 sell Check prior three times when the market gave us such a signal: - 28th of June, 2019 (near the top) - 19th of January, 2020 (led to a small correction) - 12th of February…
📉Here is the market crash I warned you!
Downside Target Zone Reached!
Congratulations!
Downside Target Zone Reached!
Congratulations!