
CryptoBullet
NANO/BTC looks good here, but we need to see a breakout. Once we break out of the downward channel (generally bullish formation), we’ll go up swiftly. Bull div present. 🎯Targets for the breakout on the chart
NANO/BTC update
Daily perspective
Today we’ve tested the channel’s resistance (which is in line with EMA200) once again. Should this one break and there we go🚀
Daily perspective
Today we’ve tested the channel’s resistance (which is in line with EMA200) once again. Should this one break and there we go🚀
CryptoBullet
BTC 8h update The price is again struggling against the mid line of the channel. If we manage to break it, the CME Gap at ~11.7k will be at risk of getting filled. Watching this one as well
BTC 8h update
We’ve tried to break above the mid line of the channel once again
There is still $1 billion rocket fuel of Open Interest right now. The big move is yet to come
We’ve tried to break above the mid line of the channel once again
There is still $1 billion rocket fuel of Open Interest right now. The big move is yet to come
BTC Daily chart
⚠️Here is a point of concern: today’s candle is TD-9 sell. Moreover it’s TD-9 sell on 2d chart
Watch that trendline on the RSI as well. It will confirm a correction.
[ But if this does not result into a correction + taking into account the number of attempts to break above the mid line of the channel on 8h, to have a blow-off top and fill the CME Gap at ~11.5k will become the most realistic scenario ]
LTCUSD Golden Cross between EMA50 & EMA200 on the Daily
📌 Note
Bearish crossing between EMA50 & EMA200 in May 2018 resulted into a devastating drop (-83%)
Bullish crossing between EMA50 & EMA200 in May 2019 resulted into a fascinating gain (+155%)
Bearish crossing between EMA50 & EMA200 in August 2019 resulted into a significant drop (-46%)
📌 Note
Bearish crossing between EMA50 & EMA200 in May 2018 resulted into a devastating drop (-83%)
Bullish crossing between EMA50 & EMA200 in May 2019 resulted into a fascinating gain (+155%)
Bearish crossing between EMA50 & EMA200 in August 2019 resulted into a significant drop (-46%)
CryptoBullet
BTC Dominance Update 📌On Jan. 21 we predicted this Altcoin party you are seeing across the board simply by looking at the BTC dominance chart - it was ready to go down more and reach the EMA100 & the bottom line of the channel. And that’s exactly what happened!
BTC Dominance update
We are breaking down the upward channel and that’s a very bullish sign for Alts
💡The key point is the weekly close. If we close the weekly candle below 63%, expect the Altcoin party to continue 🚀
We are breaking down the upward channel and that’s a very bullish sign for Alts
💡The key point is the weekly close. If we close the weekly candle below 63%, expect the Altcoin party to continue 🚀
CryptoBullet
BTC 8h update We’ve tried to break above the mid line of the channel once again There is still $1 billion rocket fuel of Open Interest right now. The big move is yet to come
BTC flash crash (Pay attention to the BitMEX funding)
👉The price hit the channel’s support and perfectly got caught by EMA50 which we had on our 8h chart
Now we are above 10k again
👉The price hit the channel’s support and perfectly got caught by EMA50 which we had on our 8h chart
Now we are above 10k again
CryptoBullet
BTC flash crash (Pay attention to the BitMEX funding) 👉The price hit the channel’s support and perfectly got caught by EMA50 which we had on our 8h chart Now we are above 10k again
BTC 8h update
The Upward Channel broke down along with the EMA50
Support trendline on the RSI broke down
The Upward Channel broke down along with the EMA50
Support trendline on the RSI broke down
CryptoBullet
BTC: TD-9 sell on 2D chart
Well, we warned you guys about this correction when we were almost at the very top
2D chart was on TD-9 sell along with the daily.
2D chart was on TD-9 sell along with the daily.
CryptoBullet
BTC Daily chart ⚠️Here is a point of concern: today’s candle is TD-9 sell. Moreover it’s TD-9 sell on 2d chart Watch that trendline on the RSI as well. It will confirm a correction. [ But if this does not result into a correction + taking into account…
BTC Daily chart #update
📉 Parabola got broken down two days ago along with the support trendline on the RSI
In previous daily update we recommended to use that trend line on the RSI as confirmation.
Once we broke it, the correction kicked off and the falling accelerated.
Does this drop mean doom for bitcoin? No
💡As of right now it looks like a perfect pullback into the Golden Cross between MA50 & MA200 which is going to happen tomorrow (if we do not fall significantly lower from here).
Will We See $800 ETH Soon? Must read
https://www.tradingview.com/chart/ETHUSD/QDEYxcJ9-Will-We-See-800-ETH-Soon/
❗️Guys, please, click the LIKE button. We would appreciate it.
https://www.tradingview.com/chart/ETHUSD/QDEYxcJ9-Will-We-See-800-ETH-Soon/
❗️Guys, please, click the LIKE button. We would appreciate it.
BTC Massive Update
https://www.tradingview.com/chart/XBTUSD/GVZ7z6gz-BTC-Massive-Update/
❗️Guys, please, click the LIKE button. We would appreciate it.
https://www.tradingview.com/chart/XBTUSD/GVZ7z6gz-BTC-Massive-Update/
❗️Guys, please, click the LIKE button. We would appreciate it.
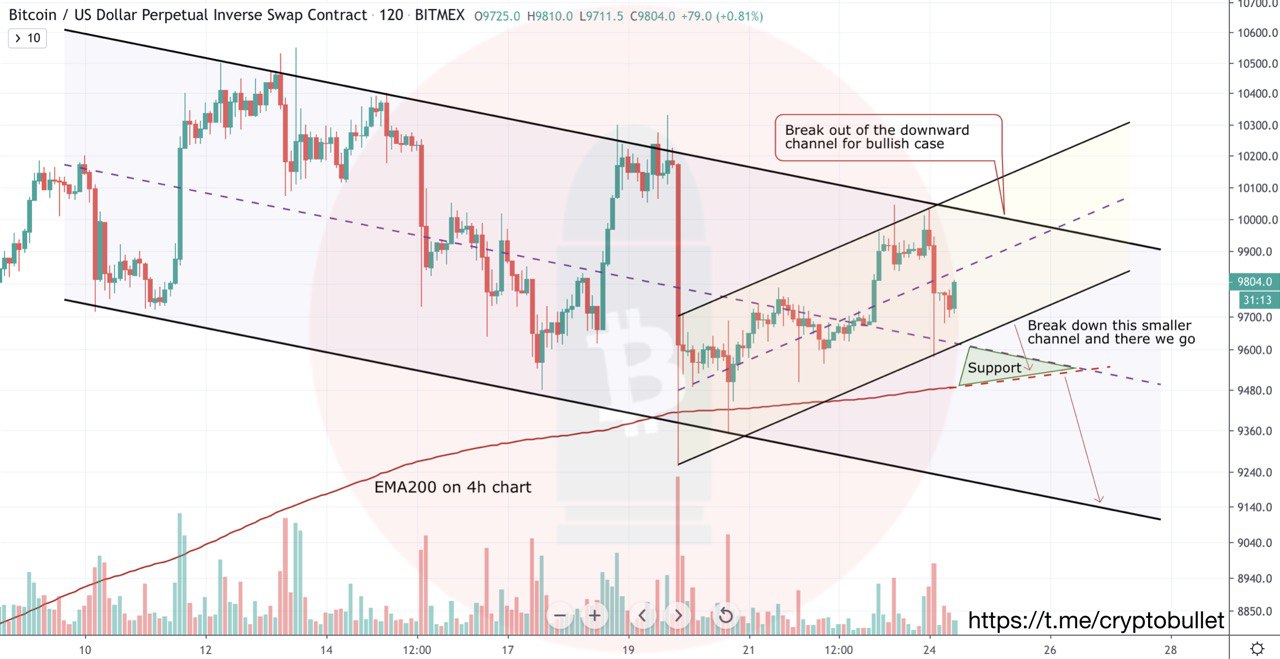
BTC Update
📌Here we have two channels: big downward channel & a small upward one
If we break down the small upward channel, we’ll hit EMA200 on 4h chart pretty quickly and it will unlikely hold, because there were two tests of it and with each one the support gets weaker.
Break down this EMA200 and the way to the bottom of the big downward channel will be open
🐂 For bullish case we need to break out of the downward channel to the upside