
BTC: Monthly Outlook
https://www.tradingview.com/chart/BTCUSD/V8O9a8D8-BTC-Monthly-Outlook/
❗️Don't forget to subscribe to our Trading View profile & press the like button. We would appreciate it.
https://www.tradingview.com/chart/BTCUSD/V8O9a8D8-BTC-Monthly-Outlook/
❗️Don't forget to subscribe to our Trading View profile & press the like button. We would appreciate it.
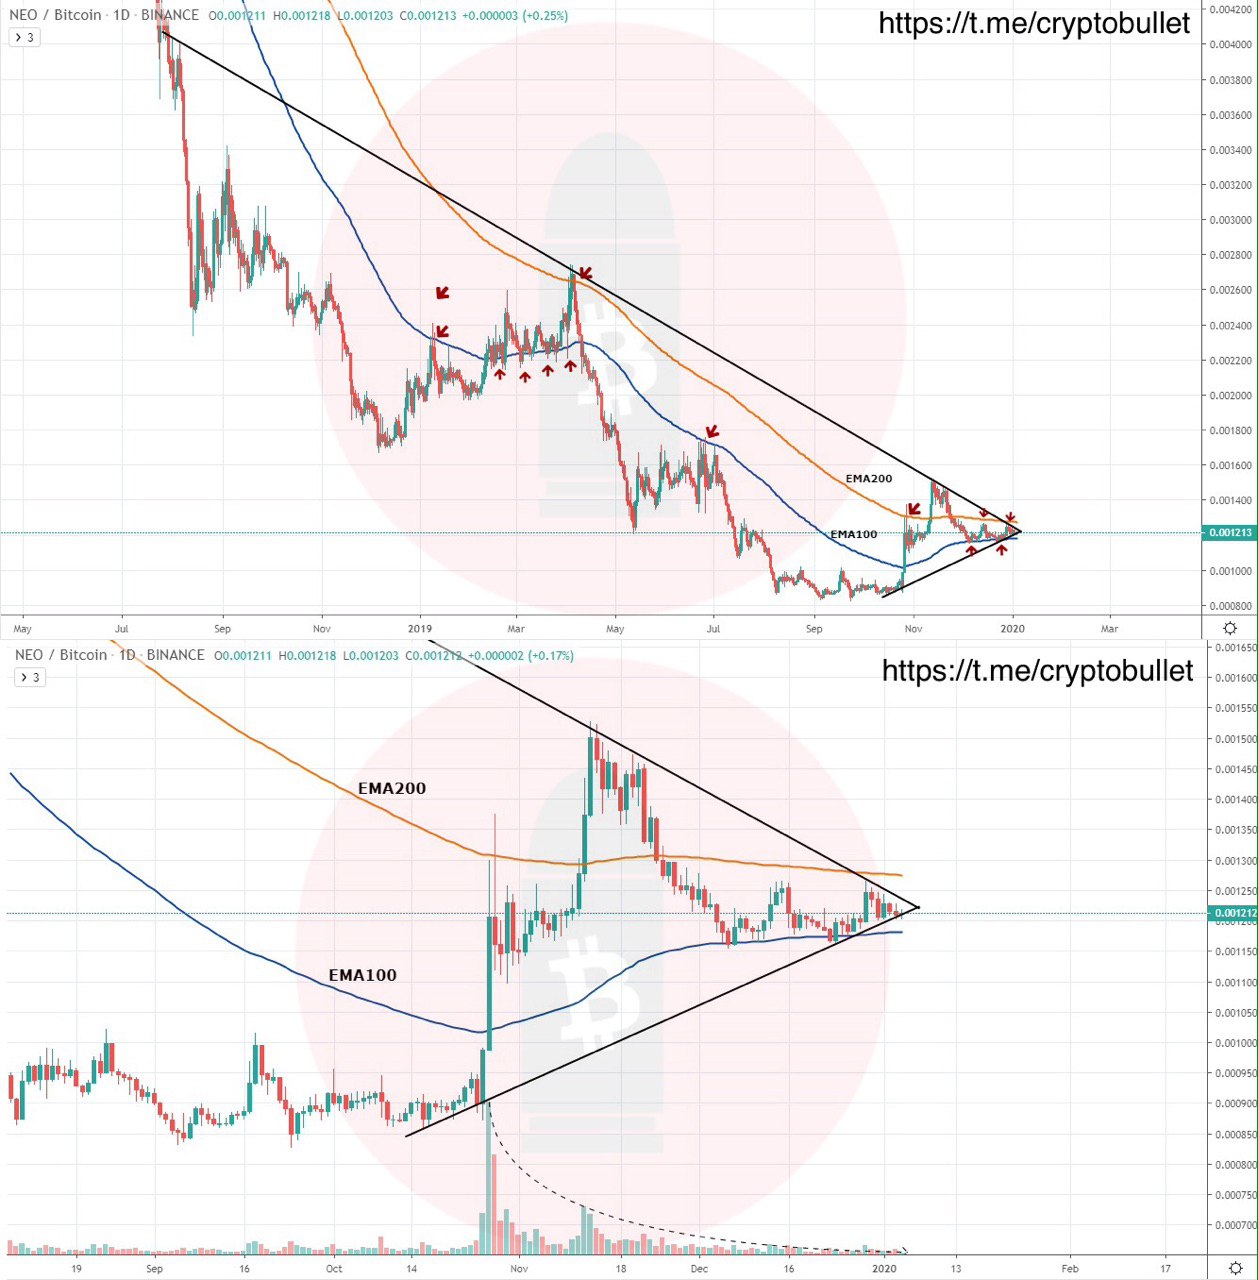
Decisive move is coming for NEOBTC
The price is being squeezed between EMA200 & EMA100. These MAs have been pretty relevant and acted as strong support/resistance. Also pay attention to the trendlines - breakout is close.
The range is getting extremely tight. Volume declining. Be ready
The price is being squeezed between EMA200 & EMA100. These MAs have been pretty relevant and acted as strong support/resistance. Also pay attention to the trendlines - breakout is close.
The range is getting extremely tight. Volume declining. Be ready
BTC: There Is So Much Resistance
https://www.tradingview.com/chart/BTCUSD/N6VAMtce-BTC-There-Is-So-Much-Resistance
❗️Don't forget to subscribe to our Trading View profile. And please, press the LIKE button. We would appreciate it.
https://www.tradingview.com/chart/BTCUSD/N6VAMtce-BTC-There-Is-So-Much-Resistance
❗️Don't forget to subscribe to our Trading View profile. And please, press the LIKE button. We would appreciate it.
BTC: Wyckoff Accumulation Confirmed! Important BTC update
https://www.tradingview.com/chart/BTCUSD/hOSmUMbh-BTC-Wyckoff-Accumulation-Confirmed/
❗️Don't forget to subscribe to our Trading View profile. And please, press the LIKE button. We would appreciate it.
https://www.tradingview.com/chart/BTCUSD/hOSmUMbh-BTC-Wyckoff-Accumulation-Confirmed/
❗️Don't forget to subscribe to our Trading View profile. And please, press the LIKE button. We would appreciate it.
BTC: Bulls, Do Not Get Overexcited! MUST READ
https://www.tradingview.com/chart/BTCUSD/FZyz3pKV-BTC-Bulls-Do-Not-Get-Overexcited
❗️Don't forget to subscribe to our Trading View profile. And please, press the LIKE button. We would appreciate it.
https://www.tradingview.com/chart/BTCUSD/FZyz3pKV-BTC-Bulls-Do-Not-Get-Overexcited
❗️Don't forget to subscribe to our Trading View profile. And please, press the LIKE button. We would appreciate it.
BTC weekly
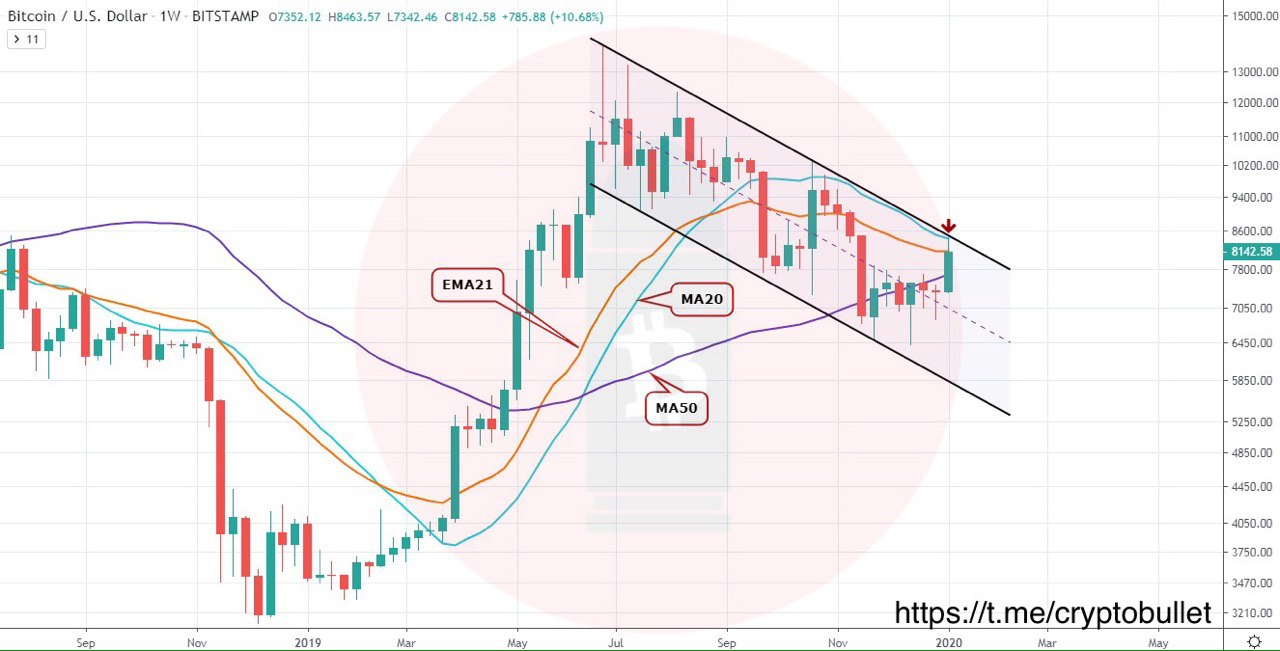
The weekly close is important, because we are probably going to close the weekly candle above the MA50, which is a pretty good sign.
📌Now the EMA21 is the challenge, as well as the MA20.
The channel is drawn in the most conservative fashion, so the resistance is not broken yet (which is pretty much in line with what we see on the daily)
A multi hundred dollar move is ahead for Bitcoin
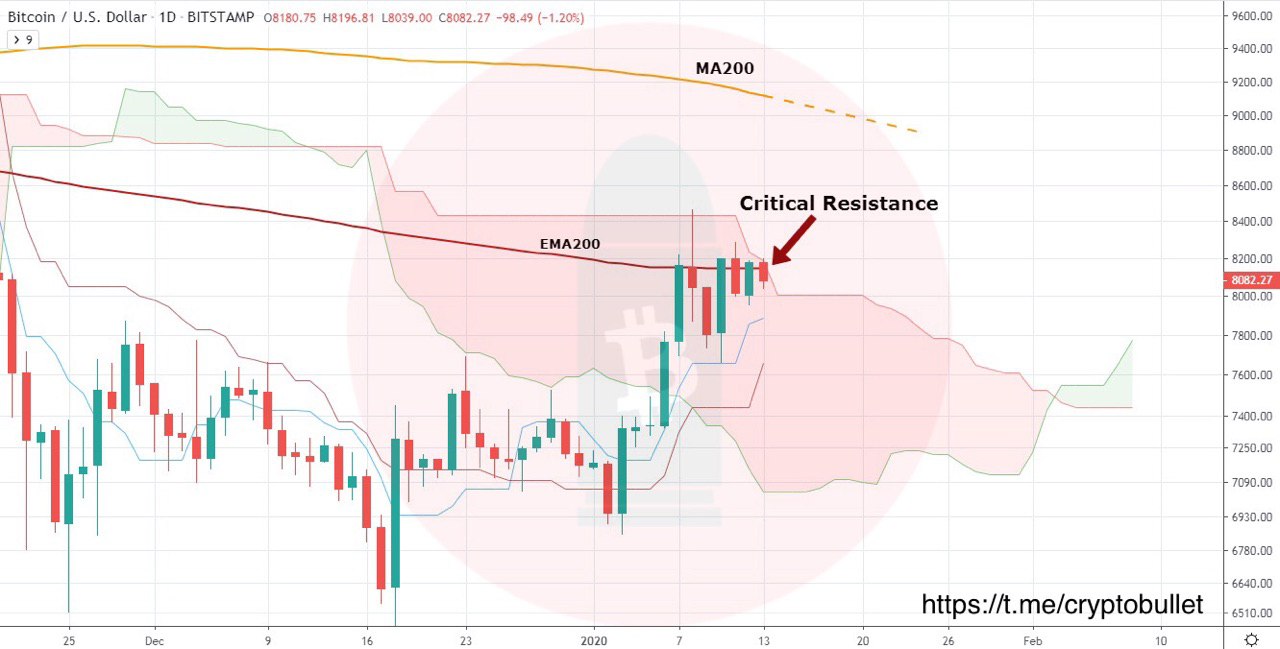
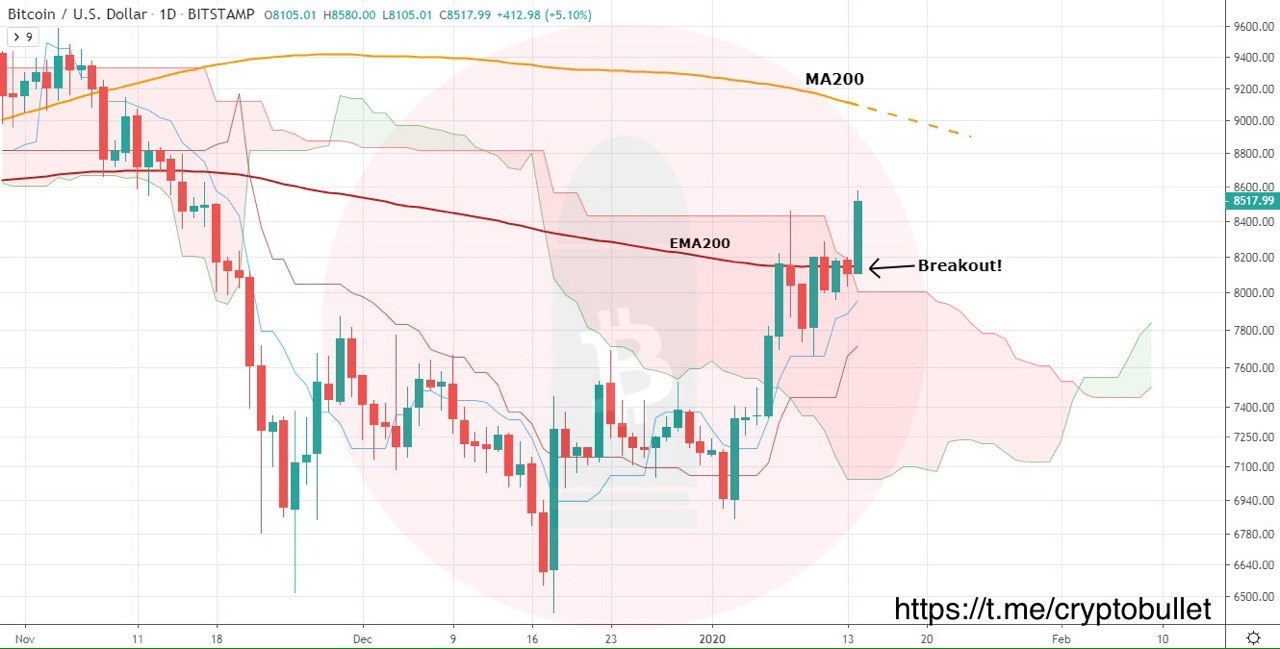
📌Notice how the Ichimoku Cloud still keeps the price inside and now we are pretty much close to the decisive move.
⚠️Right now the Cloud resistance is in line with the EMA200. If Bitcoin breaks above EMA200, we can look for a continuation towards 9k where we have MA200.
📌Notice how the Ichimoku Cloud still keeps the price inside and now we are pretty much close to the decisive move.
⚠️Right now the Cloud resistance is in line with the EMA200. If Bitcoin breaks above EMA200, we can look for a continuation towards 9k where we have MA200.
🚀Here is that multi hundred dollar move we warned you yesterday. Look at that $500 pump!
Resistance is broken, however we need to wait for the daily close, but as we mentioned yesterday, MA200 (9k region) is the ultimate target.
Resistance is broken, however we need to wait for the daily close, but as we mentioned yesterday, MA200 (9k region) is the ultimate target.
CryptoBullet
BTC: Wyckoff Accumulation Confirmed! Important BTC update https://www.tradingview.com/chart/BTCUSD/hOSmUMbh-BTC-Wyckoff-Accumulation-Confirmed/ ❗️Don't forget to subscribe to our Trading View profile. And please, press the LIKE button. We would appreciate…
🚀Do you remember our Trading View idea?
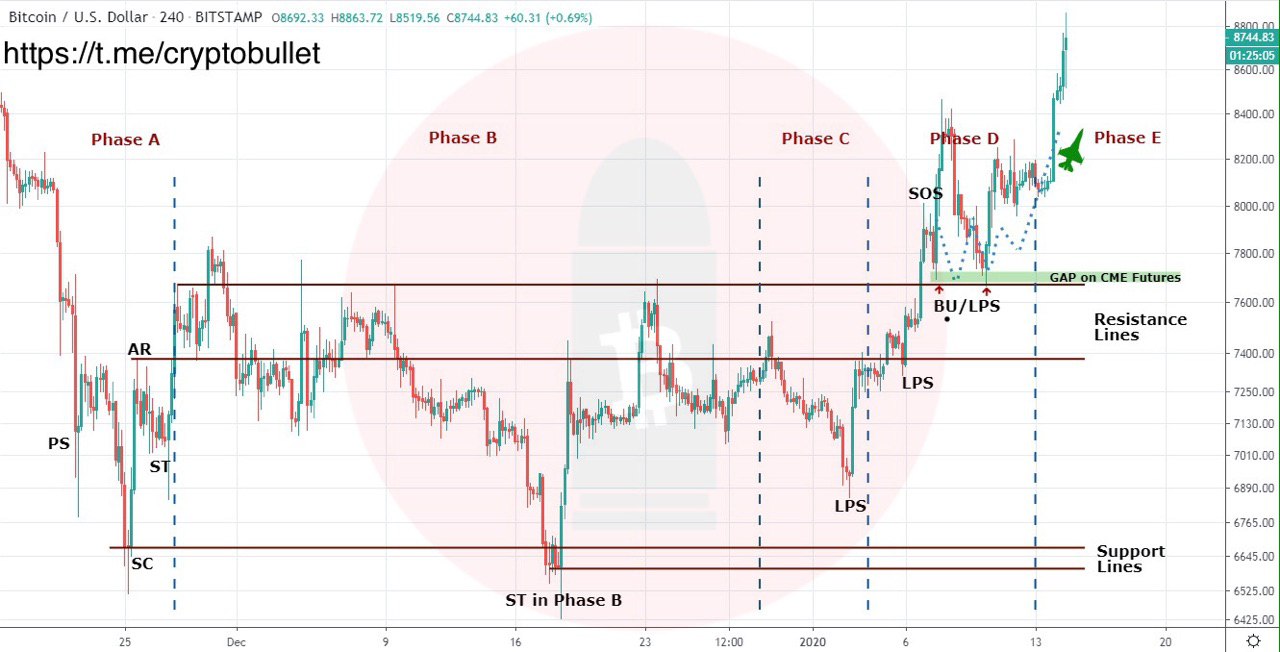
🚀Our Wyckoff Accumulation idea played out insanely well, that consolidation at the top was pretty textbook and the breakout was timed pretty well too - it happened in Phase E, according to the schematic.
Also pay attention to those wicks into the green box. That levels provided perfect entry.
Also pay attention to those wicks into the green box. That levels provided perfect entry.
ETH/USD weekly chart
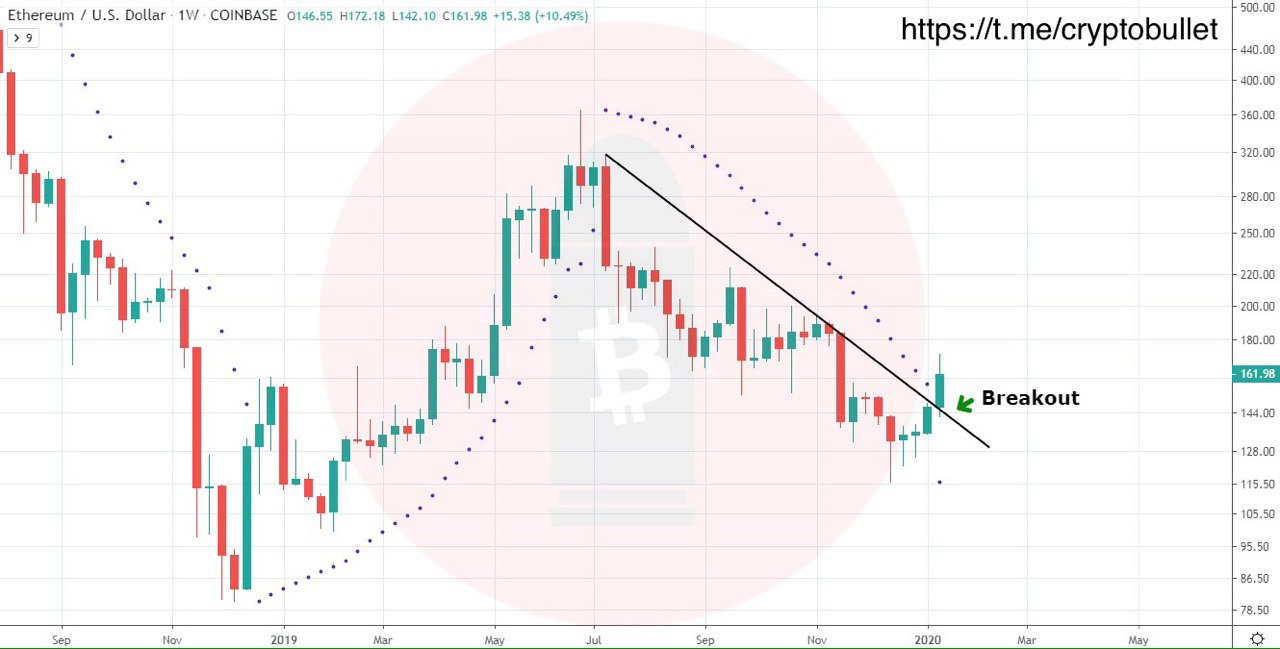
This is a very important breakout on the weekly. The resistance trendline that has been keeping the price below for 27 weeks is finally broken.
This is a very important breakout on the weekly. The resistance trendline that has been keeping the price below for 27 weeks is finally broken.
ETH/USD Daily chart
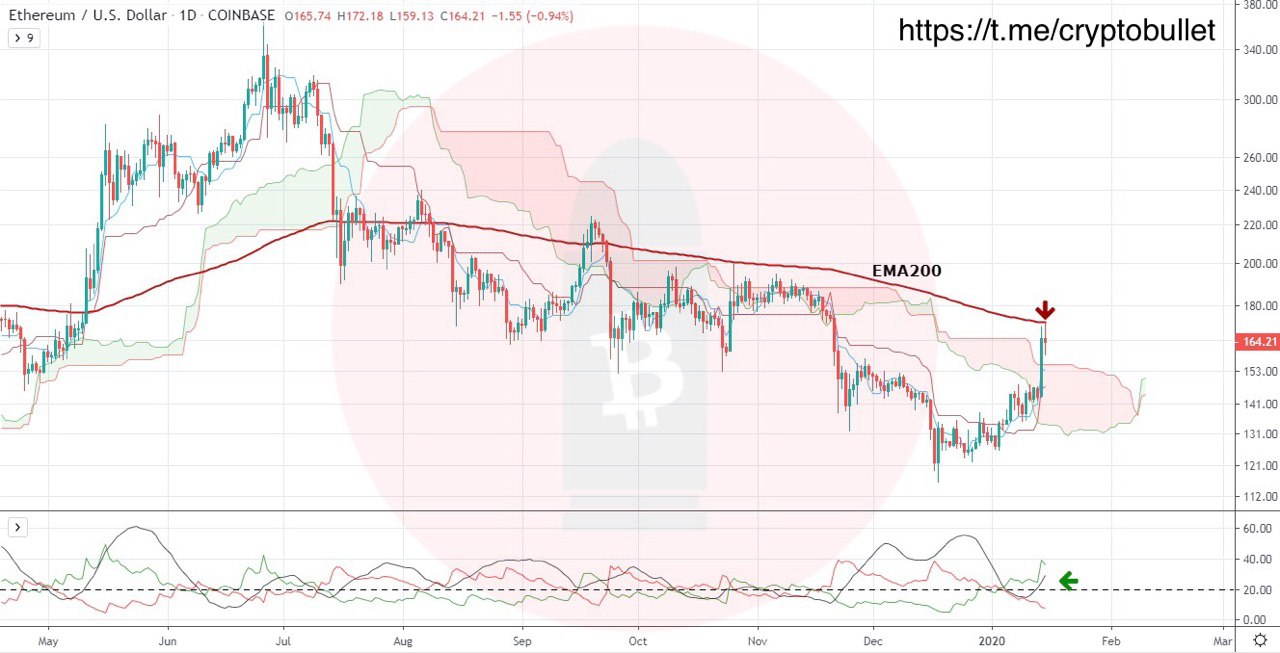
We are above the Ichimoku Cloud and going to have two daily closes above it for the first time since early July. Moreover, look at the ADX. It crossed 20 a couple of days ago and now entering Strong Trend territory, which with positive DMI above the negative and trending up suggests more upside.
📌Here's the key point - EMA200. Look at how perfectly ETH touched it on a wick and got rejected by this MA. Once this thing is broken, fasten your seatbelts, we'll go significantly higher!
CryptoBullet
🚀Here is that multi hundred dollar move we warned you yesterday. Look at that $500 pump! Resistance is broken, however we need to wait for the daily close, but as we mentioned yesterday, MA200 (9k region) is the ultimate target.
BTC update
🚀Our previous update worked out insanely well! Look at that:
We finally reached our ultimate target - MA200 and what happens next? As you see we’ve got a severe rejection at that level.
🚀Our previous update worked out insanely well! Look at that:
We finally reached our ultimate target - MA200 and what happens next? As you see we’ve got a severe rejection at that level.
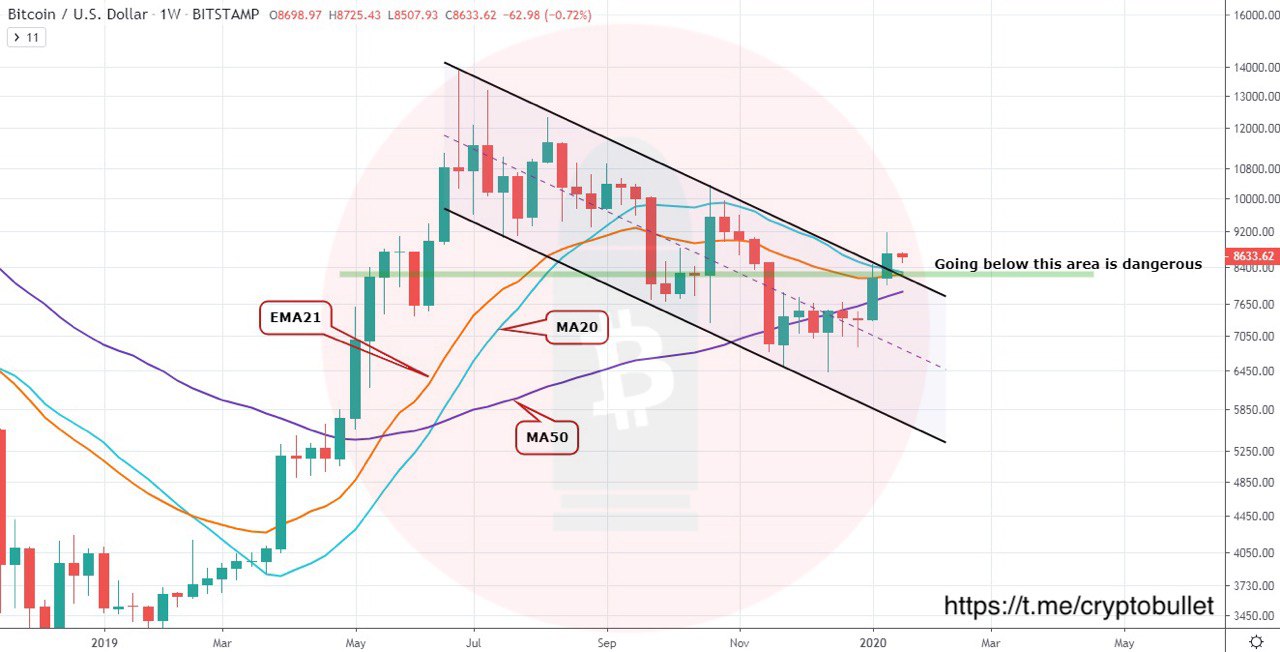
BTC weekly
Last week closed pretty bullish, because we managed to close above the downward channel resistance, MA20 & EMA21. Right now this cluster can act as a support and going below it would be dangerous for the bulls.
Last week closed pretty bullish, because we managed to close above the downward channel resistance, MA20 & EMA21. Right now this cluster can act as a support and going below it would be dangerous for the bulls.
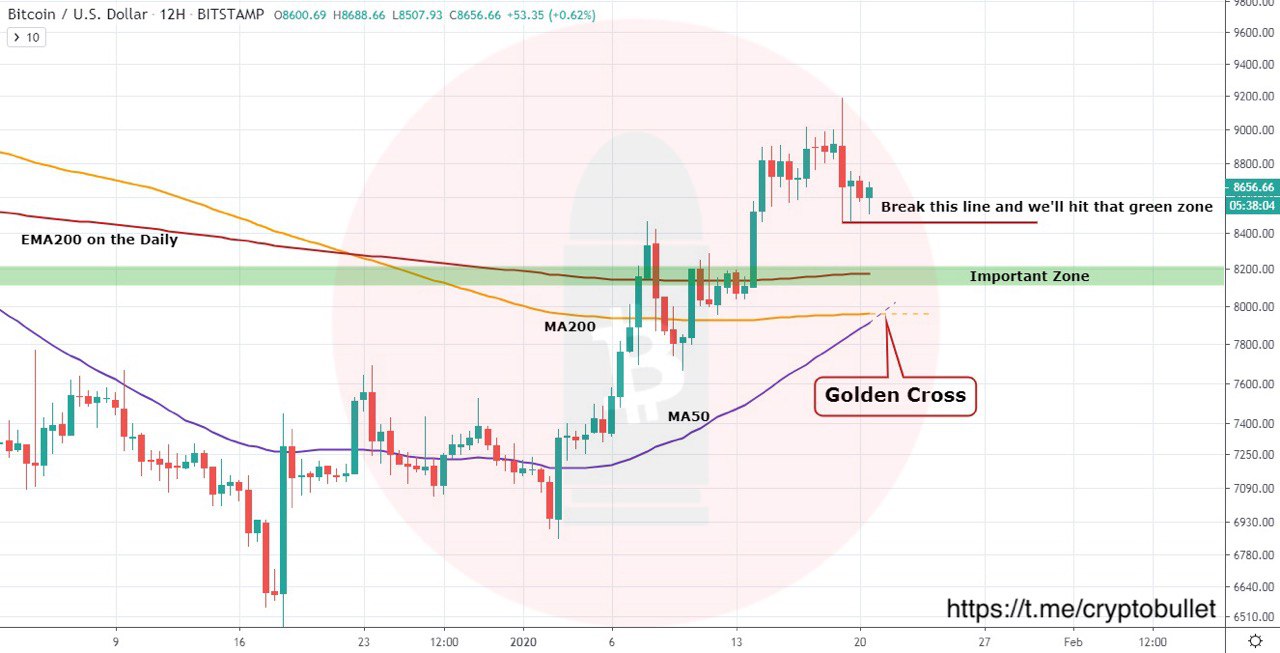
BTC 12h
If we break those lows, we’ll likely hit that green area where we have the daily EMA200
⚠️Important: We are on the verge of getting a Golden Cross. In a perfect world, the price would keep falling into the cross and after that take off.
If we break those lows, we’ll likely hit that green area where we have the daily EMA200
⚠️Important: We are on the verge of getting a Golden Cross. In a perfect world, the price would keep falling into the cross and after that take off.
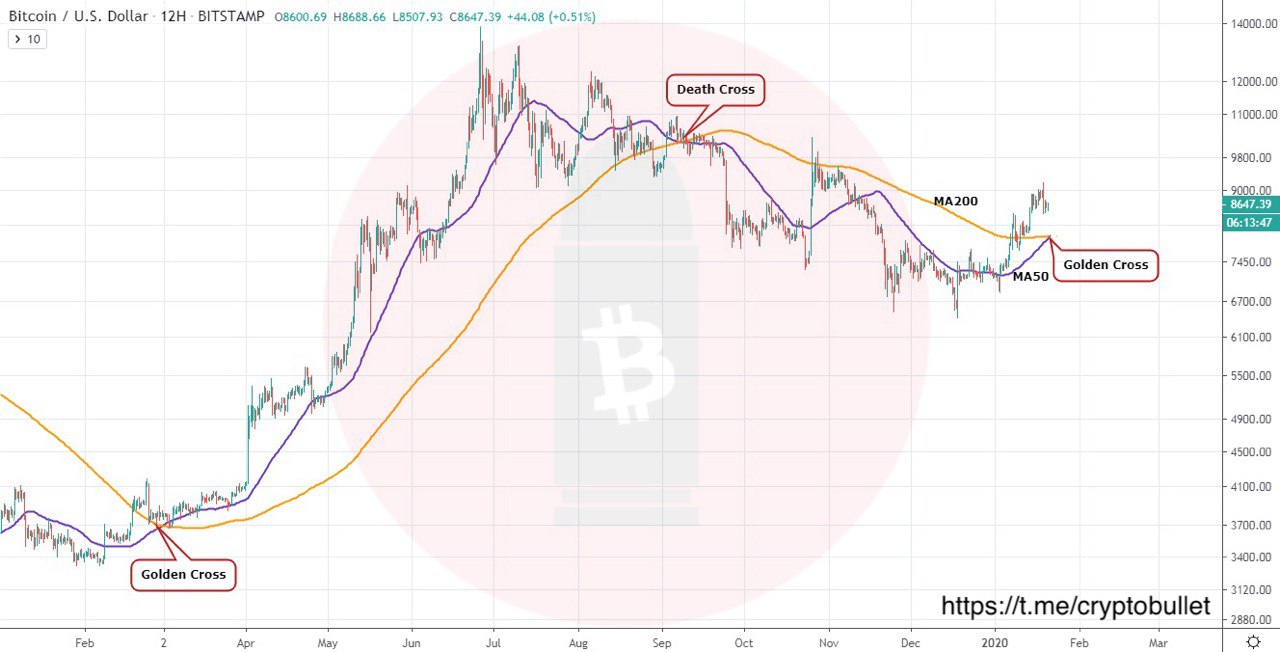
We haven’t seen the cross between MA200 & MA50 on 12h timeframe for a while and previous two times the crossing was pretty relevant and anticipated huge moves.
📌On March 1st, 2019 we had a Golden Cross. The price of Bitcoin was at ~3.7k. After the cross we reached 14k
📌On September 7th, 2019 we had a Death Cross. The price was at ~10k. After the cross we reached 6.4k
📌On March 1st, 2019 we had a Golden Cross. The price of Bitcoin was at ~3.7k. After the cross we reached 14k
📌On September 7th, 2019 we had a Death Cross. The price was at ~10k. After the cross we reached 6.4k
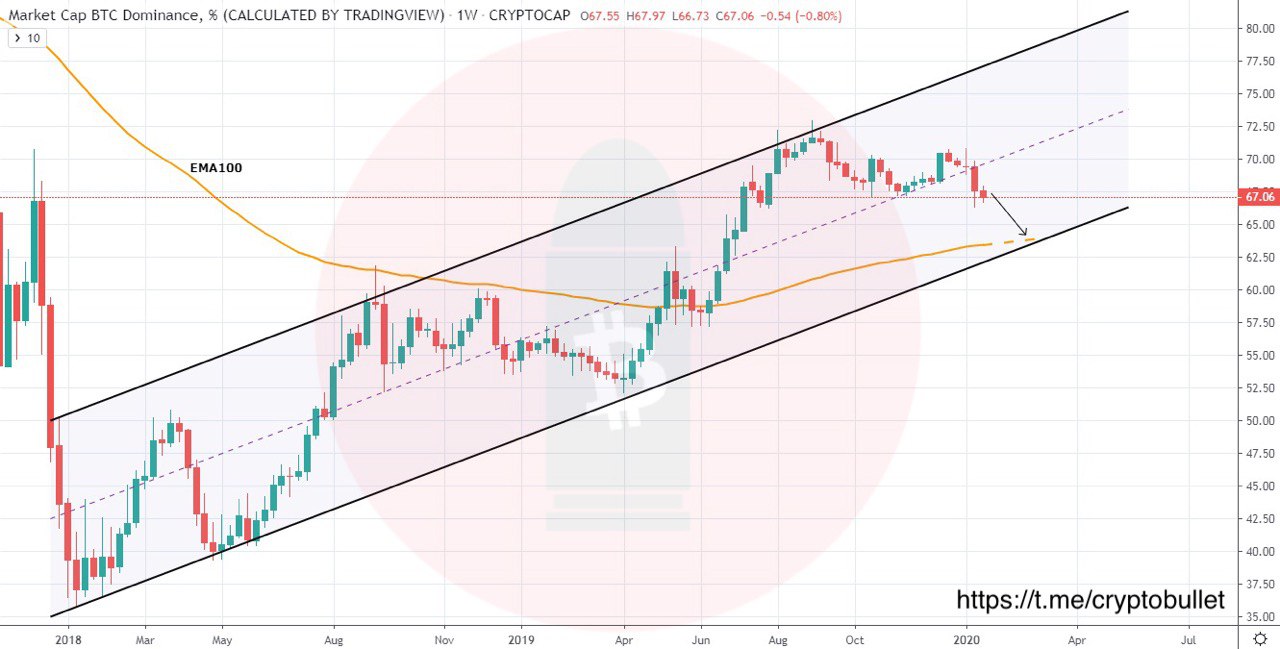
BTC Dominance
BTC dominance has been moving inside this Parallel Channel for quite a while. One week ago we broke down the mid line (notice how relevant the mid line of the Channel has been)
💡This is a pretty bullish chart for alts, because it suggests a return to the bottom of the channel, which would be a 5% decline from the current level.