
CryptoBullet
Alts/Bitcoin Market Cap #update We are facing tough resistance. Once we break it, we'll make it all the way up towards our second target (EMA50), which will mean a pretty decent altcoin party.
Alts/Bitcoin Market Cap #update
We continue to consolidate under that horizontal resistance creating an ascending triangle. Once we break out, that will be huge. The most interesting part is yet to start
We continue to consolidate under that horizontal resistance creating an ascending triangle. Once we break out, that will be huge. The most interesting part is yet to start
CryptoBullet
📍Previous LTC halving occurred late August 2015 and look what happened after it. 📉 LTC experienced a prolonged 75% decrease in price. This time in 2019 LTC started its way up and, eventually, decline earlier than in 2015. Does history repeat itself and…
LTC update: post-halving syndrome
On Aug. 5 (the day of LTC halving) we mentioned that LTC can have some issues after the halving like in 2015.
Right now LTC is playing with dangerous numbers by testing that horizontal level. This picture does not look good at all.
On Aug. 5 (the day of LTC halving) we mentioned that LTC can have some issues after the halving like in 2015.
Right now LTC is playing with dangerous numbers by testing that horizontal level. This picture does not look good at all.
CryptoBullet
📍Previous LTC halving occurred late August 2015 and look what happened after it. 📉 LTC experienced a prolonged 75% decrease in price. This time in 2019 LTC started its way up and, eventually, decline earlier than in 2015. Does history repeat itself and…
📉The LTC hashrate has dropped by more than 70% since its peak in mid July.
This was pretty obvious in August and we warned you about it.
Because of the declining LTC price and the upcoming BTC halving, miners lose interest to mine LTC.
This was pretty obvious in August and we warned you about it.
Because of the declining LTC price and the upcoming BTC halving, miners lose interest to mine LTC.
BTC: Same Pattern Once Again
https://www.tradingview.com/chart/BTCUSD/pdiyYCvr-BTC-Same-Pattern-Once-Again/
❗️Don't forget to subscribe to our Trading View profile & press the like button. We would appreciate it.
https://www.tradingview.com/chart/BTCUSD/pdiyYCvr-BTC-Same-Pattern-Once-Again/
❗️Don't forget to subscribe to our Trading View profile & press the like button. We would appreciate it.
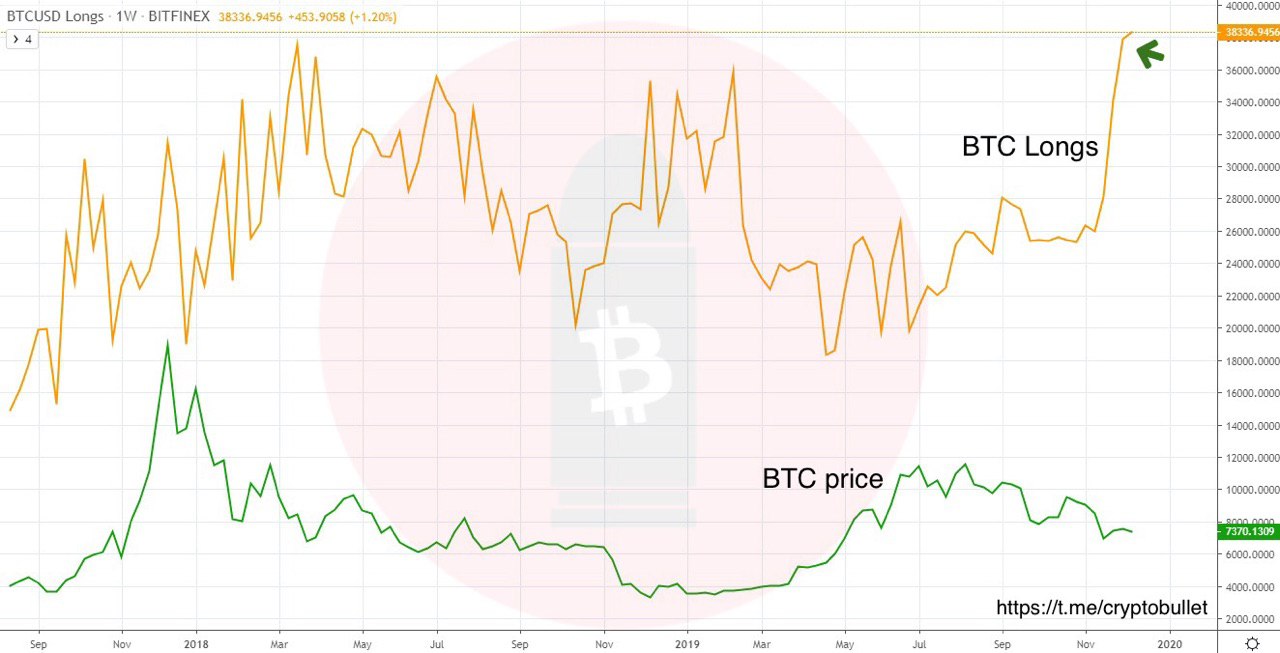
📌BTC Longs on Bitfinex keep piling up. This is something to pay attention to
[ Bitfinex: 86% long / 14% short
Bitmex: 48% long / 52% short ]
[ Bitfinex: 86% long / 14% short
Bitmex: 48% long / 52% short ]
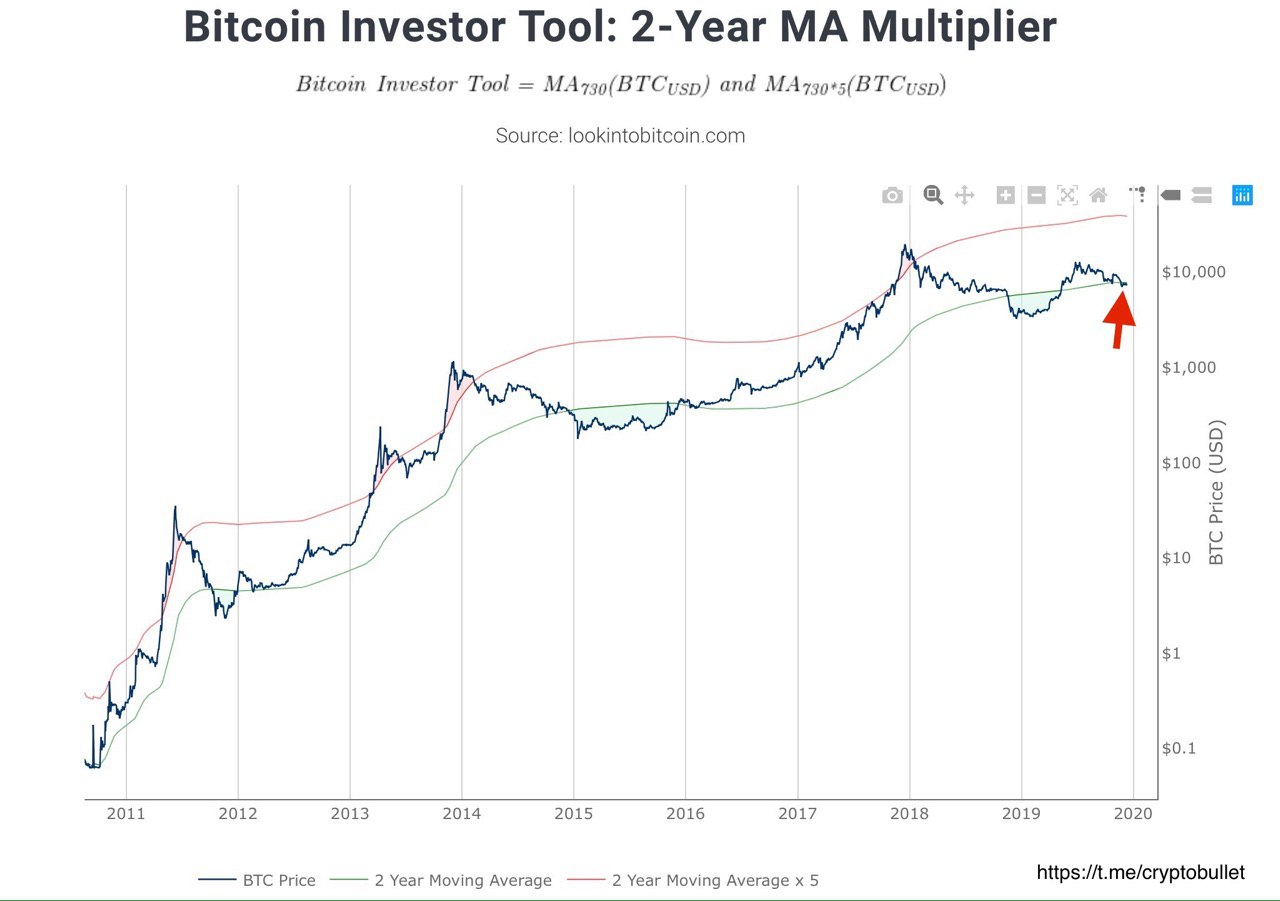
Long term investment tool: 2-Year MA Multiplier
Selling Bitcoin when price goes above the 2yr MA x 5 (red line) has been historically effective for taking profit
Buying Bitcoin when price drops below the 2yr MA (green line) has historically generated outsized returns
Looks like we are now in the buy zone. However, this chart does not tell you for how long we'll be there and how deep the buy zone is gonna be.
BTC: Fated to Go Below 6k?
https://www.tradingview.com/chart/BTCUSD/qnZSNCNV-BTC-Fated-to-Go-Below-6k/
❗️Don't forget to subscribe to our Trading View profile & press the like button. We would appreciate it.
https://www.tradingview.com/chart/BTCUSD/qnZSNCNV-BTC-Fated-to-Go-Below-6k/
❗️Don't forget to subscribe to our Trading View profile & press the like button. We would appreciate it.
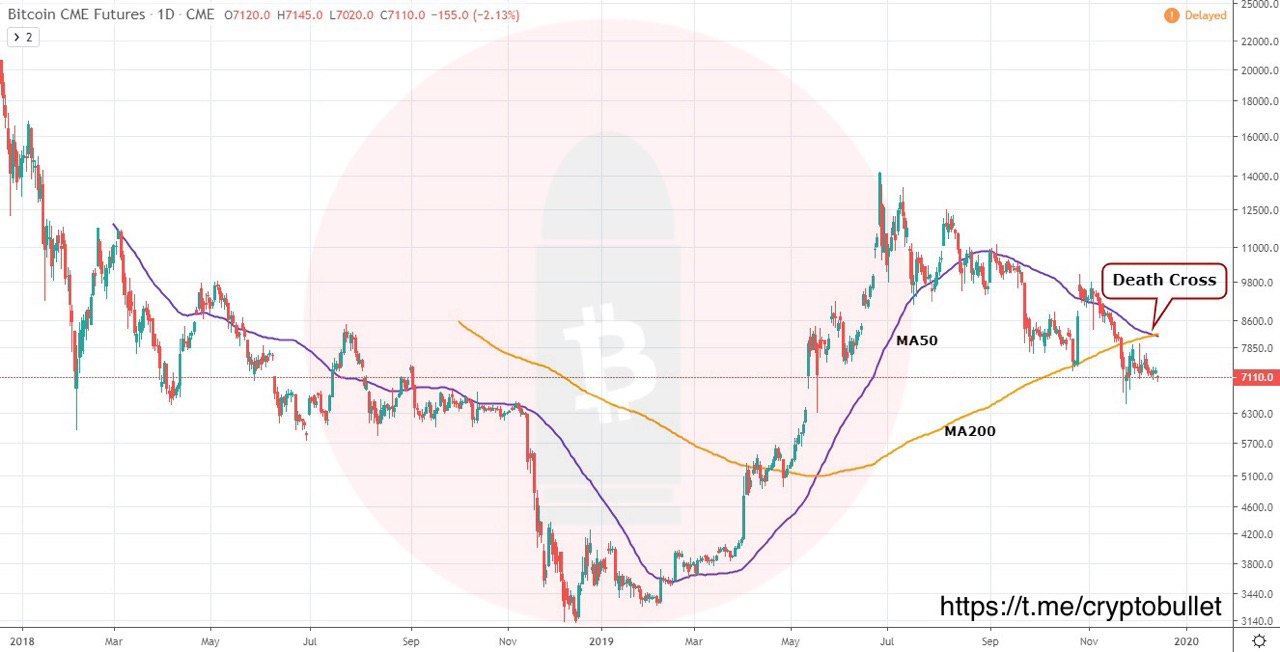
⚠️First death cross on CME BTC Futures!
📌However we do not have that much of the history, because the futures were launched in December 2017
📌However we do not have that much of the history, because the futures were launched in December 2017
BTC is heavily bearish
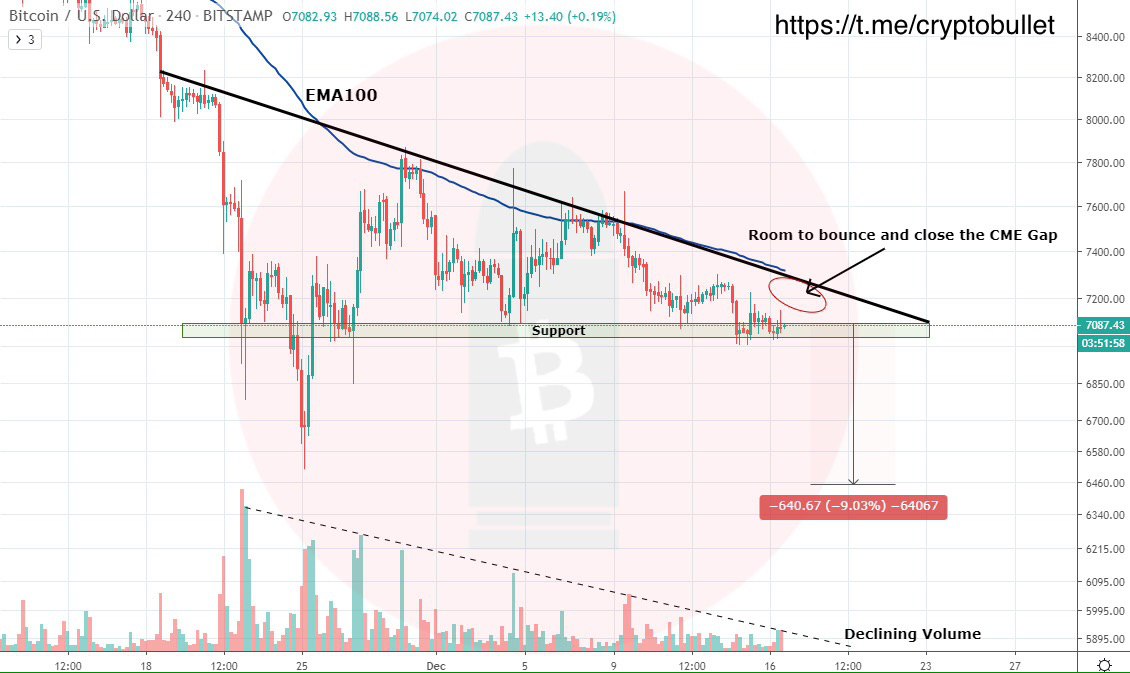
We keep creating lower highs. The support has been tested for numerous times and that's not bullish. So, this formation looks like a nice Descending Triangle confirmed by declining volume. Conservative target is 9% down, which would take us right below the yearly low (do you hide your stop there?)
💡Taking into account the CME Gap and how perfectly EMA100 has been rejecting the price, we can have the last bounce into 7200 area and get rejected there by the triangle's sloped line and EMA100 before the eventual breakdown.
If we break EMA100 and sustain the breakout, that will be bullish
CryptoBullet
BTC is heavily bearish We keep creating lower highs. The support has been tested for numerous times and that's not bullish. So, this formation looks like a nice Descending Triangle confirmed by declining volume. Conservative target is 9% down, which would…
There we go 📉
Like we said yesterday, breaking down was just a matter of time. We didn't even get a bounce to close the CME gap and the market just crashed.
Like we said yesterday, breaking down was just a matter of time. We didn't even get a bounce to close the CME gap and the market just crashed.
CryptoBullet
📌BTC Longs on Bitfinex keep piling up. This is something to pay attention to [ Bitfinex: 86% long / 14% short Bitmex: 48% long / 52% short ]
⚠️ BTC Longs on Bitfinex got out of control! There is an unprecedented amount of Longs. Something is cooking🔥
CryptoBullet
There we go 📉 Like we said yesterday, breaking down was just a matter of time. We didn't even get a bounce to close the CME gap and the market just crashed.
#BTC Update
Our analysis worked out perfectly!
🎯Target reached! Lower low established just like we expected!
Our analysis worked out perfectly!
🎯Target reached! Lower low established just like we expected!
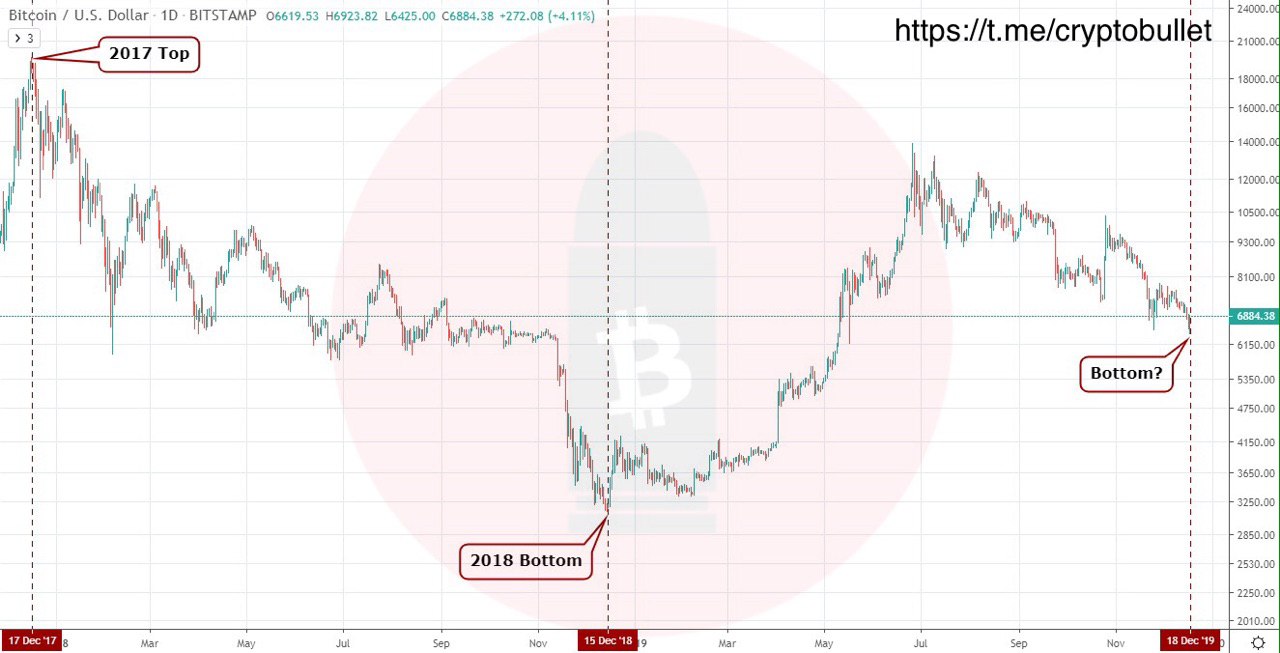
Today's #BTC low is remarkable and has chances to be the ultimate low.
And here is why
📌First of all, today we've got an elegant wick just under the previous low, which liquidated a lot of longs. And look how strongly we rebounded after establishing a lower low.
📌Secondly, mid December is a pretty important time period. It may look like a conspiracy theory, but notice:
Dec. 17, 2017 - Bitcoin tops out at 19.7k
Dec. 15, 2018 - Bitcoin bottoms out at 3.1k
Dec. 18, 2019 - Bitcoin creates a lowest low after topping out at 13880 in June.
💡So, taking this information into account, today's low can be a pivot point for the market. However, here's what you should understand: once such a pattern is identified, it has less chance to keep playing out successfully. Just keep that in mind and treat this top/low sequence with a grain of salt.
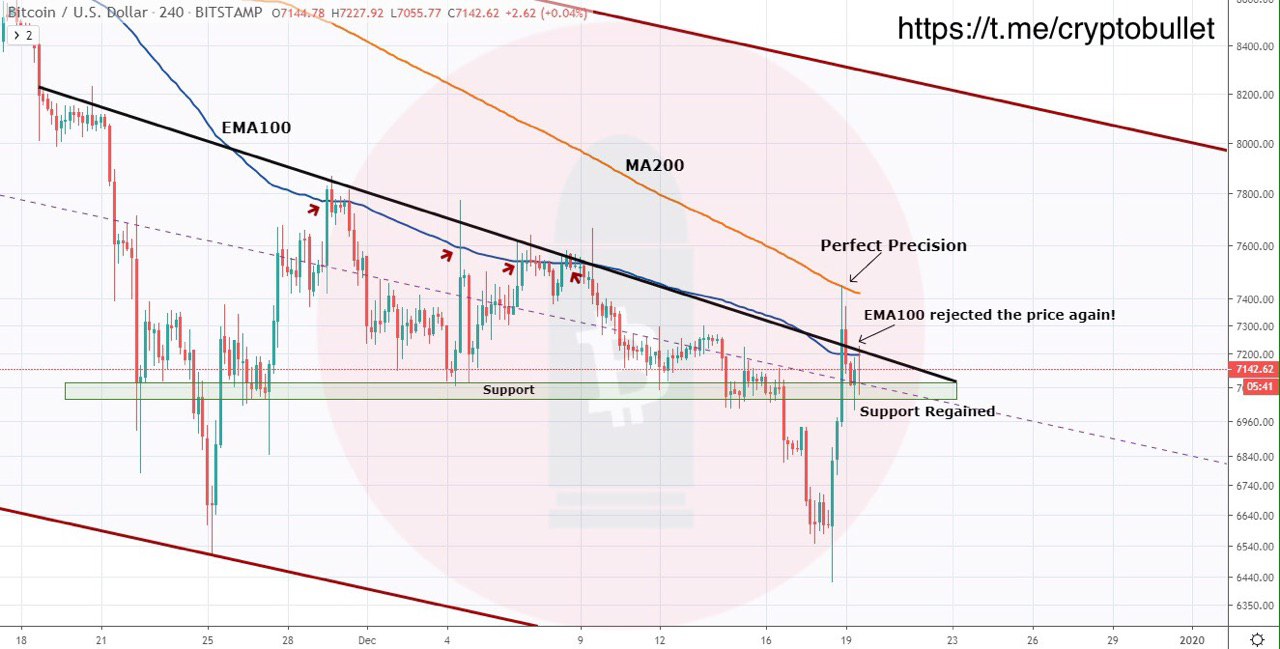
BTC update
Yesterday's pump took us all the way up to 7400 (significant area of resistance) and got rejected there by MA200. Notice how precise this move was. We exactly hit the MA and pulled back.
Furthermore, we didn’t manage to sustain the breakout above EMA100 and it rejected the price again, but we are holding the support that was regained in the result of the pump.
💡So, now the price is squeezed between the Support and EMA100. If we break EMA100 eventually, we'll have high chances to continue the move to the upside and reach the top of the downward channel (7800-8000).
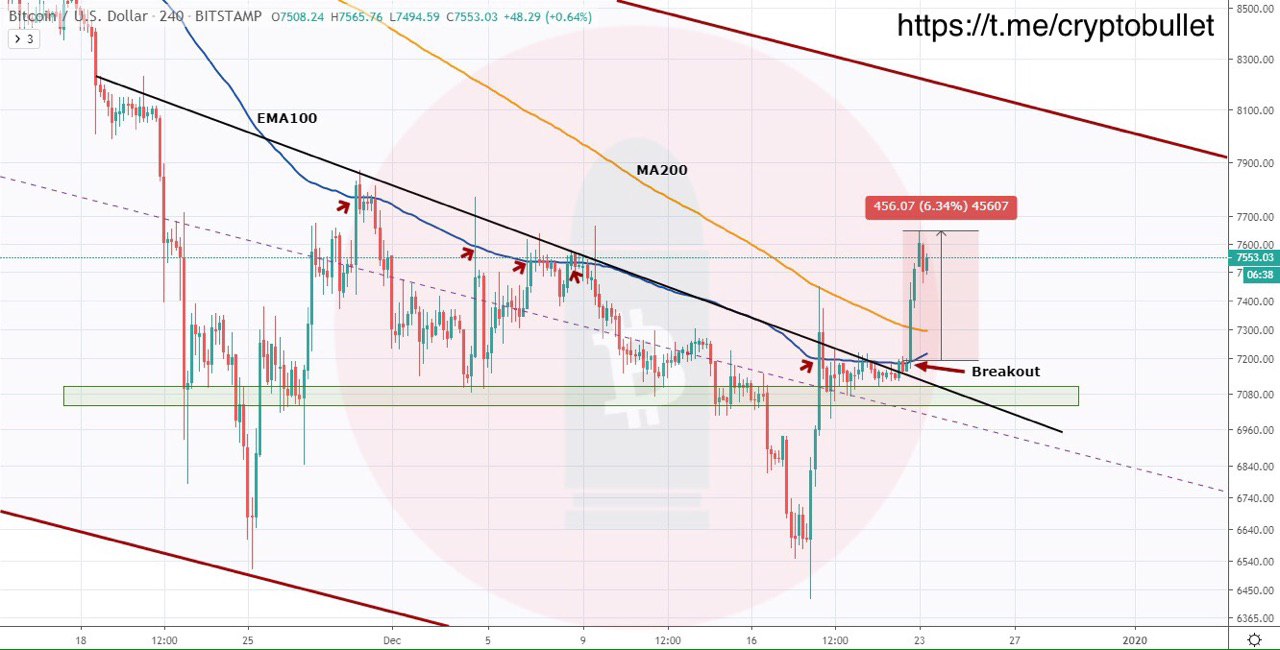
BTC update
EMA100 has been a pretty tough resistance, but it was eventually broken
📌And here is what we said in previous analysis: "If we break EMA100 eventually, we'll have high chances to continue the move to the upside and reach the top of the downward channel (7800-8000)"
This is almost what we got: we broke above the EMA100, sustained it and reached 7650. So, the analysis has pretty much succeeded, but we still have some room to go up.
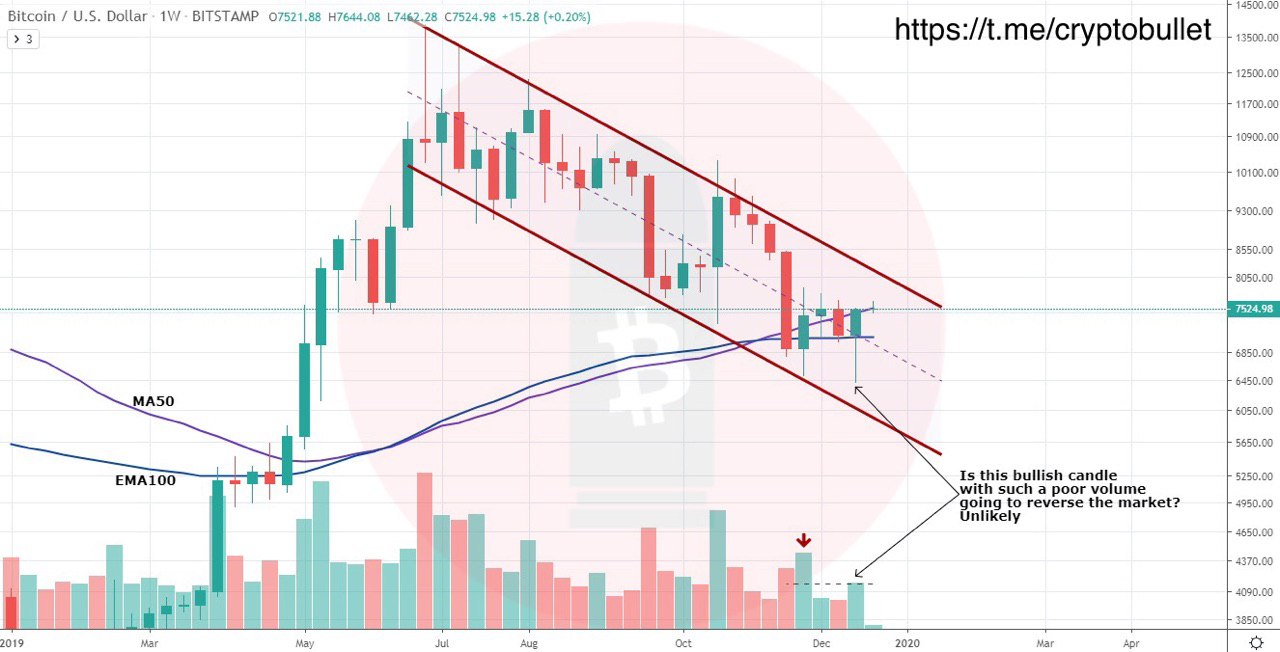
BTC weekly chart
The weekly candle closed like a bullish hammer and the price even managed to close above MA50. EMA100 held the price and that long wick below it is pretty bullish. It looks like a reversal, but here is the thing:
Look at that poor volume of that weekly hammer candle. It’s not even close to what we had on the week of Nov. 25 when we established the ultimate low at that time.
💡This fact suggests that this can be nothing more than a relief rally within a downward channel.
📌What can prevent it from being a failed rally attempt is breaking above the top of the downward channel and obviously creating a higher high.