
#BTC
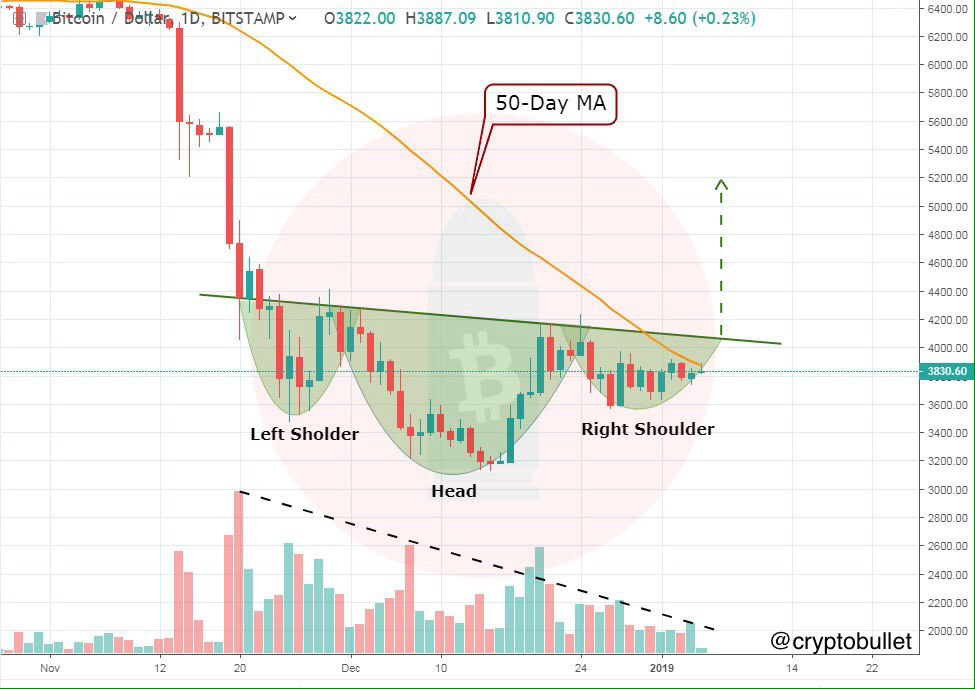
🔴 Inverse H&S pattern is easily spotted
Volume continues to decline which is going to lead to major price action likely in the coming days (the trend says down sub $3k, but..). Traders start feeling tension, so it’s the best time for fakeouts. Be on the look out.
Some traders treat this very obvious iH&S pattern on the opposite in order not to be fooled. Anyway there is a chance that iH&S here probably is another illusion to rekt traders, but guess what happens when the majority is waiting for the opposite outcome.
💡Frankly speaking, we think there is a strong chance to see a completion of this potential iH&S pattern with 5k target.
Even if this pattern gets invalidated, we believe that we will go close to 5k in Q1 of this year to lure more people before retesting the bottom and breaking it.
🗻 Big Picture: the probability of $3200 being the bottom is around 30%. We think we need to go lower with more red volume to end this bear market.
📌Also look how the daily chart continues to struggle against the 50-day MA. Failure to break above may result in a drop to 3450. Once we close above it, the next point of resistance becomes the prior swing high at 4200. If we make it back to 4200, there is a very high probability of breaking it.
👉What bothers us is that Longs continue to get highly leveraged as Shorts continue to deleverage on Bitfinex. That actually sets up a scenario for more downside pressure.
Also on Monday 7th January 2019, Bitfinex will be offline between three to seven hours for data migration. Perfect time for manipulation.
🔥Next couple of days can be pretty interesting.
#BTC
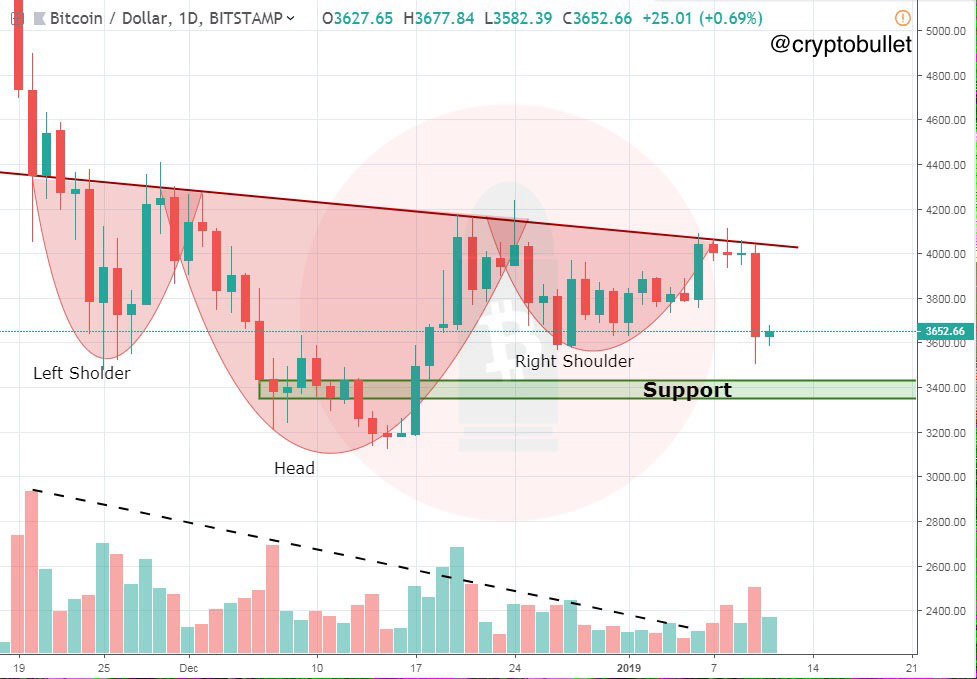
Inverse H&S didn’t break out to the upside, got rejected at the neckline. It is no longer valid.
📌 Longs on Bitfinex were too overleveraged + declining volume (pointing out the move to sub 3k), that’s what we were worried about and why we gave a warning about the risk for BTC price to roll over to the downside.
💡Now it’s becoming increasingly likely BTC will retest the lows around the 200-week MA (which is not good at all from the technical perspective) to form a Double Bottom.
Let’s see if this is just another "lower high" and if BTC continues to consolidate or moves to support range 3300-3450. We are not completely bearish yet. Expecting a reversal at the support. Before making a new low we should see 4400/4600. It’s reasonable for Q1 of this year to be green to lure more people before creating new lows. We were expecting sub 3k going into Q2, but with the turnaround in the market recently, the odds of that are decreasing.
Again, Big Picture: the probability of 3200 being the bottom is only around 30%. We are convinced that we’ll go lower this year.
CryptoBullet via @vote
Where do you think the final bottom for Bitcoin will be?
anonymous poll
2000-2500 – 246
👍👍👍👍👍👍👍 40%
BTC has already bottomed – 207
👍👍👍👍👍👍 34%
1600-1900 – 59
👍👍 10%
below 1k – 54
👍👍 9%
1000-1400 – 50
👍 8%
👥 616 people voted so far.
anonymous poll
2000-2500 – 246
👍👍👍👍👍👍👍 40%
BTC has already bottomed – 207
👍👍👍👍👍👍 34%
1600-1900 – 59
👍👍 10%
below 1k – 54
👍👍 9%
1000-1400 – 50
👍 8%
👥 616 people voted so far.
Guys, who passed the poll, thank you for this! Now we have information to work with.
As of now, we see that 32% of people think that BTC has already bottomed. It corresponds to our probability that we've already seen the bottom (we give it 30% chance). We don't want you to change your mind, but take the assumption that we'll go lower and be ready for another potential 50% drop. So those, who think we BTC won't go lower, definitely should have fiat to average just in case.
💡All October we were insisting that 6k eventually would not hold the price and we would go significantly lower. Now we are 40% lower. And we don't see that the last seller has sold. Also we haven't hit bottom because people are still calling garbage coins "gems". We think that the next big drop will mean the end for the shitcoins.
📌We are almost certain that the bear market has not ended yet and that we'll go lower this year.
Now what's interesting, 41% of those who voted think that BTC will hit the bottom somewhere between $2000 and $2500. We kinda agree with you, this is a fit range to be the final stop, but there is smth to say in this regard further.
Going to 1000-1400 range is reasonable because it's the high of 2013 bull market and it should be tested. We guess it's the obvious stop for BTC and market makers may not allow you to buy at those levels, but anything can happen.
⚠️ There is a small chance of getting a wick just under 1k. And if you are reading it and taking it seriously, you should prepare for any outcome, even sub 1k prices if you are lucky to buy so cheap. But what bothers us is that closing under $1k on the weekly basis (❗️) means a disaster for the whole ecosystem: BTC existence will be threatened.
As of now, we see that 32% of people think that BTC has already bottomed. It corresponds to our probability that we've already seen the bottom (we give it 30% chance). We don't want you to change your mind, but take the assumption that we'll go lower and be ready for another potential 50% drop. So those, who think we BTC won't go lower, definitely should have fiat to average just in case.
Bear markets end when the last seller has sold. 💡All October we were insisting that 6k eventually would not hold the price and we would go significantly lower. Now we are 40% lower. And we don't see that the last seller has sold. Also we haven't hit bottom because people are still calling garbage coins "gems". We think that the next big drop will mean the end for the shitcoins.
📌We are almost certain that the bear market has not ended yet and that we'll go lower this year.
Now what's interesting, 41% of those who voted think that BTC will hit the bottom somewhere between $2000 and $2500. We kinda agree with you, this is a fit range to be the final stop, but there is smth to say in this regard further.
Going to 1000-1400 range is reasonable because it's the high of 2013 bull market and it should be tested. We guess it's the obvious stop for BTC and market makers may not allow you to buy at those levels, but anything can happen.
⚠️ There is a small chance of getting a wick just under 1k. And if you are reading it and taking it seriously, you should prepare for any outcome, even sub 1k prices if you are lucky to buy so cheap. But what bothers us is that closing under $1k on the weekly basis (❗️) means a disaster for the whole ecosystem: BTC existence will be threatened.
🎓 Corrections take place in price and corrections take place in time.
🗞 The bad news is that by not being able to have a strong dead cat bounce into 5k and then taking extra time to get back down to 3k, we’re probably gonna go lower than most people think, because time has to run its course.
And if the price can not delay the time to get us to sub 3k by having a reasonable dead cat bounce & staying a little bit higher, it’s a big trouble for the bulls.
🎯 With that being said, we are looking at sub $2000 prices as an ultimate bottom of the bear market (if we can’t have a very good bounce)
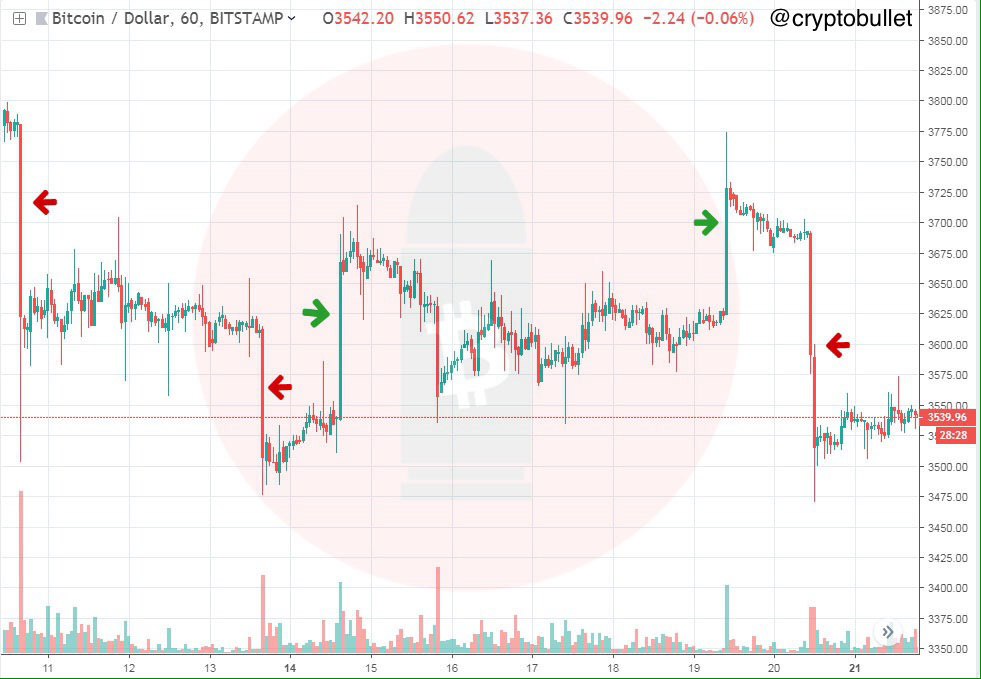
Manipulation in a range or people with a lot of money that are bored
Look at these 1h monster candles. This is no longer a coincidence, but a coordinated work.
[ When price is ranging, there is more opportunity for manipulation, because it's like the market is scared to go above or below a certain price ]
📌 As long as whoever is doing it, Bitcoin is gonna struggle to get out of the bear market.
CryptoBullet
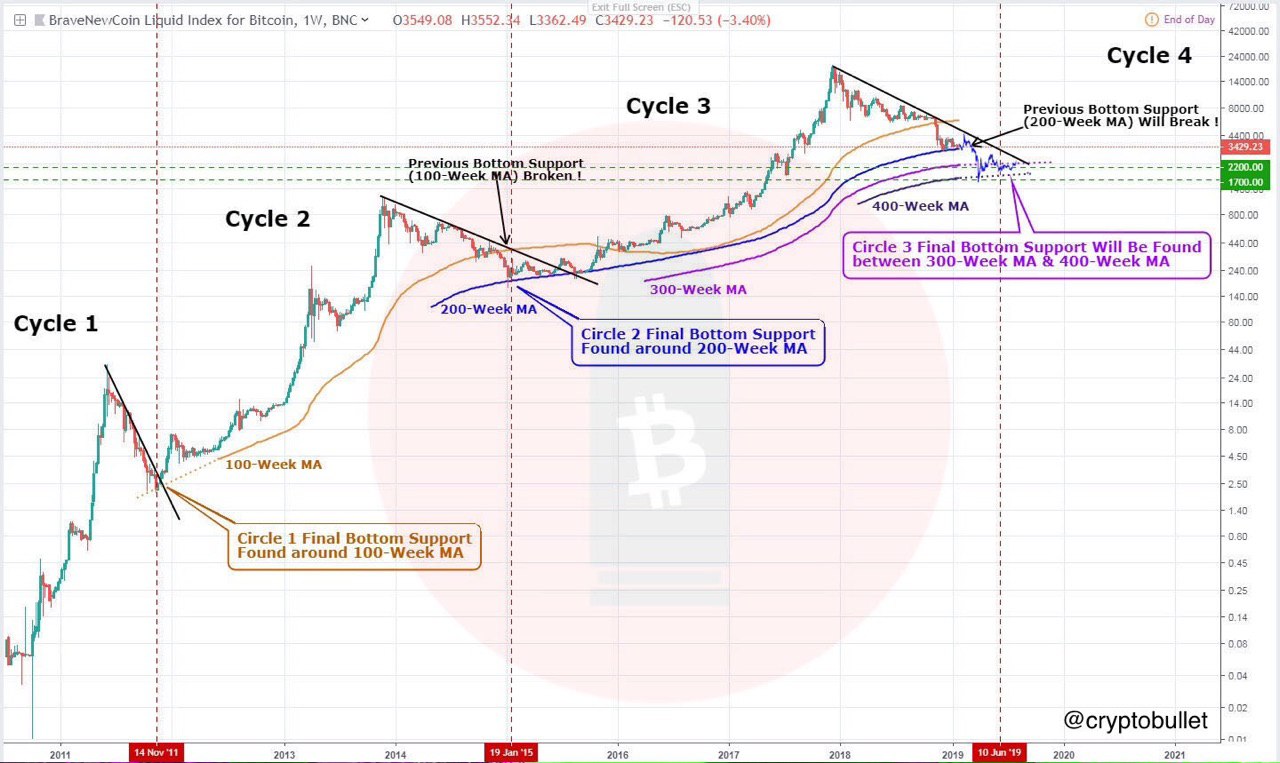
🤔 What if the history does indeed rhyme?
A clean weakly view of the scenario
If history indeed rhyme - which is a big if - we can expect a 1700-2200 bottom in the spring (most likely April, because the cycles are lengthening)
If history indeed rhyme - which is a big if - we can expect a 1700-2200 bottom in the spring (most likely April, because the cycles are lengthening)
CryptoBullet via @vote
Guys, please pass the poll. We'd like to know which content do you want us to provide you with:
anonymous poll
Trading ideas (signals) – 252
👍👍👍👍👍👍👍 58%
Market analysis and thoughts – 164
👍👍👍👍👍 37%
Breaking News – 22
👍 5%
👥 438 people voted so far.
anonymous poll
Trading ideas (signals) – 252
👍👍👍👍👍👍👍 58%
Market analysis and thoughts – 164
👍👍👍👍👍 37%
Breaking News – 22
👍 5%
👥 438 people voted so far.
💡 Trading idea: Short TRX (TRXH19) on BitMEX
Leverage: 5x
Entry point: 0.00000684
Be ready to average at a higher price if it needs
🎯Targets: 0.00000605
0.00000545
0.00000490
Leverage: 5x
Entry point: 0.00000684
Be ready to average at a higher price if it needs
🎯Targets: 0.00000605
0.00000545
0.00000490
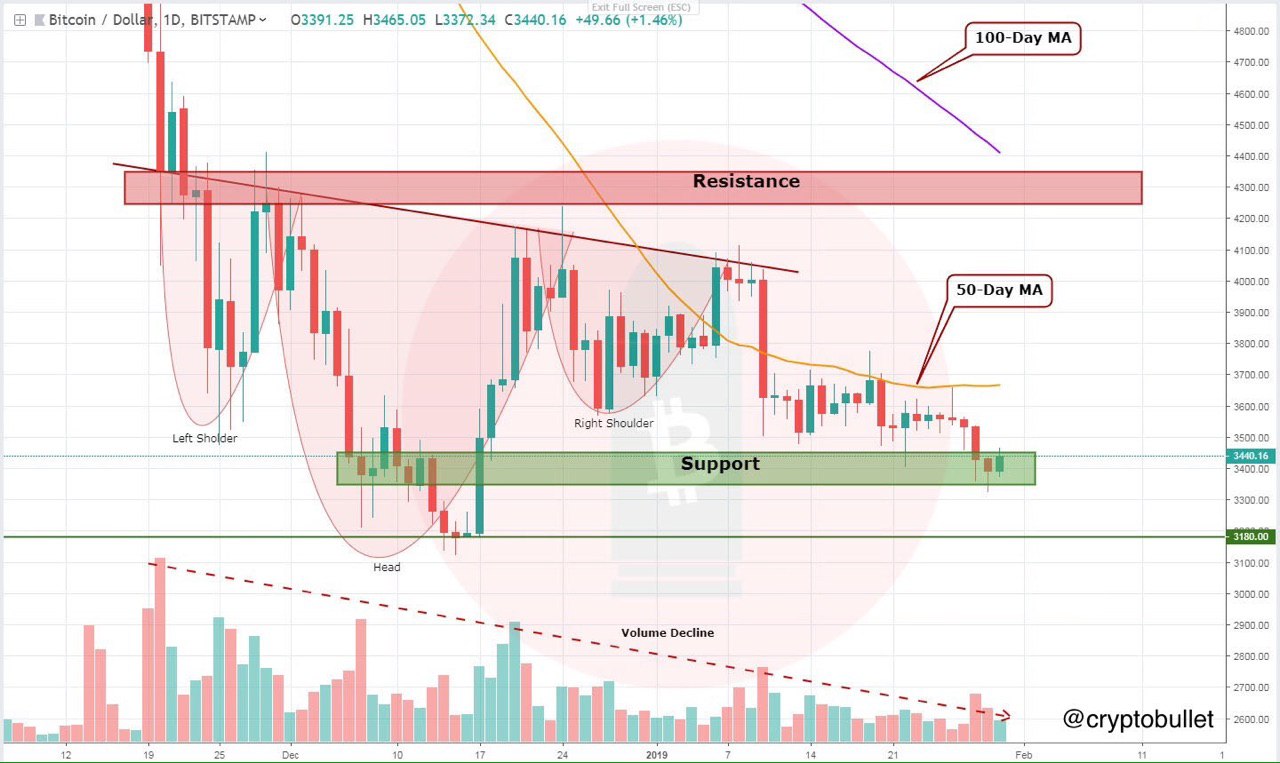
#BTC is stuck in the support zone we pointed out on Jan. 11.
Next support is previous lows followed by sub $3000.
Look how we got rejected by 50-Day MA several times over the last couple of weeks.
📌 We are still being held up by 200-Week MA (currently sitting at 3300), but the fact that 200-Week MA has to hold up the price again in a bear market is very bad. If this MA was holding up an up trend, it would be great, it would be a buying opportunity.
⚠️We stress that the month is almost over, it's about to close and what we are gonna have is the lowest monthly close of this bear market. This is not good at all and it's a very bearish sign.
📌 We say that the probability of 3140 being the final low is about 5%! But it can take time to go lower then 2018 low of $3140.
💡What we can count on is a Double Bottom scenario. How high can we bounce off of the second bottom? The resistance at 4250-4350 will be very difficult to break. There are layers of all kind of diagonal, horizontal & MA resistance.
🎓 When comparing the current Bear Market with the previous one (2014-2015), we see that many similarities are present. Bitcoin has been mimicking the past bear market like unreasonably identical.
The main question is: How will the current bear market be different than the previous one?
Collective behavior of people can be very similar, which may mean that the same general pattern will show up again.
Possible difference could be:
1) we go even lower %-wise than the last time;
2) The cycle could be dragged out much longer.
💡We are convinced that the relation to the 200-Week MA is gonna be one of the big separators of the current technical picture of the bear market vs the last one. That means we will go below it.
Here is why the 200-Week MA will break👇
CryptoBullet
💡 Trading idea: Short TRX (TRXH19) on BitMEX Leverage: 5x Entry point: 0.00000684 Be ready to average at a higher price if it needs 🎯Targets: 0.00000605 0.00000545 0.00000490
We gave call to short TRX with almost perfect entry of 684 (never went above 689)
Short call has been working out well, price reached 621, which meant +46% profit with 5x leverage. But we didn't closed and waited for more downside.
However yesterday we said to our VIP members to close TRX short (in 32% profit, which is +8% to the whole deposit, because we shorted TRX using 25% of the trading deposit)
And then BOOM! Trx goes crazy all of a sudden getting traders "rekt".
If you want to join our VIP channel - contact @Likeniss
XBTUSD Scalp Trade
Invest in this trade according to your money and risk management
Leverage: 5x
📈 Long: 3400-3410
Target: 3445
Stop loss: 3319
Invest in this trade according to your money and risk management
Leverage: 5x
📈 Long: 3400-3410
Target: 3445
Stop loss: 3319
#BTC
We have identical formations on both RSI and candlesticks
Expecting a breakout to the 50-Day MA.
Upside target: 3740 region
Should we be wrong, and we drop - 3200
We have identical formations on both RSI and candlesticks
Expecting a breakout to the 50-Day MA.
Upside target: 3740 region
Should we be wrong, and we drop - 3200
Let's take a bit closer look at #BTC
BTC is consolidating in a channel - possible bear flag for a continuation down since volume doesn't look great.
Nevertheless we can count on a bounce to the middle of the channel and then potentially to the top of it.
BTC is consolidating in a channel - possible bear flag for a continuation down since volume doesn't look great.
Nevertheless we can count on a bounce to the middle of the channel and then potentially to the top of it.
CryptoBullet
XBTUSD Scalp Trade Invest in this trade according to your money and risk management Leverage: 5x 📈 Long: 3400-3410 Target: 3445 Stop loss: 3319
Closing position in a little profit (+2%). Don't like the price action. Capital preservation is the key.