
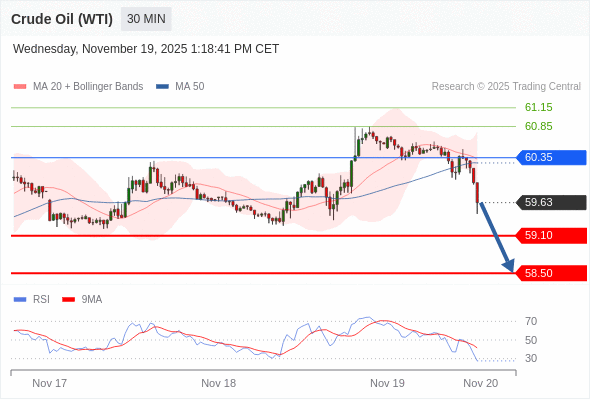
Crude Oil (WTI) (F6) Intraday: under pressure.
Pivot: 60.35
Our preference: short positions below 60.35 with targets at 59.10 & 58.50 in extension.
Alternative scenario: above 60.35 look for further upside with 60.85 & 61.15 as targets.
Comment: the RSI calls for a new downleg.
Supports and resistances:
61.15
60.85
60.35
59.63 Last
59.10
58.50
58.10
https://charts.tradingcentral.com/charts/174_20251119131201.gif
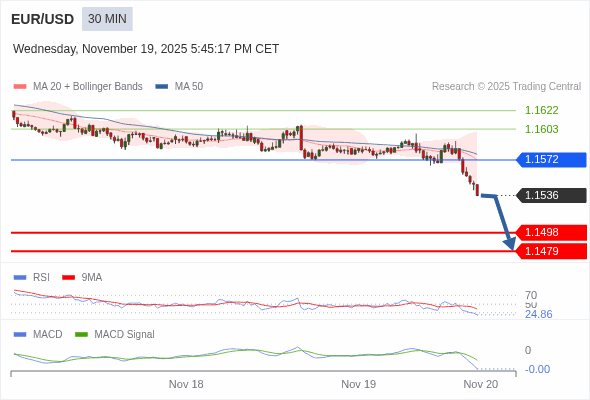
EUR/USD intraday : the RSI is oversold
Our pivot point is at 1.1572.
Our preference: the downside prevails as long as 1.1572 is resistance
Alternative scenario: above 1.1572, look for 1.1603 and 1.1622.
Comment: the RSI is below 30. It could either mean that the price is in a lasting downtrend or just oversold and therefore bound to retrace (look for bullish divergence in this case). The MACD is below its signal line and negative. The configuration is negative. Moreover, the price stands below its 20 and 50 period moving average (respectively at 1.1572 and 1.1577). Finally, the EUR/USD is trading below its lower Bollinger band (standing at 1.1542).
Supports and resistances:
1.1622 **
1.1603 *
1.1572 **
1.1559
1.1536 last
1.1498
1.1479 **
1.1461 *
1.1442 **
https://charts.tradingcentral.com/charts/74_20251119164517.gif
Nvidia (NVDA)
EPS:
Actual: $1.30
Forecast: $1.25
Revenue:
Actual: $57.00 B
Forecast: $54.89 B
EPS:
Actual: $1.30
Forecast: $1.25
Revenue:
Actual: $57.00 B
Forecast: $54.89 B
5 Things to Know November 20, 2025
📈 Asian markets rallied today, boosted by a rebound in tech stocks as optimism returned following strong earnings from Nvidia. Japan’s Nikkei and South Korea’s KOSPI led the gains, while Hong Kong lagged amid local tech weakness.
📱 Block’s Australian-listed shares surged nearing 9% after the payments company raised its multi-year earnings outlook. The bullish forecast came with a sizeable share-buyback plan and highlights investor confidence in its global growth trajectory.
🤖 Google’s DeepMind opened a new AI research centre in Taiwan, marking a strategic expansion in Asia’s high-tech landscape. The move underscores the intensifying global race in generative AI infrastructure beyond the U.S. and China.
🛢 Oil prices rebounded as uncertainty over the expiration of U.S. sanctions waivers on Russian crude exports reignited supply risk concerns. Traders remain cautious as both demand signals and geopolitical factors keep the market finely balanced.
🪙 Gold prices edged lower today as safe haven demand eased, with traders factoring in a firmer U.S. dollar and growing confidence about trade and policy developments. While still elevated, the yellow metal’s momentum appears to be pausing.
📊 Click here to access the daily technical report, featuring technical analysis of approximately 20 financial instruments, including currencies, major stock indices, commodities, and metals!
Walmart’s Q3 2026 earnings could reveal far more than just profits — from inflation pressures to booming e-commerce growth. Here’s what you really need to know before the results drop. Click Here to Read more.
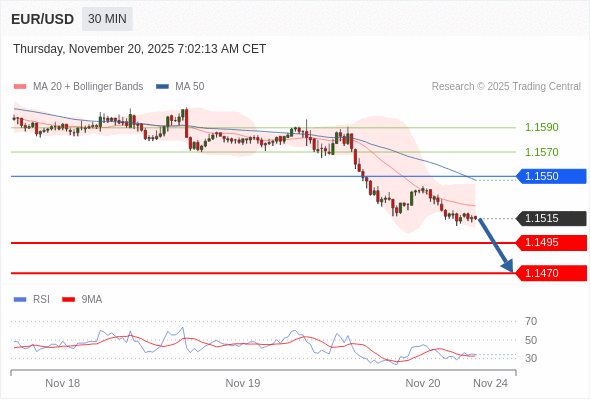
EUR/USD Intraday: under pressure.
Pivot: 1.1550
Our preference: short positions below 1.1550 with targets at 1.1495 & 1.1470 in extension.
Alternative scenario: above 1.1550 look for further upside with 1.1570 & 1.1590 as targets.
Comment: the RSI calls for a new downleg.
Supports and resistances:
1.1590
1.1570
1.1550
1.1515 Last
1.1495
1.1470
1.1450
https://charts.tradingcentral.com/charts/74_20251120070214.gif
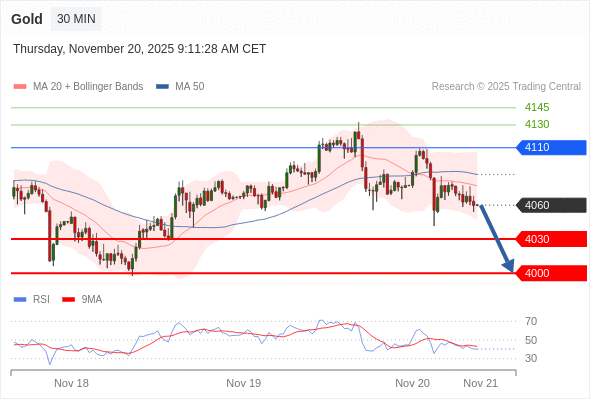
Gold Intraday: watch 4000.
Pivot: 4110
Our preference: short positions below 4110 with targets at 4030 & 4000 in extension.
Alternative scenario: above 4110 look for further upside with 4130 & 4145 as targets.
Comment: technically the RSI is below its neutrality area at 50.
Supports and resistances:
4145
4130
4110
4060 Last
4030
4000
3970
https://charts.tradingcentral.com/charts/169_20251120091050.gif
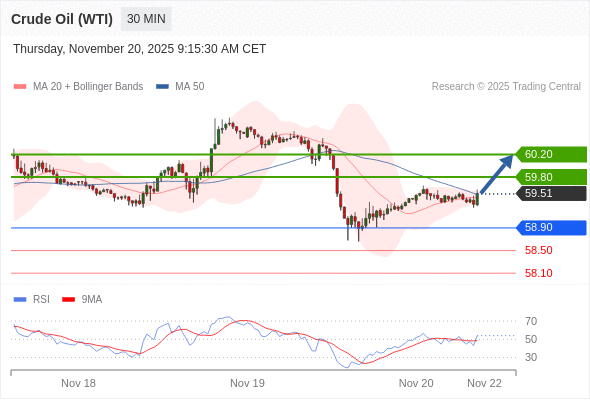
Crude Oil (WTI) (F6) Intraday: bullish bias above 58.90.
Pivot: 58.90
Our preference: long positions above 58.90 with targets at 59.80 & 60.20 in extension.
Alternative scenario: below 58.90 look for further downside with 58.50 & 58.10 as targets.
Comment: the RSI calls for a rebound.
Supports and resistances:
60.55
60.20
59.80
59.51 Last
58.90
58.50
58.10
https://charts.tradingcentral.com/charts/174_20251120091534.gif
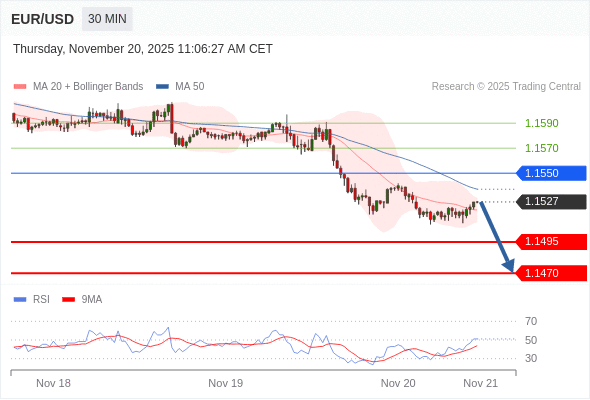
EUR/USD Intraday: the downside prevails.
Pivot: 1.1550
Our preference: short positions below 1.1550 with targets at 1.1495 & 1.1470 in extension.
Alternative scenario: above 1.1550 look for further upside with 1.1570 & 1.1590 as targets.
Comment: even though a continuation of the technical rebound cannot be ruled out, its extent should be limited.
Supports and resistances:
1.1590
1.1570
1.1550
1.1527 Last
1.1495
1.1470
1.1450
https://charts.tradingcentral.com/charts/74_20251120110450.gif
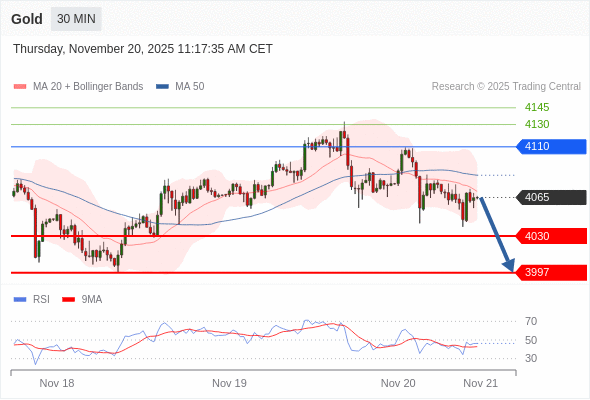
Gold Intraday: consolidation.
Pivot: 4110
Our preference: short positions below 4110 with targets at 4030 & 3997 in extension.
Alternative scenario: above 4110 look for further upside with 4130 & 4145 as targets.
Comment: as long as 4110 is resistance, look for choppy price action with a bearish bias.
Supports and resistances:
4145
4130
4110
4065 Last
4030
3997
3970
https://charts.tradingcentral.com/charts/169_20251120111433.gif
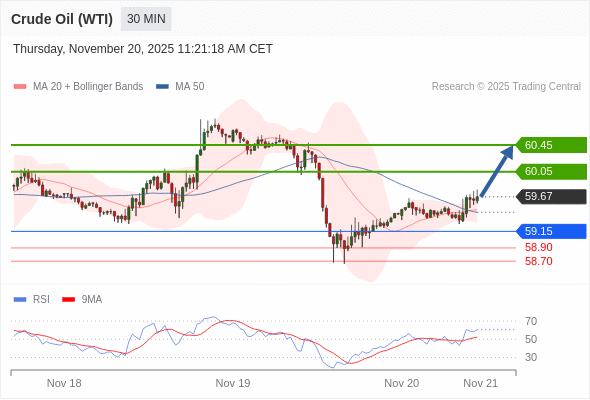
Crude Oil (WTI) (F6) Intraday: up turn.
Pivot: 59.15
Our preference: long positions above 59.15 with targets at 60.05 & 60.45 in extension.
Alternative scenario: below 59.15 look for further downside with 58.90 & 58.70 as targets.
Comment: the RSI is bullish and calls for further upside.
Supports and resistances:
60.85
60.45
60.05
59.67 Last
59.15
58.90
58.70
https://charts.tradingcentral.com/charts/174_20251120111432.gif
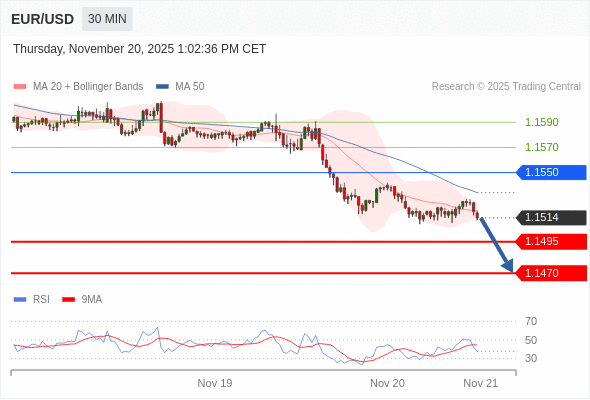
EUR/USD Intraday: turning down.
Pivot: 1.1550
Our preference: short positions below 1.1550 with targets at 1.1495 & 1.1470 in extension.
Alternative scenario: above 1.1550 look for further upside with 1.1570 & 1.1590 as targets.
Comment: the RSI is bearish and calls for further downside.
Supports and resistances:
1.1590
1.1570
1.1550
1.1514 Last
1.1495
1.1470
1.1450
https://charts.tradingcentral.com/charts/74_20251120130159.gif
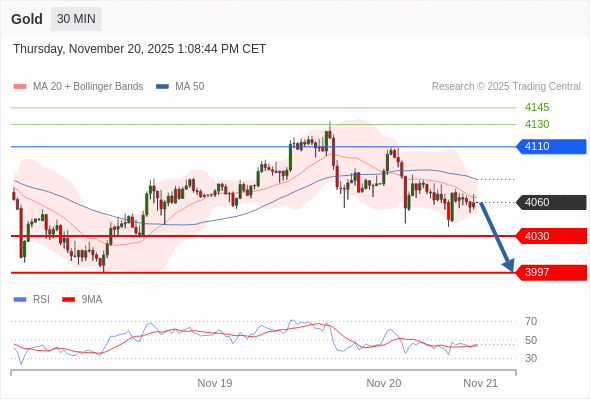
Gold Intraday: consolidation in place.
Pivot: 4110
Our preference: short positions below 4110 with targets at 4030 & 3997 in extension.
Alternative scenario: above 4110 look for further upside with 4130 & 4145 as targets.
Comment: the RSI lacks upward momentum.
Supports and resistances:
4145
4130
4110
4060 Last
4030
3997
3970
https://charts.tradingcentral.com/charts/169_20251120130732.gif
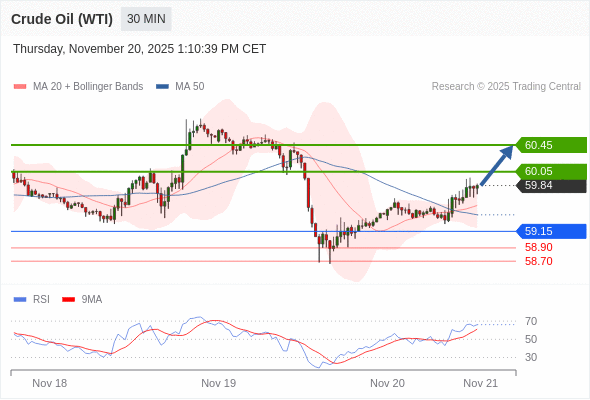
Crude Oil (WTI) (F6) Intraday: further advance.
Pivot: 59.15
Our preference: long positions above 59.15 with targets at 60.05 & 60.45 in extension.
Alternative scenario: below 59.15 look for further downside with 58.90 & 58.70 as targets.
Comment: the RSI advocates for further advance.
Supports and resistances:
60.85
60.45
60.05
59.84 Last
59.15
58.90
58.70
https://charts.tradingcentral.com/charts/174_20251120130730.gif
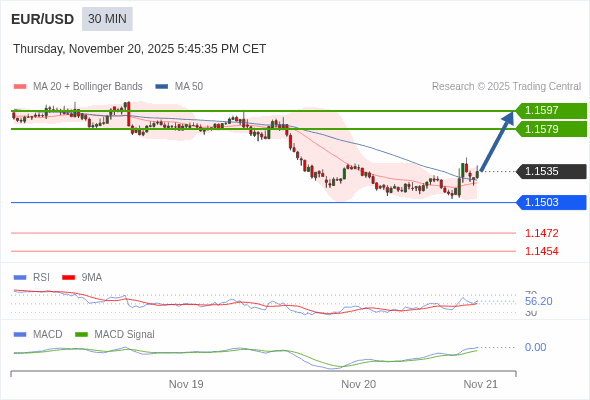
EUR/USD intraday : the upside prevails as long as 1.1503 is support
Our pivot point is at 1.1503.
Our preference: the upside prevails as long as 1.1503 is support
Alternative scenario: below 1.1503, expect 1.1472 and 1.1454.
Comment: the RSI is above its neutrality area at 50. The MACD is above its signal line and positive. The configuration is positive. Moreover, the price is above its 20 and 50 period moving average (respectively at 1.1524 and 1.1527).
Supports and resistances:
1.1634 **
1.1616 *
1.1597 **
1.1579
1.1535 last
1.1516
1.1503 **
1.1472 *
1.1454 **
https://charts.tradingcentral.com/charts/74_20251120164535.gif