
ALLMYPIPS®
ECB Interest Rate Announcement Country: 🇪🇺 Previous: 0.00% Actual: 0.00% The European Central Bank's decision to increase, decrease, or maintain interest rates. Controlling interest rates is the key mechanism of monetary policy, and the ECB influences interest…
🛑EURUSD rejected to break 1.1380 If Price closed below 1.1260 then Bearish Trend for next week.
🛑Currently All market Overbought Next week expecting Huge drop LIKE March 2020 ( One week Pump and week DUMP)
🛑Currently #AUDUSD #NZDUSD #EURUSD #GBPUSD Price RSI Above 85% and Resistance Level 1-2 Broken And HIT 3rd Resistance, Seller back on third Resistance.
🛑Market Not technically or Fundamentally Moving , 1st week of June Look like Big fisher greedy and Against Market trader to hit SL LOSES GAME,Because March Month Market trades Make lot of profit due to sideways market, So They cleaned up All March Gain Profit.
❌Wait for Market stable for new analysis.( WEEKLY BASE CANDLE IMPORTANT)
#EURUSD WEEKLY BASE LOOKING 1.1280 and if break 1.1285 open downside 1.1170 and 1.1090.
EURUSD WEEKLY BASE ANALYSIS.webm
66.1 MB
#EURUSD Video Analysis ( 300-400 pips Target)
Technical Market Outlook:
#EURUSD
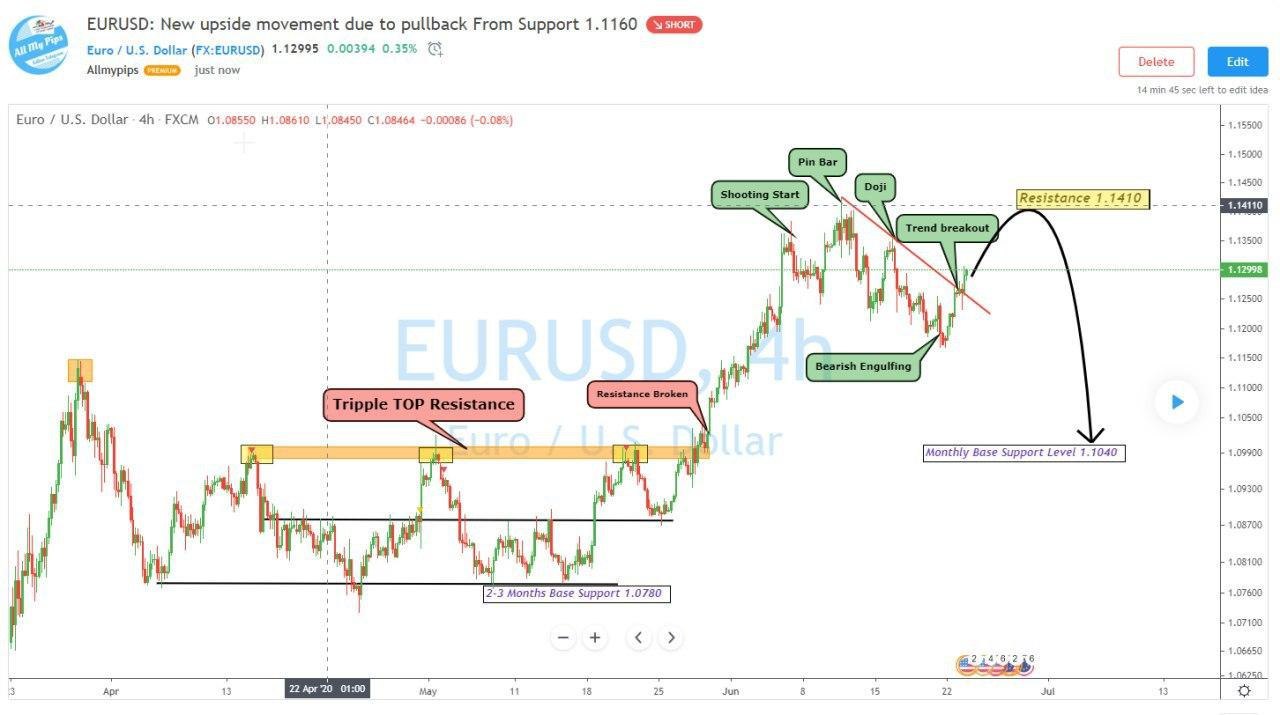
The EUR/USD pair has tested the March High 1.14230 as expected our previous analysis we did mention 1.1425 Resistance
Previous Analysis:
The EUR/USD pair has tested lower level of the support range located at 1.1165 and bounced towards the short-term trend line resistance located around the level of 1.1265. Pair Remain in sideways to bulls side we expecting to test the nearest technical resistance 1.1325 if price break above 1.1325 we could see another Resistance upside 1.1425.
Any violation of the level of 1.1148 will accelerate the sell-off towards the next technical Monthly support seen at 1.1040. So, it is important for bulls to defend this level.
Since start June many bearish candle signal showing on the monthly base chart.
1- 5th June ( Shooting Star )
2- 10th June ( Pin Bar )
3- 16th June ( Doji Candle)
4- 19th June ( Bearish Engulfing )
5- 22nd June ( Short Term Trend Break line)
🛑SUPPORT/RESISTANCE
✅S1= 1.1165
✅S2=1.1040
✴️R1=1.1325
✴️R2=1.1430
Long term Outlook EURUSD:
On the EUR/USD pair, the main long-term trend is down, but the local uptrend continues. The key long-term technical support is seen at the level of 1.0780 and the key long-term technical resistance is seen at the level of 1.1540. Only if one of these levels is clearly violated, the main trend might reverse (1.1540) or accelerate (1.0786) And more sell off 1.0450
Please like, share, comments and follow me to get daily base analysis.
Thank you for your support, I appreciate it.
#EURUSD
Entry on daily base below candle
SL above 1.1830/40
Target 1-2-3
Trend Showing Daily base Strong downside all day.
Entry on daily base below candle
SL above 1.1830/40
Target 1-2-3
Trend Showing Daily base Strong downside all day.
H=S=H CHART #Eurusd Daily base.
One more time correction expected upside towards resistance 1.1910 to 1.1930$
Thursday ECB has plan to big correction EURUSD downside drop.
🛑SUPPORT/RESISTANCE
✅S1= 1.1835
✅S2=1.1780
✴️R1=1.1930
✴️R2=1.2000
One more time correction expected upside towards resistance 1.1910 to 1.1930$
Thursday ECB has plan to big correction EURUSD downside drop.
🛑SUPPORT/RESISTANCE
✅S1= 1.1835
✅S2=1.1780
✴️R1=1.1930
✴️R2=1.2000
#EURUSD 1.1750$ and 17.10$ break then 1.1660 and 1.1590 next but keep in mind $ any time under pressure
#EURUSD small pull back expecting towards 1.1760$ Resistance, If break 1.1640$ then open downside 1.1565$
Technical Market Outlook:
#EURUSD: if NFP strong then EURUSD looking 1.1560$ support
After the EUR/USD pair has bounced from the low at the level of 1.1685, it started to test the short-term trend line resistance again, but failed to continue to bounce any higher. The level of 1.1772 had not been violated clearly and the market reversed towards the technical support located at 1.1696. Nevertheless, the next target for bulls is seen at the level of 1.1772 and 1.1790. The next target for bears is seen at the level of 1.1655. Only a sustained breakout above the level of 1.1758 would put bulls back into control again. The weekly time frame trend remains up.
Weekly Pivot Points:
WR3 - 1.2011
WR2 - 1.1939
WR1 - 1.1752
Weekly Pivot - 1.1683
WS1 - 1.1498
WS2 - 1.1408
WS3 - 1,1239
ALLMYPIPS®
FAKE CANDLE AND SL LOST HITTING WEEK OF 1ST WEEK ON MONTH. I am holding my ALL EURUSD trades weekly base strong correction coming Good luck
#EURUSD currently Confirmed Breakout 1.2090 level.
Next level 1.2145 if break then new higher high looking 1.2460 to 1.2500.
Alternative $index Also break out 91.10$ and looking next 89.60$
I keep Holding My Trades Until Weekly candle closed down or NFP DATA. Weekly Base Chart showing bearish Pin Bar Candle.
🛑Indictors showing overbought condition.
RSI ABOVE 73%
GOOD LUCK #DYOR
#EURUSD HOLDING from July 2020 to 2021 1.1700$ if break 1.1690 then could fall below 1.1520$ level but long term long towards 1.2500 again. ( depend FED $)