
Forwarded from Captain Keshel and Co. American Election Integrity HQ
KENTUCKY
Trump – 1,326,646 (62.1%)
Biden – 772,474 (36.2%)
Red – High/Rampant Fraud
Yellow – Likely Fraud
Green – Low/No Fraud
Kentucky is riddled with problems, showing 22 counties with issues, totaling roughly 62k excess Biden votes. Jefferson County (Louisville) is tied for the most with 10k (lenient estimate), but classifies as yellow due to population size. Fayette (Lexington) is coded red, estimated at about 8k excess for Biden.
Refer to the spreadsheet chart to see the network throughout the north and central Kentucky of yellow-class counties diverting from a very strong GOP trend and Democrat die-off.
Kenton County is easily the most lucrative target in the state, strong GOP trend in the county, with about 10k excess Biden votes.
If Biden is 62k heavy, an accurate margin for Trump is 64.0%, or 64.0% to 34.2%, or 617k votes.
Best Trump county audit targets – Boone, Kenton, Warren
Forwarded from Dr Naomi Wolf
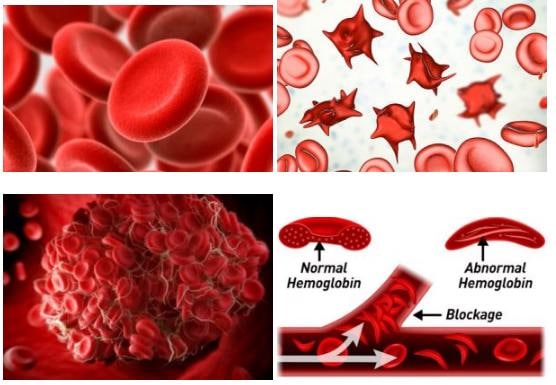
MEDICAL BOMBSHELL: Blood doctor releases findings showing Moderna’s mRNA Covid vaccines change red blood cells from round to tubular, causing them to stick together
Part 1/2.
Yes, it’s time to become your own “medical investigator,” because these vaccine manufacturers and regulatory agencies do not have our best interest in mind. Would you like to know exactly what the mRNA vaccines do to your blood that’s far more dangerous than the Covid-19 virus or any of its variants?
You don’t have to be a mechanic to learn and understand how dirty oil can ruin a motor, and you don’t have to be a doctor or scientist to understand how mRNA Covid vaccines are changing red blood cells to make them stick together. This explains the blood clot phenomena happing around the world after Covid inoculation. This explains the inflamed heart epidemic happening around the globe after Covid vaccination. This explains the explosion of cases of neuromuscular degenerative conditions.
Why are thousands and thousands of Covid-vaccinated people complaining of relentless lethargy, dizziness and clouded thinking?
Myocarditis is the condition of an inflamed heart, that’s being overworked for various reasons. One main reason for myocarditis, strokes and heart attacks is clogged blood vessels, including arteries, veins and capillaries. each of which plays specific roles in the process of circulating oxygen and nutrients. Even some of the healthiest people on planet earth, our military members, are suffering myocarditis after Covid vaccination, and this is proven by science in clinical trials.
Under a regular microscope, the examination of blood samples (blood smear) from a specific doctor’s patients who received the Moderna Covid jab(s) reveal blood cells that are destroyed, mutated-tubular-looking and clumping together (aggregated). These patients and their doctor want to know exactly what is being pushed into their bloodstream, and what is now circulating throughout their body?
The misinformation is coming from Pfizer and Moderna about mRNA and its true function. That’s where all the misinformation stems from, not alternative news, as MSM would have everyone believe.
These pictures of blood smears from Covid-vaccinated patients appear as though the patient has been suffering from Guillain-Barre syndrome or MS, but they haven’t been. How are the vaccines causing this effect? The Moderna mRNA Covid vaccine mutates the shape and stickiness of the red blood cells, causing them to clot. The first diagram below shows healthy blood cells and then post Covid vaccination, you’ve got mutated, deformed red blood cells, spiked proteins, and the stickiness factor causing deadly blockages. It’s like a hundred-car pileup of wrecks on the highways and roadways where your blood travels, 24/7/365.
Check out the picture below.
Read Part 2/2 below.
Subscribe and share ➡️➡️ @naomirwolf
Forwarded from Captain Keshel and Co. American Election Integrity HQ
ARKANSAS
Trump – 760,647 (62.4%)
Biden – 423,932 (34.8%)
Yellow – Possible/Likely Fraud
Green – Low/No Fraud
Arkansas nearly joined Iowa with perfect green counties. I have tagged Benton (5k) and Washington (3k) as the only viable audit targets in Arkansas. Both have tremendous growth, but also did in 2000-10 timeframe without the sharp increases in votes. Dems are up 50% in Benton, which a vote gain should be expected, but 5k is the previous high, and now we have a gain of 14k – in the face of a massive record GOP vote gain. It is certainly not rampant, and I’m still affording Biden a double previous vote gain in this county.
Washington, same dynamics, just a smaller county. Pulaski (Little Rock) trended clean. This doesn’t mean it is clean, but the trends don’t provide a mandate for an audit.
Overall, as seen in Iowa, a modest 10% Biden vote gain, mainly returning third party throwaways and accounting for higher turnout. Arkansas looks good.
Best Trump county audit targets – Benton, Washington
Forwarded from Captain Keshel and Co. American Election Integrity HQ
TENNESSEE
Trump – 1,852,475 (60.7%)
Biden – 1,143,711 (37.5%)
Red – High/Rampant Fraud
Yellow – Possible/Likely Fraud
Green – Low/No Fraud
Very troubling map of TN. Trump up 330k, a GOP record even above the low turnout 00 election to 04. Obama +51k from Kerry, down 127k, Clinton down 90k, even with MASSIVE GROWTH in TN. Now Biden is up 273k, with at least 101k excess. State was a wipeout, even giving Biden a modern record vote gain for Dem.
Shelby (Memphis) isn’t too far from trend. Davidson should have huge Dem growth and does, flagging it for 15k, lenient. Previous high gain for D is 16k; Clinton up 5k, and that came with 13k GOP loss in 2016. Trump is up 16k, with Biden up 51k – though I’d expect a large surge there.
The most significant areas are in proximity to Davidson, with Knox being another spot with some spread. Hamilton is obvious, at least 10k heavy;
Best Trump county audit targets – Hamilton, Knox, Rutherford
If Biden is 101k heavy, Trump margin would be 62.7% to 35.3%, or 809k.
Forwarded from Captain Keshel and Co. American Election Integrity HQ
UTAH
Trump – 865k (58.13%)
Biden – 560k (37.65%)
UT is one of hardest to gage, thanks to poor record keeping (UT registers by party, but not available across counties), the presence of a serious 3rd party challenge in 2016, and Romney’s home state skew. Most accurate comps go back to 2008.
I think UT was a target by central planners – JB has 45k more than Trump ’16; perhaps they anticipated the same 3rd party behavior. DT is 125k past Romney ’12, but Biden’s gains are 250k from Clinton, when previous high gain was Obama ’08 with 87k. Nearly all third party throwaways came from GOP in 2016.
Red – Obviously Ugly (5)
Yellow – Suspect/Likely Fraud (8)
Green – Clean (16)
Estimates for excess votes based on pop. growth/trends:
Salt Lake – 50k
Utah – 30k
Davis – 20k
Weber – 9k
Washington – 7k
I estimate 131k excess votes. If accurate, and counting ONLY excess JB vote growth, DT should have won this state about 63.7% to 31.6%, or by 32.1%. JB gain in SLC was 114k, previous high was 31k (Obama ’08).
This media is not supported in your browser
VIEW IN TELEGRAM
In the Italian Parliament - people hold the sign “no green pass” against the country’s “Green Pass” vaccine passport! They are fighting for you until you wake up! Wake up! Say No to vaccines passport in any format!!!