EXPLODING COMET DEBRIS: Have you ever seen a piece of a comet explode? Francis Murphy did on Monday night in Thorndale, Pennsylvania:
https://spaceweathergallery.com/submissions/pics/f/Francis-Murphy-May_31st_2022_Meteor_Chart_1654037263.gif
The tau Herculid meteor shower was underway as debris from Comet 73P/Schwassmann-Wachmann 3 peppered the top of Earth's atmosphere. This piece of the broken comet disintegrated 90 km above above the ground, spreading its remains across the edge of space.
"The meteor's trail twisted and turned in high altitude winds," says Murphy. "It was the brightest of 10 to 15 tau Herculids we saw during a 3-hour observing session."
In Mormon Lake, Arizona, astronomer David Blanchard saw the same thing--twice. This video shows two tau Herculids disintegrating in a star field with satellites and airplanes whizzing by.
👍1
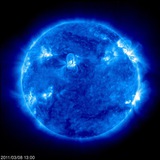
FARSIDE SUNSPOTS: Right now, there are sunspots on the farside of the sun so big they are affecting the way the sun vibrates.
Helioseismologists have detected their echoes in the latest farside map from NASA's Solar Dynamics Observatory. Don't be surprised if we see CMEs billowing away from the farside of the sun in the days ahead.
Helioseismologists have detected their echoes in the latest farside map from NASA's Solar Dynamics Observatory. Don't be surprised if we see CMEs billowing away from the farside of the sun in the days ahead.
👍2
POSSIBLE WEAK CME IMPACT PREDICTED: Yesterday, a magnetic filament on the sun erupted (movie), hurling a faint CME into space. NOAA forecasters say it could hit Earth's magnetic field on June 5th or 6th. Even weak CME strikes can cause geomagnetic storms, so there is a chance of minor G1-class storms when the CME arrives.
https://www.spaceweather.com/images2022/01jun22/erupting_filament.gif
https://www.spaceweather.com/images2022/01jun22/erupting_filament.gif
👍4
🚨CME NEAR-MISS POSSIBLE ON JUNE 5TH: A minor coronal mass ejection (CME) that left the sun on June 1st will pass close to Earth on June 5th, according to NOAA analysts. It might come close enough for a glancing blow. High latitude sky watchers should be alert for auroras when the CME arrives this weekend.
👍3
SOLAR CYCLE 25 UPDATE: Once again, Solar Cycle 25 is exceeding predictions. Sunspot numbers in May 2022 more than doubled NOAA's forecast, setting the stage for a relatively strong Solar Maximum in early 2025.
Image credit: Helio4cast, a group of scientists based in Austria working on basic and applied space weather research.
The plot, above, compares actual sunspot numbers to a selection of benchmarks. The blue curve is the "official forecast" issued by NOAA's Solar Cycle Prediction Panel in 2019. Sunspot counts are tracing a curve significantly higher than that.
The green curve is the average of all solar cycles since 1750, and the red curve is a new prediction based on the Termination Event. Current sunspot counts match both. Even if Solar Cycle 25 turns out to be merely average, it will still far exceed previously low expectations.
Source: https://www.spaceweather.com/