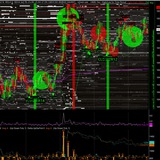
🚨 PRIVATE NEXUS UPDATE: THE LLM IS NOW INSIDE MT5
Guys, this is one of the most advanced integrations I have built for the NEXUS ecosystem.
The 2.5D NEXUS DOM Heatmap for MT5 now includes a fully integrated Neural Copilot connected directly to the live futures orderflow telemetry.
You can type questions directly inside the MT5 chart and receive a structured analysis of the current market microstructure.
📡 The LLM can receive live information about:
▪️ Best bid, best ask and spread
▪️ Full Level 2 order-book balance
▪️ Bid and ask depth concentration
▪️ Aggressive buy and sell flow
▪️ Tick-by-tick Time & Sales
▪️ Pulling and stacking
▪️ Absorption and replenishment
▪️ Liquidity vacuums
▪️ Market-state confidence
▪️ Bull and bear trap risk
▪️ Reversal and breakout context
▪️ Feed quality and telemetry health
⚙️ Technical Architecture
The system uses a dedicated companion EA so that LLM network requests remain outside the indicator and rendering thread.
Current inference layer:
⚡️ Groq integration
⚡️ Cerebras integration
⚡️ Automatic fallback between providers
⚡️ Contextual chat memory
⚡️ Live NEXUS telemetry injection
⚡️ Structured uncertainty and invalidation logic
This means the 2.5D heatmap can continue capturing and rendering live DOM events while the AI processes the orderflow context independently.
🧠 What This Changes
Until now, traders had to interpret every liquidity wall, vacuum, absorption cluster and order-book shift manually.
Now, the market can be interrogated directly:
The LLM does not replace the trader.
It becomes a second analytical layer inside the workstation.
Live futures data enters MT5.
NEXUS reconstructs the liquidity landscape.
The Neural Copilot explains the structure.
This is no longer a conventional indicator.
It is becoming an interactive market-intelligence terminal. 🧬📊
🔗 Full NEXUS ecosystem:
https://metaquantuniverse.com/nexus
Guys, this is one of the most advanced integrations I have built for the NEXUS ecosystem.
The 2.5D NEXUS DOM Heatmap for MT5 now includes a fully integrated Neural Copilot connected directly to the live futures orderflow telemetry.
You can type questions directly inside the MT5 chart and receive a structured analysis of the current market microstructure.
📡 The LLM can receive live information about:
▪️ Best bid, best ask and spread
▪️ Full Level 2 order-book balance
▪️ Bid and ask depth concentration
▪️ Aggressive buy and sell flow
▪️ Tick-by-tick Time & Sales
▪️ Pulling and stacking
▪️ Absorption and replenishment
▪️ Liquidity vacuums
▪️ Market-state confidence
▪️ Bull and bear trap risk
▪️ Reversal and breakout context
▪️ Feed quality and telemetry health
⚙️ Technical Architecture
The system uses a dedicated companion EA so that LLM network requests remain outside the indicator and rendering thread.
Current inference layer:
⚡️ Groq integration
⚡️ Cerebras integration
⚡️ Automatic fallback between providers
⚡️ Contextual chat memory
⚡️ Live NEXUS telemetry injection
⚡️ Structured uncertainty and invalidation logic
This means the 2.5D heatmap can continue capturing and rendering live DOM events while the AI processes the orderflow context independently.
🧠 What This Changes
Until now, traders had to interpret every liquidity wall, vacuum, absorption cluster and order-book shift manually.
Now, the market can be interrogated directly:
“Is the current buying pressure genuine?”
“Where is the nearest liquidity vacuum?”
“Is this breakout being absorbed?”
“What invalidates the current market-state hypothesis?”
The LLM does not replace the trader.
It becomes a second analytical layer inside the workstation.
Live futures data enters MT5.
NEXUS reconstructs the liquidity landscape.
The Neural Copilot explains the structure.
This is no longer a conventional indicator.
It is becoming an interactive market-intelligence terminal. 🧬📊
🔗 Full NEXUS ecosystem:
https://metaquantuniverse.com/nexus
Metaquantuniverse
3D NEXUS META V8.5 — Predictive Order Flow Combat Cockpit
A browser-native 3D orderbook, prediction and execution cockpit for advanced traders.
❤1🔥1
HFT ATTACK: THE MARKET IS NOT MOVING. IT IS BEING ENGINEERED.
100% CONTROLLED.
Not by a single trader.
Not by a secret button.
By speed.
By liquidity.
By market-making algorithms operating inside the order book.
Layering.
Pulling.
Stacking.
Repricing.
Absorbing.
Reloading.
The visible price is only the surface.
The real battle takes place inside the book.
Retail sees a breakout.
The HFT engine sees concentrated stop liquidity.
Retail sees resistance.
The market maker sees a cluster of conditional orders waiting to become market buys.
Retail sees support.
The algorithm sees sell-side liquidity waiting to be harvested.
Price does not always move because supply suddenly defeated demand.
Sometimes price moves because liquidity has been detected.
Targeted.
Provoked.
And extracted.
THE ORDER BOOK IS A CONTROL SYSTEM
Large bids appear.
Confidence rises.
Buyers enter.
Then the bids disappear.
Price collapses into the space they were supposedly protecting.
Large offers appear.
Sellers panic.
Short positions accumulate.
Then the offers are pulled.
Price launches upward through their stops.
The displayed liquidity was never a promise.
It was information.
A signal.
A pressure mechanism.
A way to influence positioning without necessarily executing the full displayed size.
The book creates the narrative.
The tape reveals the attack.
HFT DOES NOT NEED TO PREDICT THE MARKET
It can stimulate it.
A burst of aggressive selling hits the bid.
The bid absorbs.
More sellers enter.
Liquidity providers step back.
The spread expands.
Price drops through a visible level.
Stops activate.
Momentum systems join the move.
Then the original selling pressure disappears.
The book rebuilds underneath.
Price reverses.
The late sellers become forced buyers.
Their stop-losses provide the fuel for the recovery.
This is not simply direction.
It is a liquidity cycle.
Pressure. Reaction. Trigger. Extraction. Reversal.
Repeated thousands of times across instruments and timeframes.
MARKET MAKING IS NOT PASSIVE
The market maker is not sitting quietly between the bid and the ask.
Modern market making is adaptive.
It measures:
Order-flow imbalance
Queue position
Cancellation velocity
Aggressive trade intensity
Stop concentration
Short-term toxicity
Latency differences
Liquidity gaps
Hidden absorption
Cross-market reactions
It constantly decides where liquidity should appear.
Where it should disappear.
When the spread should tighten.
When it should widen.
When aggressive traders should be encouraged.
And when they should be trapped.
The objective is not to make the chart look logical.
The objective is to manage risk, capture spread, control inventory, and interact with liquidity before slower participants can react.
THE ATTACK HAPPENS BEFORE THE CANDLE
A candle shows the result.
The order book shows the preparation.
Liquidity is pulled from one side.
Depth is stacked on the other.
Market orders accelerate.
Passive orders absorb the attack.
The tape becomes one-sided.
Price appears ready to explode.
Then the imbalance vanishes.
The dominant side is trapped.
The reversal begins.
By the time the candle confirms the move, the operation may already be complete.
The candle is the footprint.
The machinery moved first.
100% CONTROLLED.
Not by a single trader.
Not by a secret button.
By speed.
By liquidity.
By market-making algorithms operating inside the order book.
Layering.
Pulling.
Stacking.
Repricing.
Absorbing.
Reloading.
The visible price is only the surface.
The real battle takes place inside the book.
Retail sees a breakout.
The HFT engine sees concentrated stop liquidity.
Retail sees resistance.
The market maker sees a cluster of conditional orders waiting to become market buys.
Retail sees support.
The algorithm sees sell-side liquidity waiting to be harvested.
Price does not always move because supply suddenly defeated demand.
Sometimes price moves because liquidity has been detected.
Targeted.
Provoked.
And extracted.
THE ORDER BOOK IS A CONTROL SYSTEM
Large bids appear.
Confidence rises.
Buyers enter.
Then the bids disappear.
Price collapses into the space they were supposedly protecting.
Large offers appear.
Sellers panic.
Short positions accumulate.
Then the offers are pulled.
Price launches upward through their stops.
The displayed liquidity was never a promise.
It was information.
A signal.
A pressure mechanism.
A way to influence positioning without necessarily executing the full displayed size.
The book creates the narrative.
The tape reveals the attack.
HFT DOES NOT NEED TO PREDICT THE MARKET
It can stimulate it.
A burst of aggressive selling hits the bid.
The bid absorbs.
More sellers enter.
Liquidity providers step back.
The spread expands.
Price drops through a visible level.
Stops activate.
Momentum systems join the move.
Then the original selling pressure disappears.
The book rebuilds underneath.
Price reverses.
The late sellers become forced buyers.
Their stop-losses provide the fuel for the recovery.
This is not simply direction.
It is a liquidity cycle.
Pressure. Reaction. Trigger. Extraction. Reversal.
Repeated thousands of times across instruments and timeframes.
MARKET MAKING IS NOT PASSIVE
The market maker is not sitting quietly between the bid and the ask.
Modern market making is adaptive.
It measures:
Order-flow imbalance
Queue position
Cancellation velocity
Aggressive trade intensity
Stop concentration
Short-term toxicity
Latency differences
Liquidity gaps
Hidden absorption
Cross-market reactions
It constantly decides where liquidity should appear.
Where it should disappear.
When the spread should tighten.
When it should widen.
When aggressive traders should be encouraged.
And when they should be trapped.
The objective is not to make the chart look logical.
The objective is to manage risk, capture spread, control inventory, and interact with liquidity before slower participants can react.
THE ATTACK HAPPENS BEFORE THE CANDLE
A candle shows the result.
The order book shows the preparation.
Liquidity is pulled from one side.
Depth is stacked on the other.
Market orders accelerate.
Passive orders absorb the attack.
The tape becomes one-sided.
Price appears ready to explode.
Then the imbalance vanishes.
The dominant side is trapped.
The reversal begins.
By the time the candle confirms the move, the operation may already be complete.
The candle is the footprint.
The machinery moved first.
❤1🔥1
COMMON ORDER-BOOK TACTICS
Liquidity pulling
Orders disappear milliseconds before price reaches them, creating a vacuum and accelerating movement.
Liquidity stacking
Depth accumulates on one side of the book, shaping expectations and influencing short-term positioning.
Layering
Multiple orders appear across several price levels, creating the impression of strong supply or demand.
Spoof-like behavior
Displayed size attracts reactions, then vanishes before meaningful execution. Genuine intent and manipulative intent cannot be determined from a single snapshot, but the effect on slower participants can be identical.
Quote stuffing
Rapid order submissions and cancellations flood the market with information, increasing noise and reducing the reaction time available to slower systems.
Momentum ignition
Aggressive orders push price through a sensitive level, triggering stops, breakout systems, and forced executions.
Absorption traps
Heavy market buying or selling is absorbed without meaningful price continuation, trapping aggressive participants at the worst possible location.
Liquidity vacuum
Market makers temporarily withdraw, allowing price to travel rapidly toward the next meaningful concentration of orders.
PRICE IS THE BAIT
Liquidity is the objective.
Stops are liquidity.
Breakout orders are liquidity.
Liquidations are liquidity.
Panic is liquidity.
FOMO is liquidity.
The market does not need your opinion.
It needs your order.
It needs your entry.
Your stop.
Your forced exit.
Your emotional reaction.
That is why the most obvious level is often the most dangerous.
That is why the cleanest breakout often reverses instantly.
That is why price can sweep both sides before making the “real” move.
The market is not confused.
It is searching.
RETAIL WATCHES DIRECTION
HFT watches behavior.
Retail asks:
“Will price go up or down?”
The engine asks:
“Where will the largest reaction occur?”
“Where are the stops?”
“Where will liquidity disappear?”
“Which side is becoming trapped?”
“How much aggression can be absorbed?”
“What happens when this level breaks?”
The edge is not always predicting the destination.
The edge is understanding the extraction process.
WELCOME TO THE LIQUIDITY MACHINE
Bull trap.
Bear trap.
False wall.
Pulled bid.
Reloaded ask.
Aggressive sweep.
Passive absorption.
Liquidity vacuum.
Instant reversal.
Repeat.
The chart tells you where price went.
The order book tells you how the market forced everyone to participate.
Direction is the bait.
Liquidity is the target.
Speed is the weapon.
The order book is the battlefield.
And the attack begins long before the candle moves.
Liquidity pulling
Orders disappear milliseconds before price reaches them, creating a vacuum and accelerating movement.
Liquidity stacking
Depth accumulates on one side of the book, shaping expectations and influencing short-term positioning.
Layering
Multiple orders appear across several price levels, creating the impression of strong supply or demand.
Spoof-like behavior
Displayed size attracts reactions, then vanishes before meaningful execution. Genuine intent and manipulative intent cannot be determined from a single snapshot, but the effect on slower participants can be identical.
Quote stuffing
Rapid order submissions and cancellations flood the market with information, increasing noise and reducing the reaction time available to slower systems.
Momentum ignition
Aggressive orders push price through a sensitive level, triggering stops, breakout systems, and forced executions.
Absorption traps
Heavy market buying or selling is absorbed without meaningful price continuation, trapping aggressive participants at the worst possible location.
Liquidity vacuum
Market makers temporarily withdraw, allowing price to travel rapidly toward the next meaningful concentration of orders.
PRICE IS THE BAIT
Liquidity is the objective.
Stops are liquidity.
Breakout orders are liquidity.
Liquidations are liquidity.
Panic is liquidity.
FOMO is liquidity.
The market does not need your opinion.
It needs your order.
It needs your entry.
Your stop.
Your forced exit.
Your emotional reaction.
That is why the most obvious level is often the most dangerous.
That is why the cleanest breakout often reverses instantly.
That is why price can sweep both sides before making the “real” move.
The market is not confused.
It is searching.
RETAIL WATCHES DIRECTION
HFT watches behavior.
Retail asks:
“Will price go up or down?”
The engine asks:
“Where will the largest reaction occur?”
“Where are the stops?”
“Where will liquidity disappear?”
“Which side is becoming trapped?”
“How much aggression can be absorbed?”
“What happens when this level breaks?”
The edge is not always predicting the destination.
The edge is understanding the extraction process.
WELCOME TO THE LIQUIDITY MACHINE
Bull trap.
Bear trap.
False wall.
Pulled bid.
Reloaded ask.
Aggressive sweep.
Passive absorption.
Liquidity vacuum.
Instant reversal.
Repeat.
The chart tells you where price went.
The order book tells you how the market forced everyone to participate.
Direction is the bait.
Liquidity is the target.
Speed is the weapon.
The order book is the battlefield.
And the attack begins long before the candle moves.
🔥1
Trend is your friend?
No.
If the trend is obvious,
you are already the liquidity.
Smart money exits.
Your stop pays for it.
The trend is the bait.
You are the exit.
No.
If the trend is obvious,
you are already the liquidity.
Smart money exits.
Your stop pays for it.
The trend is the bait.
You are the exit.
🚨 OFFICIAL SECURITY WARNING — SCAM ALERT 🚨
An individual using the Telegram account @Drmwape is allegedly impersonating me and attempting to sell META_quant / 3D_NEXUS_META tools to members of the community.
⚠️ This person is NOT my client, partner, employee, affiliate, or authorized reseller.
He holds no licence, no distribution rights, and absolutely no authorization to sell, resell, distribute, install, or provide access to any META_quant product.
Please DO NOT send him money, cryptocurrency, personal information, account credentials, or remote-access details.
Any tool, licence, download link, installation service, or commercial offer provided by this account must be considered unauthorized and potentially fraudulent.
✅ The only official META_quant channels are:
🌐 Official website: https://metaquantuniverse.com
🌐 3D_NEXUS_META: https://metaquantuniverse.com/nexus
📢 Official Telegram channel: https://t.me/QuantMapChannel
📧 Official email: metaquantuniverse@gmail.com
META_quant licences are issued exclusively through official channels and can be verified directly with me.
Please remain extremely cautious. Report and block this account, and contact me directly before making any payment to anyone claiming to represent META_quant.
Do not deal with this individual. Protect yourself and protect the community.
— Nicolas
META_quant UNIVERSE
An individual using the Telegram account @Drmwape is allegedly impersonating me and attempting to sell META_quant / 3D_NEXUS_META tools to members of the community.
⚠️ This person is NOT my client, partner, employee, affiliate, or authorized reseller.
He holds no licence, no distribution rights, and absolutely no authorization to sell, resell, distribute, install, or provide access to any META_quant product.
Please DO NOT send him money, cryptocurrency, personal information, account credentials, or remote-access details.
Any tool, licence, download link, installation service, or commercial offer provided by this account must be considered unauthorized and potentially fraudulent.
✅ The only official META_quant channels are:
🌐 Official website: https://metaquantuniverse.com
🌐 3D_NEXUS_META: https://metaquantuniverse.com/nexus
📢 Official Telegram channel: https://t.me/QuantMapChannel
📧 Official email: metaquantuniverse@gmail.com
META_quant licences are issued exclusively through official channels and can be verified directly with me.
Please remain extremely cautious. Report and block this account, and contact me directly before making any payment to anyone claiming to represent META_quant.
Do not deal with this individual. Protect yourself and protect the community.
— Nicolas
META_quant UNIVERSE
Metaquantuniverse
3D NEXUS META V8.5 — Predictive Order Flow Combat Cockpit
A browser-native 3D orderbook, prediction and execution cockpit for advanced traders.
❤1
PRIVATE R&D UPDATE 🔬⚙️
I’m currently working on a new project in close collaboration with my colleague Aurélien.
It sits somewhere between 3D_NEXUS_META and MT5 Liqbot AI.
I rebuilt the full core of the 3D_NEXUS_META engine inside a standalone Python trading module:
• NEXUS microstructure signals
• Signal Labs logic
• execution pipelines
• order-book and tape analysis
• netting basket management
• adaptive risk controls
• machine-learning, reinforcement-learning and AI research layers
• a clean, user-friendly GUI designed for real operational use
The objective is not to create another black-box bot.
The objective is to build an autonomous research and execution engine capable of studying market states, learning from signal behaviour, measuring risk, and adapting its decisions over time.
The first tests on Gold Futures have been extremely encouraging.
📊 First full MT5 test day:
+$1,041.42 net profit
250 trades
56.40% winning positions
Profit Factor: 1.20
Maximum drawdown: 9.64%
Early-stage demo research, of course. No promises. No victory lap.
But the engine is alive.
The execution layer is stable.
The data is flowing.
The learning process has begun.
For now, this remains an exclusive private project.
It is not available.
There is no access.
There is no public release date.
This is deep work only: automated learning, market-state research, basket behaviour, signal validation and institutional-grade execution studies.
Stay close.
I’ll let you know when the doors open. 🧠📡
#AlgorithmicTrading #MachineLearning #ReinforcementLearning #OrderFlow #MarketMicrostructure #GoldFutures #MT5 #PythonTrading #AITrading #QuantTrading #NEXUSMETA
I’m currently working on a new project in close collaboration with my colleague Aurélien.
It sits somewhere between 3D_NEXUS_META and MT5 Liqbot AI.
I rebuilt the full core of the 3D_NEXUS_META engine inside a standalone Python trading module:
• NEXUS microstructure signals
• Signal Labs logic
• execution pipelines
• order-book and tape analysis
• netting basket management
• adaptive risk controls
• machine-learning, reinforcement-learning and AI research layers
• a clean, user-friendly GUI designed for real operational use
The objective is not to create another black-box bot.
The objective is to build an autonomous research and execution engine capable of studying market states, learning from signal behaviour, measuring risk, and adapting its decisions over time.
The first tests on Gold Futures have been extremely encouraging.
📊 First full MT5 test day:
+$1,041.42 net profit
250 trades
56.40% winning positions
Profit Factor: 1.20
Maximum drawdown: 9.64%
Early-stage demo research, of course. No promises. No victory lap.
But the engine is alive.
The execution layer is stable.
The data is flowing.
The learning process has begun.
For now, this remains an exclusive private project.
It is not available.
There is no access.
There is no public release date.
This is deep work only: automated learning, market-state research, basket behaviour, signal validation and institutional-grade execution studies.
Stay close.
I’ll let you know when the doors open. 🧠📡
#AlgorithmicTrading #MachineLearning #ReinforcementLearning #OrderFlow #MarketMicrostructure #GoldFutures #MT5 #PythonTrading #AITrading #QuantTrading #NEXUSMETA
❤2👍2🔥1
🔒 PRIVATE CHANNEL DROP
Family, the new video is live. ₿⚡️
This time, I pushed 3D_NEXUS_META directly into one of the most aggressive environments available:
BTCUSDT on Binance Perpetual Futures.
And honestly, this market is pure market-maker territory.
Liquidity walls appear.
Pressure flips in seconds.
Orders get pulled.
Traders get trapped.
Then the liquidation cascade begins.
In the video, I show how 3D_NEXUS_META reveals the real structure behind the move:
🔹 Bid and ask liquidity walls
🔹 Aggressive executions
🔹 Absorption and exhaustion
🔹 Liquidity pulling and stacking
🔹 Market-maker traps
🔹 Real-time order-flow pressure
🔹 3D trade bubbles and market reactions
But the real weapon here is the SIGNALS LAB. 🧠
It does not simply print random BUY and SELL signals.
It studies the full context:
✅ Liquidity imbalance
✅ Trade aggression
✅ Market speed
✅ Pressure shifts
✅ Absorption zones
✅ Exhaustion events
✅ Signal quality
✅ Market regime changes
The objective is not to predict every tick.
The objective is to identify the moment when the internal structure of BTCUSDT becomes unstable, asymmetric and ready to move.
This is exactly why I built 3D_NEXUS_META.
Candles show you what already happened.
The order book shows you who is preparing the next attack.
🎥 Watch the new video here:
👉 https://youtu.be/Fsk1eY-B5mk
Drop your feedback inside the group after watching it.
I especially want to know which BTCUSDT signal or liquidity event you found the most violent. 🔬🔥
Price is the result. Liquidity is the cause.
#3D_NEXUS_META #SIGNALSLAB #BTCUSDT #BinancePerps #OrderFlow #MarketMicrostructure
Family, the new video is live. ₿⚡️
This time, I pushed 3D_NEXUS_META directly into one of the most aggressive environments available:
BTCUSDT on Binance Perpetual Futures.
And honestly, this market is pure market-maker territory.
Liquidity walls appear.
Pressure flips in seconds.
Orders get pulled.
Traders get trapped.
Then the liquidation cascade begins.
In the video, I show how 3D_NEXUS_META reveals the real structure behind the move:
🔹 Bid and ask liquidity walls
🔹 Aggressive executions
🔹 Absorption and exhaustion
🔹 Liquidity pulling and stacking
🔹 Market-maker traps
🔹 Real-time order-flow pressure
🔹 3D trade bubbles and market reactions
But the real weapon here is the SIGNALS LAB. 🧠
It does not simply print random BUY and SELL signals.
It studies the full context:
✅ Liquidity imbalance
✅ Trade aggression
✅ Market speed
✅ Pressure shifts
✅ Absorption zones
✅ Exhaustion events
✅ Signal quality
✅ Market regime changes
The objective is not to predict every tick.
The objective is to identify the moment when the internal structure of BTCUSDT becomes unstable, asymmetric and ready to move.
This is exactly why I built 3D_NEXUS_META.
Candles show you what already happened.
The order book shows you who is preparing the next attack.
🎥 Watch the new video here:
👉 https://youtu.be/Fsk1eY-B5mk
Drop your feedback inside the group after watching it.
I especially want to know which BTCUSDT signal or liquidity event you found the most violent. 🔬🔥
Price is the result. Liquidity is the cause.
#3D_NEXUS_META #SIGNALSLAB #BTCUSDT #BinancePerps #OrderFlow #MarketMicrostructure
YouTube
BTCUSDT IS A MARKET MAKER TRAP: Watch 3D_NEXUS_META Expose the Game 🔥
🚨 BTCUSDT on Binance Perpetuals is not just a market. It is a market maker’s laboratory.
In this new video, we deploy 3D_NEXUS_META directly on the BTCUSDT Binance Perps order book, where liquidity shifts at brutal speed, large players disguise their intentions…
In this new video, we deploy 3D_NEXUS_META directly on the BTCUSDT Binance Perps order book, where liquidity shifts at brutal speed, large players disguise their intentions…
🔥1
PRIVATE R&D UPDATE 🔬⚙️
A few days ago, I shared the first results from the private autonomous trading engine I’m building with my colleague Aurélien.
The project sits between 3D_NEXUS_META, MT5 Liqbot AI, and a full quantitative research laboratory.
Since that first Gold Futures test, the engine has evolved dramatically.
This time, I moved the research to the E-mini S&P 500 Futures contract, using the deeper and more active order-book data from the main contract.
The latest version now includes:
• NEXUS microstructure signals
• LIQUIDITY IMPULSE detection
• INVERSE IMPACT detection
• Signal Arbiter for conflicting signal clusters
• MARKET and intelligent LIMIT execution
• Pending Order Guardian
• netting basket management
• adaptive SMART sizing
• multi-horizon signal tracking from 1 to 300 seconds
• MFE, MAE, expectancy and first-passage analysis
• BUY/SELL market baselines
• real-time feed-quality monitoring
• statistical confidence intervals
• signal stability analysis
• Parquet and SQLite research datasets
• a complete live STATS dashboard
This is no longer just a bot that receives a signal and fires an order.
It is becoming a complete research, execution and validation engine capable of studying every signal, every market state, every rejected opportunity and every execution outcome.
Latest full MT5 demo test 📊
Starting balance:
$10,000
Current balance:
$22,511.50
Closed net profit:
+$12,531.50
Total trades:
248
Winning positions:
69.35%
Profit Factor:
1.20
The system faced several severe drawdowns during the test.
One of them almost erased a large portion of the accumulated performance before the engine recovered and reached a new all-time high.
That was the most important lesson of the entire experiment.
The signal engine was working.
The main issue was not necessarily the edge.
The issue was the interaction between SMART sizing, multiple basket entries and total exposure.
So I reduced the risk.
Current configuration:
• TP: 20 ticks
• SL: 20 ticks
• maximum basket entries: 1
• SMART maximum multiplier: ×3
• no position stacking
• Signal Arbiter enabled
• LIQUIDITY IMPULSE enabled
• INVERSE IMPACT enabled
Since that adjustment, the gains have become smaller and more controlled, but the capital has continued to rise without the same violent exposure spikes.
Less fireworks.
More structure.
More control.
More usable data.
This is exactly what private R&D is supposed to do.
Not hide the drawdown.
Not celebrate a lucky equity spike.
But identify what created the performance, what created the risk, and separate the true signal edge from the leverage applied around it.
The next stage is now clear:
• fixed-risk control tests
• SMART ON versus SMART OFF
• E-mini data with Micro E-mini execution
• signal analysis by side, session and market regime
• multiple-day out-of-sample validation
• conservative basket-risk limits
• preparation of the future ML Shadow Mode
This remains an exclusive private project.
It is not available.
There is no public access.
There is no release date.
But the engine is alive.
The execution stack is stable.
The data layer is becoming institutional-grade.
And for the first time, the system is not simply trading the market.
It is studying its own intelligence. 🧠📡
#AlgorithmicTrading #OrderFlow #MarketMicrostructure #SP500 #ESFutures #FuturesTrading #MT5 #PythonTrading #QuantTrading #AITrading #MachineLearning #ReinforcementLearning #NEXUSMETA #TradingResearch
A few days ago, I shared the first results from the private autonomous trading engine I’m building with my colleague Aurélien.
The project sits between 3D_NEXUS_META, MT5 Liqbot AI, and a full quantitative research laboratory.
Since that first Gold Futures test, the engine has evolved dramatically.
This time, I moved the research to the E-mini S&P 500 Futures contract, using the deeper and more active order-book data from the main contract.
The latest version now includes:
• NEXUS microstructure signals
• LIQUIDITY IMPULSE detection
• INVERSE IMPACT detection
• Signal Arbiter for conflicting signal clusters
• MARKET and intelligent LIMIT execution
• Pending Order Guardian
• netting basket management
• adaptive SMART sizing
• multi-horizon signal tracking from 1 to 300 seconds
• MFE, MAE, expectancy and first-passage analysis
• BUY/SELL market baselines
• real-time feed-quality monitoring
• statistical confidence intervals
• signal stability analysis
• Parquet and SQLite research datasets
• a complete live STATS dashboard
This is no longer just a bot that receives a signal and fires an order.
It is becoming a complete research, execution and validation engine capable of studying every signal, every market state, every rejected opportunity and every execution outcome.
Latest full MT5 demo test 📊
Starting balance:
$10,000
Current balance:
$22,511.50
Closed net profit:
+$12,531.50
Total trades:
248
Winning positions:
69.35%
Profit Factor:
1.20
The system faced several severe drawdowns during the test.
One of them almost erased a large portion of the accumulated performance before the engine recovered and reached a new all-time high.
That was the most important lesson of the entire experiment.
The signal engine was working.
The main issue was not necessarily the edge.
The issue was the interaction between SMART sizing, multiple basket entries and total exposure.
So I reduced the risk.
Current configuration:
• TP: 20 ticks
• SL: 20 ticks
• maximum basket entries: 1
• SMART maximum multiplier: ×3
• no position stacking
• Signal Arbiter enabled
• LIQUIDITY IMPULSE enabled
• INVERSE IMPACT enabled
Since that adjustment, the gains have become smaller and more controlled, but the capital has continued to rise without the same violent exposure spikes.
Less fireworks.
More structure.
More control.
More usable data.
This is exactly what private R&D is supposed to do.
Not hide the drawdown.
Not celebrate a lucky equity spike.
But identify what created the performance, what created the risk, and separate the true signal edge from the leverage applied around it.
The next stage is now clear:
• fixed-risk control tests
• SMART ON versus SMART OFF
• E-mini data with Micro E-mini execution
• signal analysis by side, session and market regime
• multiple-day out-of-sample validation
• conservative basket-risk limits
• preparation of the future ML Shadow Mode
This remains an exclusive private project.
It is not available.
There is no public access.
There is no release date.
But the engine is alive.
The execution stack is stable.
The data layer is becoming institutional-grade.
And for the first time, the system is not simply trading the market.
It is studying its own intelligence. 🧠📡
#AlgorithmicTrading #OrderFlow #MarketMicrostructure #SP500 #ESFutures #FuturesTrading #MT5 #PythonTrading #QuantTrading #AITrading #MachineLearning #ReinforcementLearning #NEXUSMETA #TradingResearch
❤1👍1
🔥 FROM MARKET DATA TO REAL EXECUTION: THE AURELIEN R&D PROJECT IS PRODUCING RESULTS
Over the past weeks, I have been working with Aurelien on a major transformation of the entire 3D_NEXUS_META ecosystem.
The objective was not to create another indicator packed with attractive signals.
The objective was to build a complete, independent pipeline:
MARKET DATA → SIGNAL ENGINE → EDGE DISCOVERY → STRATEGY → MT5 EXECUTION
1️⃣ A COMPLETE REBUILD OF THE SIGNAL ENGINE
The core of 3D_NEXUS_META and its signal architecture has been extensively redesigned in Python.
The new engine can process and combine:
• Price action and market structure
• Bid/Ask activity
• Volume imbalance
• Level 2 order-book data
• Liquidity behaviour
• Absorption and exhaustion events
• Volatility and market-regime information
• Statistical confidence and execution conditions
No vague BUY/SELL arrows. The purpose is to understand what is happening inside the auction, then determine whether the detected behaviour contains a measurable edge.
2️⃣ A FULLY INDEPENDENT MT5 AUTO-TRADING MODULE
A completely independent execution system was then created and connected directly to MetaTrader 5.
It can manage the complete trading cycle:
Signal validation → Order placement → Position sizing → TP/SL management → Exit logic → Statistics and reporting
Two different modes were recently tested:
🟡 EPU26: semi-automatic trading, combining machine-generated information with human validation.
🔵 MESU26: fully automatic trading, where detection, entry and position management are handled directly by the engine.
3️⃣ THE EDGE DISCOVERY LAB
We also built a dedicated research environment: THE LAB.
Instead of inventing a strategy first and forcing the market to confirm it, the LAB starts from collected market samples and searches for recurring behaviours directly inside the data.
It performs:
• Data collection and feature engineering
• Signal labelling across multiple horizons
• MFE/MAE analysis
• Baseline comparisons
• Session and volatility segmentation
• Parameter exploration
• Stability and robustness testing
• Strategy ranking and statistical reporting
In other words, the LAB is designed to separate a genuine market recurrence from a seductive historical coincidence.
4️⃣ SEVERAL SCALPING EDGES HAVE NOW EMERGED
Two to three strategies are currently showing particularly interesting behaviour.
One of the strongest is remarkably simple:
🎯 Identify a key high or low
🎯 Detect price extension into that level
🎯 Confirm volume absorption
🎯 Place a limit order to fade the failed extension
🎯 Capture the short-term price rejection
This is not prediction theatre.
It is pure tactical scalping, based on liquidity, execution thresholds and the inability of aggressive participants to continue pushing through a key level.
📊 RECENT COMBINED EPU26 + MESU26 RESULTS
Net profit: +€10,957.61
Final balance: €24,081.36
703 completed trades
650 winning trades
92.46% overall win rate
95.45% winning short positions
89.81% winning long positions
Profit factor: 5.14
Recovery factor: 10.53
Maximum balance drawdown: €1,040.98, or 7.67%
The report records €13,607.30 in gross profit versus €2,649.69 in gross losses.
These performances are extremely promising, especially considering that they combine two execution paradigms and hundreds of individual scalping operations. The report contains both EPU26 and MESU26 transactions, including automated limit-order activity and rapid bidirectional execution.
But this is only the beginning.
The next phase is about making the system harder to break:
Out-of-sample validation. Forward testing. Slippage stress tests. Risk normalization. Regime adaptation. Execution quality analysis.
The real breakthrough is not one equity curve.
It is the construction of a complete technological chain capable of going from raw market behaviour to measurable research, and from measurable research to autonomous execution.
That machine is now alive. 🧬⚙️
Over the past weeks, I have been working with Aurelien on a major transformation of the entire 3D_NEXUS_META ecosystem.
The objective was not to create another indicator packed with attractive signals.
The objective was to build a complete, independent pipeline:
MARKET DATA → SIGNAL ENGINE → EDGE DISCOVERY → STRATEGY → MT5 EXECUTION
1️⃣ A COMPLETE REBUILD OF THE SIGNAL ENGINE
The core of 3D_NEXUS_META and its signal architecture has been extensively redesigned in Python.
The new engine can process and combine:
• Price action and market structure
• Bid/Ask activity
• Volume imbalance
• Level 2 order-book data
• Liquidity behaviour
• Absorption and exhaustion events
• Volatility and market-regime information
• Statistical confidence and execution conditions
No vague BUY/SELL arrows. The purpose is to understand what is happening inside the auction, then determine whether the detected behaviour contains a measurable edge.
2️⃣ A FULLY INDEPENDENT MT5 AUTO-TRADING MODULE
A completely independent execution system was then created and connected directly to MetaTrader 5.
It can manage the complete trading cycle:
Signal validation → Order placement → Position sizing → TP/SL management → Exit logic → Statistics and reporting
Two different modes were recently tested:
🟡 EPU26: semi-automatic trading, combining machine-generated information with human validation.
🔵 MESU26: fully automatic trading, where detection, entry and position management are handled directly by the engine.
3️⃣ THE EDGE DISCOVERY LAB
We also built a dedicated research environment: THE LAB.
Instead of inventing a strategy first and forcing the market to confirm it, the LAB starts from collected market samples and searches for recurring behaviours directly inside the data.
It performs:
• Data collection and feature engineering
• Signal labelling across multiple horizons
• MFE/MAE analysis
• Baseline comparisons
• Session and volatility segmentation
• Parameter exploration
• Stability and robustness testing
• Strategy ranking and statistical reporting
In other words, the LAB is designed to separate a genuine market recurrence from a seductive historical coincidence.
4️⃣ SEVERAL SCALPING EDGES HAVE NOW EMERGED
Two to three strategies are currently showing particularly interesting behaviour.
One of the strongest is remarkably simple:
🎯 Identify a key high or low
🎯 Detect price extension into that level
🎯 Confirm volume absorption
🎯 Place a limit order to fade the failed extension
🎯 Capture the short-term price rejection
This is not prediction theatre.
It is pure tactical scalping, based on liquidity, execution thresholds and the inability of aggressive participants to continue pushing through a key level.
📊 RECENT COMBINED EPU26 + MESU26 RESULTS
Net profit: +€10,957.61
Final balance: €24,081.36
703 completed trades
650 winning trades
92.46% overall win rate
95.45% winning short positions
89.81% winning long positions
Profit factor: 5.14
Recovery factor: 10.53
Maximum balance drawdown: €1,040.98, or 7.67%
The report records €13,607.30 in gross profit versus €2,649.69 in gross losses.
These performances are extremely promising, especially considering that they combine two execution paradigms and hundreds of individual scalping operations. The report contains both EPU26 and MESU26 transactions, including automated limit-order activity and rapid bidirectional execution.
But this is only the beginning.
The next phase is about making the system harder to break:
Out-of-sample validation. Forward testing. Slippage stress tests. Risk normalization. Regime adaptation. Execution quality analysis.
The real breakthrough is not one equity curve.
It is the construction of a complete technological chain capable of going from raw market behaviour to measurable research, and from measurable research to autonomous execution.
That machine is now alive. 🧬⚙️
❤1
⚠️ R&D transparency: these are experimental results obtained on an MT5 demo environment. They are not audited live-account results, and past or simulated performance does not guarantee future profitability.
❤1👍1
A few people asked the right questions under my last post, so let’s put the numbers back into context.
Yes, this is an MT5 demo account.
But the market data itself is not synthetic.
The engine processes a real-time CQG feed from the CME futures market. Real prices, real volatility, real order flow, real regime changes.
The fills are simulated.
The market being observed is not.
Now, the obvious limitation:
This track record covers only around three days.
That is nowhere near enough to claim long-term robustness across months, seasons and multiple volatility regimes. Anyone pretending otherwise would be selling smoke in a lab coat.
But there is another dimension to the sample.
The system generated 648 executed trade events during the original statement, through an aggressive scale-in / scale-out architecture.
That is a very large execution sample, even if it remains a very small time and regime sample.
Those are not the same thing.
A system may trade only ten times over three months. Another may produce hundreds of executions in three days.
The first has more calendar history.
The second has more repeated execution events.
Neither dimension is sufficient alone.
The real question is what the sample actually allows us to study.
In this case, it gives us a dense first look at:
execution behavior, fill frequency, scale management, short-term recurrence, exposure time and the way the engine behaves inside detected RANGE regimes.
And exposure time matters far more than most people admit.
From the completed position cycles:
Average holding time: 10 minutes 10 seconds
Median holding time: 1 minute 2 seconds
79% of positions closed within five minutes
Some lasted only a few seconds.
Only a handful remained open for hours.
This raises a genuine risk-management question.
Imagine two systems both producing approximately 1% in one trading day.
System A takes two or three trades, but remains exposed for several hours, potentially through economic releases, liquidity shocks, regime changes and unexpected market events.
System B takes one hundred very short trades, closes most positions within seconds or minutes, and repeatedly returns to a flat, liquid state.
Which system is actually carrying more risk?
The obvious answer is not necessarily the correct one.
A high-frequency system introduces other risks:
more turnover, more fees, more execution dependency, more opportunities for correlated errors and potentially violent inventory accumulation during a failed regime classification.
But a slower system carries prolonged market exposure.
Every additional minute inside a position is another minute during which the market can mutate.
So risk is not only:
How much can I lose?
It is also:
How long am I exposed?
How quickly can I become flat?
How much inventory exists when the regime changes?
How dependent is the result on one continuous market assumption?
This is the philosophical divide.
Would you rather produce the same daily return through:
100 trades lasting seconds or minutes
or
2–3 trades lasting several hours?
One concentrates risk in execution frequency.
The other concentrates risk in time exposure.
And neither is automatically safer.
The real answer probably lives in the interaction between:
frequency, duration, position size, turnover, regime detection and tail-loss control.
That is precisely what the next stage of the research must measure.
The first results are extremely encouraging.
But the purpose of forward testing is not to celebrate the first equity curve.
It is to discover where the machine breaks before the market does it for us.
So what is your risk philosophy?
More trades, shorter exposure, faster return to flat?
Or fewer trades, longer exposure, and more time for each thesis to unfold?
Same target. Completely different risk architecture.
The debate is open. ⚡️
Yes, this is an MT5 demo account.
But the market data itself is not synthetic.
The engine processes a real-time CQG feed from the CME futures market. Real prices, real volatility, real order flow, real regime changes.
The fills are simulated.
The market being observed is not.
Now, the obvious limitation:
This track record covers only around three days.
That is nowhere near enough to claim long-term robustness across months, seasons and multiple volatility regimes. Anyone pretending otherwise would be selling smoke in a lab coat.
But there is another dimension to the sample.
The system generated 648 executed trade events during the original statement, through an aggressive scale-in / scale-out architecture.
That is a very large execution sample, even if it remains a very small time and regime sample.
Those are not the same thing.
A system may trade only ten times over three months. Another may produce hundreds of executions in three days.
The first has more calendar history.
The second has more repeated execution events.
Neither dimension is sufficient alone.
The real question is what the sample actually allows us to study.
In this case, it gives us a dense first look at:
execution behavior, fill frequency, scale management, short-term recurrence, exposure time and the way the engine behaves inside detected RANGE regimes.
And exposure time matters far more than most people admit.
From the completed position cycles:
Average holding time: 10 minutes 10 seconds
Median holding time: 1 minute 2 seconds
79% of positions closed within five minutes
Some lasted only a few seconds.
Only a handful remained open for hours.
This raises a genuine risk-management question.
Imagine two systems both producing approximately 1% in one trading day.
System A takes two or three trades, but remains exposed for several hours, potentially through economic releases, liquidity shocks, regime changes and unexpected market events.
System B takes one hundred very short trades, closes most positions within seconds or minutes, and repeatedly returns to a flat, liquid state.
Which system is actually carrying more risk?
The obvious answer is not necessarily the correct one.
A high-frequency system introduces other risks:
more turnover, more fees, more execution dependency, more opportunities for correlated errors and potentially violent inventory accumulation during a failed regime classification.
But a slower system carries prolonged market exposure.
Every additional minute inside a position is another minute during which the market can mutate.
So risk is not only:
How much can I lose?
It is also:
How long am I exposed?
How quickly can I become flat?
How much inventory exists when the regime changes?
How dependent is the result on one continuous market assumption?
This is the philosophical divide.
Would you rather produce the same daily return through:
100 trades lasting seconds or minutes
or
2–3 trades lasting several hours?
One concentrates risk in execution frequency.
The other concentrates risk in time exposure.
And neither is automatically safer.
The real answer probably lives in the interaction between:
frequency, duration, position size, turnover, regime detection and tail-loss control.
That is precisely what the next stage of the research must measure.
The first results are extremely encouraging.
But the purpose of forward testing is not to celebrate the first equity curve.
It is to discover where the machine breaks before the market does it for us.
So what is your risk philosophy?
More trades, shorter exposure, faster return to flat?
Or fewer trades, longer exposure, and more time for each thesis to unfold?
Same target. Completely different risk architecture.
The debate is open. ⚡️
👍2🔥2