🚀 PRIVATE RELEASE FOR THE NEXUS COMMUNITY
Dear friends,
I’m happy to share the new:
⚙️ MT5/NEXUS Python Bridge v9.5
📊 NexusSignalsOverlay v5
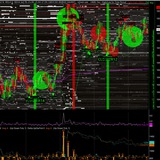
This update completes the connection between 3D_NEXUS_META and MetaTrader 5.
The full workflow can now operate inside one synchronized loop:
MT5 market data
⬇️
3D order-flow and HFT analysis
⬇️
Signal filtering
⬇️
Automatic MT5 execution
⬇️
Signals displayed directly on the MT5 chart
🔥 WHAT CHANGES WITH V9.5
The bridge is now much cleaner and more stable during live sessions.
Key improvements include:
🧵 Dedicated MT5 worker architecture
📡 Improved real-time synchronization
🗂 Lightweight atomic signal snapshots
🔄 Automatic journal rotation
🩺 Watchdog and reconnection logic
🛑 Execution safeguards and kill-switch support
📉 Fill, latency and rejection monitoring
🧊 Major anti-freeze improvements
The previous freezing behavior linked to the signal pipeline has been corrected.
The bridge can now stream, execute and update the overlay much more smoothly.
📊 NEW NEXUS SIGNAL OVERLAY V5
The new indicator displays NEXUS detections directly on your MT5 chart:
🟢 BUY-side signals
🟠 SELL-side signals
🛡 Absorption
🧊 Iceberg
💀 Exhaustion
📍 Precise price and timestamp synchronization
This makes it possible to compare the 3D liquidity structure with the traditional MT5 candlestick chart in real time.
No more manual synchronization between platforms.
🤖 FULL AUTO MODE TEST
This morning, I tested the complete setup on:
📈 MNQU26 Micro E-mini Nasdaq-100 futures
Configuration:
✅ AUTO TRADE active
✅ SMART Mode enabled
✅ Absorption alerts enabled
✅ Iceberg alerts enabled
✅ Exhaustion alerts enabled
✅ Automatic TP and SL
✅ Native MT5 overlay active
At the time of capture:
💰 +31 net ticks
🎯 Latest Take Profit: approximately +37 ticks
⚡️ 16 automated entries processed
🔄 One position still active
The goal is not to pretend that every trade wins.
The goal is to control losses, capture stronger movements and maintain positive expectancy across the full sequence.
📥 DOWNLOAD THE NEW PACKAGE
The package contains:
⚙️ MT5/NEXUS Python Bridge v9.5
📊 NexusSignalsOverlay v5
📄 Installation and configuration files
Download:
https://metaquantuniverse.com/download/dualMT5bridgeNEXUSv9.5.zip
Please test it when you have some time.
I would genuinely appreciate your feedback, especially regarding:
• Stability during long sessions
• Signal synchronization
• MT5 chart responsiveness
• Automatic execution behavior
• Broker compatibility
I remain available if you need help with the installation or configuration.
Do not hesitate to message me directly.
Nico
META_quant UNIVERSE
🌐 https://metaquantuniverse.com/nexus
The session result shown is a real-time research snapshot and does not guarantee future performance. Automated trading and leveraged products involve substantial risk.
Dear friends,
I’m happy to share the new:
⚙️ MT5/NEXUS Python Bridge v9.5
📊 NexusSignalsOverlay v5
This update completes the connection between 3D_NEXUS_META and MetaTrader 5.
The full workflow can now operate inside one synchronized loop:
MT5 market data
⬇️
3D order-flow and HFT analysis
⬇️
Signal filtering
⬇️
Automatic MT5 execution
⬇️
Signals displayed directly on the MT5 chart
🔥 WHAT CHANGES WITH V9.5
The bridge is now much cleaner and more stable during live sessions.
Key improvements include:
🧵 Dedicated MT5 worker architecture
📡 Improved real-time synchronization
🗂 Lightweight atomic signal snapshots
🔄 Automatic journal rotation
🩺 Watchdog and reconnection logic
🛑 Execution safeguards and kill-switch support
📉 Fill, latency and rejection monitoring
🧊 Major anti-freeze improvements
The previous freezing behavior linked to the signal pipeline has been corrected.
The bridge can now stream, execute and update the overlay much more smoothly.
📊 NEW NEXUS SIGNAL OVERLAY V5
The new indicator displays NEXUS detections directly on your MT5 chart:
🟢 BUY-side signals
🟠 SELL-side signals
🛡 Absorption
🧊 Iceberg
💀 Exhaustion
📍 Precise price and timestamp synchronization
This makes it possible to compare the 3D liquidity structure with the traditional MT5 candlestick chart in real time.
No more manual synchronization between platforms.
🤖 FULL AUTO MODE TEST
This morning, I tested the complete setup on:
📈 MNQU26 Micro E-mini Nasdaq-100 futures
Configuration:
✅ AUTO TRADE active
✅ SMART Mode enabled
✅ Absorption alerts enabled
✅ Iceberg alerts enabled
✅ Exhaustion alerts enabled
✅ Automatic TP and SL
✅ Native MT5 overlay active
At the time of capture:
💰 +31 net ticks
🎯 Latest Take Profit: approximately +37 ticks
⚡️ 16 automated entries processed
🔄 One position still active
The goal is not to pretend that every trade wins.
The goal is to control losses, capture stronger movements and maintain positive expectancy across the full sequence.
📥 DOWNLOAD THE NEW PACKAGE
The package contains:
⚙️ MT5/NEXUS Python Bridge v9.5
📊 NexusSignalsOverlay v5
📄 Installation and configuration files
Download:
https://metaquantuniverse.com/download/dualMT5bridgeNEXUSv9.5.zip
Please test it when you have some time.
I would genuinely appreciate your feedback, especially regarding:
• Stability during long sessions
• Signal synchronization
• MT5 chart responsiveness
• Automatic execution behavior
• Broker compatibility
I remain available if you need help with the installation or configuration.
Do not hesitate to message me directly.
Nico
META_quant UNIVERSE
🌐 https://metaquantuniverse.com/nexus
The session result shown is a real-time research snapshot and does not guarantee future performance. Automated trading and leveraged products involve substantial risk.
👍2
Your candles are hiding the market.
Mine aren't.
This is what price REALLY trades through.
Liquidity.
Icebergs.
Absorption.
Traps.
NAKED.
https://youtu.be/uqylXyAJx3I
#OrderFlow #Trading #3DNEXUS_META
Mine aren't.
This is what price REALLY trades through.
Liquidity.
Icebergs.
Absorption.
Traps.
NAKED.
https://youtu.be/uqylXyAJx3I
#OrderFlow #Trading #3DNEXUS_META
❤1
⚡️ TAPE-CHART IS LIVE.
Candles are no longer just price.
They are execution maps.
🔴 BID hits on the left
🟢 ASK lifts on the right
Aggression. Imbalance. Absorption. Control.
All exposed inside every candle, in real time.
No lagging interpretation.
Just raw market microstructure.
3D_NEXUS_META
See the move before it becomes obvious.
#OrderFlow #Footprint #Trading #MarketMicrostructure #3DNEXUSMETA
Candles are no longer just price.
They are execution maps.
🔴 BID hits on the left
🟢 ASK lifts on the right
Aggression. Imbalance. Absorption. Control.
All exposed inside every candle, in real time.
No lagging interpretation.
Just raw market microstructure.
3D_NEXUS_META
See the move before it becomes obvious.
#OrderFlow #Footprint #Trading #MarketMicrostructure #3DNEXUSMETA
❤1
COMEX GOLD: The Bottom Was Built Inside the Order Book Before the Chart Reacted
Most traders saw a bounce.
The order book showed something far more important:
A buyer was actively constructing the bottom in real time.
In this new video, I recorded the GC Gold 100 oz futures contract on COMEX directly inside MetaTrader 5 using the NEXUS DOM Heatmap v9 and its native 2.5D Order Book Heatmap.
🎥 Watch the full video here:
https://youtu.be/cLtXnOY_f1A
This was not a random reversal.
It was not a technical pattern discovered after the move.
It was a live sequence of liquidity defense, absorption, replenishment and upward repositioning inside the order book.
🔍 The Setup
A very large resting BID size appeared below the market.
Price moved directly into that liquidity while aggressive sellers began executing into the bid.
At first glance, this could have looked bearish.
Sellers were active.
Price was under pressure.
The bid was being tested.
But the market was revealing a different story underneath the candles.
The large bid did not simply vanish after being touched.
It was:
✅ Hit by aggressive selling
✅ Partially consumed
✅ Reloaded after execution
✅ Replenished repeatedly
✅ Maintained beneath price
✅ Lifted toward higher price levels
That final point was critical.
The liquidity was not remaining static at one fixed level.
It was being repositioned upward, maintaining continuous buying pressure beneath the market as price attempted to recover.
This is where a basic liquidity wall becomes something much more significant.
It becomes active defense.
🧠 Why the Reload Matters
A large resting order alone tells you very little.
Large liquidity can be:
❌ Cancelled before execution
❌ Used as a spoofing mechanism
❌ Fully consumed by stronger aggression
❌ Displayed to attract opposing flow
❌ Pulled when price approaches
The important information comes from what happens after the order is tested.
Does the liquidity disappear?
Does price break through it easily?
Does the order refill?
Do sellers continue to execute without producing meaningful downside movement?
Does the defended liquidity migrate higher?
In this GC sequence, the answer was clear.
Aggressive sellers were hitting the bid, but their executions were no longer producing proportional downside progress.
The sell flow was being absorbed.
The liquidity survived.
Then it reloaded.
Then it moved upward.
That is the type of sequence that can reveal a short-term transfer of control.
🔵 What NEXUS Detected
The NEXUS DOM Heatmap v9 was not simply displaying a colorful order book.
The engine was reading the structure behind the interaction.
The sequence included:
🔹 Bid-side absorption
🔹 Resting liquidity replenishment
🔹 Aggressive sell flow failing to move price lower
🔹 Repeated defense of the same price area
🔹 Bid liquidity migrating upward
🔹 Recovery above the defended zone
🔹 A developing REVERSAL RISK UP market state
Near the end of the recording, the consequence becomes visible.
Price begins to rebound away from the defended liquidity zone.
The candle chart finally reacts.
But by that point, the order book had already shown the battle.
📊 The Chart Shows the Result. The DOM Shows the Cause.
Traditional charts compress market activity into candles.
A candle tells you where price opened, moved and closed.
It does not directly tell you:
Where large liquidity appeared.
Whether that liquidity was pulled or executed.
Whether it survived repeated aggression.
Whether it reloaded after being hit.
Whether the bid was lifted to maintain pressure.
Whether sellers were active but ineffective.
That information exists inside the interaction between liquidity and execution.
This is precisely where DOM analysis becomes useful.
The 2.5D heatmap makes the historical order book structure visually readable.
Instead of only seeing isolated numbers in a traditional price ladder, you can observe the development of liquidity through time and price.
Most traders saw a bounce.
The order book showed something far more important:
A buyer was actively constructing the bottom in real time.
In this new video, I recorded the GC Gold 100 oz futures contract on COMEX directly inside MetaTrader 5 using the NEXUS DOM Heatmap v9 and its native 2.5D Order Book Heatmap.
🎥 Watch the full video here:
https://youtu.be/cLtXnOY_f1A
This was not a random reversal.
It was not a technical pattern discovered after the move.
It was a live sequence of liquidity defense, absorption, replenishment and upward repositioning inside the order book.
🔍 The Setup
A very large resting BID size appeared below the market.
Price moved directly into that liquidity while aggressive sellers began executing into the bid.
At first glance, this could have looked bearish.
Sellers were active.
Price was under pressure.
The bid was being tested.
But the market was revealing a different story underneath the candles.
The large bid did not simply vanish after being touched.
It was:
✅ Hit by aggressive selling
✅ Partially consumed
✅ Reloaded after execution
✅ Replenished repeatedly
✅ Maintained beneath price
✅ Lifted toward higher price levels
That final point was critical.
The liquidity was not remaining static at one fixed level.
It was being repositioned upward, maintaining continuous buying pressure beneath the market as price attempted to recover.
This is where a basic liquidity wall becomes something much more significant.
It becomes active defense.
🧠 Why the Reload Matters
A large resting order alone tells you very little.
Large liquidity can be:
❌ Cancelled before execution
❌ Used as a spoofing mechanism
❌ Fully consumed by stronger aggression
❌ Displayed to attract opposing flow
❌ Pulled when price approaches
The important information comes from what happens after the order is tested.
Does the liquidity disappear?
Does price break through it easily?
Does the order refill?
Do sellers continue to execute without producing meaningful downside movement?
Does the defended liquidity migrate higher?
In this GC sequence, the answer was clear.
Aggressive sellers were hitting the bid, but their executions were no longer producing proportional downside progress.
The sell flow was being absorbed.
The liquidity survived.
Then it reloaded.
Then it moved upward.
That is the type of sequence that can reveal a short-term transfer of control.
🔵 What NEXUS Detected
The NEXUS DOM Heatmap v9 was not simply displaying a colorful order book.
The engine was reading the structure behind the interaction.
The sequence included:
🔹 Bid-side absorption
🔹 Resting liquidity replenishment
🔹 Aggressive sell flow failing to move price lower
🔹 Repeated defense of the same price area
🔹 Bid liquidity migrating upward
🔹 Recovery above the defended zone
🔹 A developing REVERSAL RISK UP market state
Near the end of the recording, the consequence becomes visible.
Price begins to rebound away from the defended liquidity zone.
The candle chart finally reacts.
But by that point, the order book had already shown the battle.
📊 The Chart Shows the Result. The DOM Shows the Cause.
Traditional charts compress market activity into candles.
A candle tells you where price opened, moved and closed.
It does not directly tell you:
Where large liquidity appeared.
Whether that liquidity was pulled or executed.
Whether it survived repeated aggression.
Whether it reloaded after being hit.
Whether the bid was lifted to maintain pressure.
Whether sellers were active but ineffective.
That information exists inside the interaction between liquidity and execution.
This is precisely where DOM analysis becomes useful.
The 2.5D heatmap makes the historical order book structure visually readable.
Instead of only seeing isolated numbers in a traditional price ladder, you can observe the development of liquidity through time and price.
You can see where the market was defended.
You can see whether the liquidity remained present.
You can see whether aggressive flow produced real movement.
You can see whether the book was becoming stronger or weaker around price.
⚙️ Why the 2.5D Heatmap Changes the Reading
The native 2.5D visualization inside NEXUS transforms the order book into a spatial structure.
Liquidity is not only represented through color intensity.
Its relative importance can also be displayed through relief and visual depth.
This makes it easier to distinguish:
📌 Major resting liquidity from background noise
📌 Persistent liquidity from temporary flashes
📌 Reloading activity from one-time orders
📌 Bid-side defense from passive book imbalance
📌 Liquidity migration across multiple price levels
📌 Thin zones and liquidity vacuums around price
The objective is not to make the market look impressive.
The objective is to make its internal structure easier to interpret.
🎯 Why This Matters for Scalping
This type of defended liquidity zone can create a highly asymmetric trading scenario.
The logic is simple.
When a strong bid is tested, survives, reloads and begins migrating higher, the defended area can provide a precise structural reference.
The invalidation may remain relatively close beneath the liquidity zone.
At the same time, the rebound may travel significantly further if trapped sellers begin exiting and buyers regain control.
That creates the potential for:
🔹 Tight structural invalidation
🔹 Clear order-flow confirmation
🔹 Reduced dependence on arbitrary indicators
🔹 Favorable risk-to-reward geometry
🔹 Earlier recognition of a developing reversal
The trade does not come from predicting the next candle.
It comes from observing the mechanics creating the next candle.
⚠️ A Large Bid Is Not Automatically Bullish
This distinction is essential.
Seeing one large bid should never be treated as an automatic buy signal.
The order must be observed through its entire lifecycle.
The real sequence to study is:
Display → Test → Execution → Reload → Failure to break → Liquidity lift → Recovery
Each stage adds information.
A displayed order can be fake.
A tested order becomes more relevant.
An executed order that reloads becomes even more important.
A reloading order that prevents further downside movement reveals absorption.
A defended order that then migrates higher can indicate that the buyer is actively maintaining pressure.
The edge exists in the sequence, not in one isolated number.
🖥 NEXUS DOM Heatmap v9 for MT5
NEXUS turns MetaTrader 5 into a complete order-flow workstation by combining:
🔹 Event-driven Level 2 DOM capture
🔹 Bid and ask liquidity history
🔹 Native 2.5D order-book rendering
🔹 Pulling and stacking detection
🔹 Reload and replenishment analysis
🔹 Bid and ask absorption detection
🔹 Time & Sales visualization
🔹 Footprint and aggressive-flow analysis
🔹 Liquidity-vacuum tracking
🔹 Market-state classification
🔹 Data Quality Score
🔹 Smart liquidity zones
🔹 Neural Copilot powered through Groq or Cerebras
All of this is rendered directly inside the MT5 chart environment.
The goal is to move beyond traditional candle-based interpretation and expose the liquidity mechanics operating underneath price.
🔥 Final Takeaway
This COMEX GOLD bottom was not discovered after the rebound.
It was not explained using hindsight.
It was visible while it was being created.
Aggressive sellers hit the bid.
The bid absorbed them.
The liquidity reloaded.
The defended zone held.
The buyer lifted the liquidity higher.
Then price reacted.
That is the difference between watching the market and reading the engine that moves it.
🎥 Watch the complete COMEX GOLD order-flow sequence:
https://youtu.be/cLtXnOY_f1A
🚀 Discover the complete NEXUS ecosystem:
https://metaquantuniverse.com/nexus
#Gold #GC #COMEX #GoldFutures #OrderFlow #DOM #MarketDepth #Heatmap #MetaTrader5 #MT5 #Scalping #FuturesTrading #Liquidity #Absorption #Level2 #TradingTechnology #NEXUS #MetaQuantUniverse
You can see whether the liquidity remained present.
You can see whether aggressive flow produced real movement.
You can see whether the book was becoming stronger or weaker around price.
⚙️ Why the 2.5D Heatmap Changes the Reading
The native 2.5D visualization inside NEXUS transforms the order book into a spatial structure.
Liquidity is not only represented through color intensity.
Its relative importance can also be displayed through relief and visual depth.
This makes it easier to distinguish:
📌 Major resting liquidity from background noise
📌 Persistent liquidity from temporary flashes
📌 Reloading activity from one-time orders
📌 Bid-side defense from passive book imbalance
📌 Liquidity migration across multiple price levels
📌 Thin zones and liquidity vacuums around price
The objective is not to make the market look impressive.
The objective is to make its internal structure easier to interpret.
🎯 Why This Matters for Scalping
This type of defended liquidity zone can create a highly asymmetric trading scenario.
The logic is simple.
When a strong bid is tested, survives, reloads and begins migrating higher, the defended area can provide a precise structural reference.
The invalidation may remain relatively close beneath the liquidity zone.
At the same time, the rebound may travel significantly further if trapped sellers begin exiting and buyers regain control.
That creates the potential for:
🔹 Tight structural invalidation
🔹 Clear order-flow confirmation
🔹 Reduced dependence on arbitrary indicators
🔹 Favorable risk-to-reward geometry
🔹 Earlier recognition of a developing reversal
The trade does not come from predicting the next candle.
It comes from observing the mechanics creating the next candle.
⚠️ A Large Bid Is Not Automatically Bullish
This distinction is essential.
Seeing one large bid should never be treated as an automatic buy signal.
The order must be observed through its entire lifecycle.
The real sequence to study is:
Display → Test → Execution → Reload → Failure to break → Liquidity lift → Recovery
Each stage adds information.
A displayed order can be fake.
A tested order becomes more relevant.
An executed order that reloads becomes even more important.
A reloading order that prevents further downside movement reveals absorption.
A defended order that then migrates higher can indicate that the buyer is actively maintaining pressure.
The edge exists in the sequence, not in one isolated number.
🖥 NEXUS DOM Heatmap v9 for MT5
NEXUS turns MetaTrader 5 into a complete order-flow workstation by combining:
🔹 Event-driven Level 2 DOM capture
🔹 Bid and ask liquidity history
🔹 Native 2.5D order-book rendering
🔹 Pulling and stacking detection
🔹 Reload and replenishment analysis
🔹 Bid and ask absorption detection
🔹 Time & Sales visualization
🔹 Footprint and aggressive-flow analysis
🔹 Liquidity-vacuum tracking
🔹 Market-state classification
🔹 Data Quality Score
🔹 Smart liquidity zones
🔹 Neural Copilot powered through Groq or Cerebras
All of this is rendered directly inside the MT5 chart environment.
The goal is to move beyond traditional candle-based interpretation and expose the liquidity mechanics operating underneath price.
🔥 Final Takeaway
This COMEX GOLD bottom was not discovered after the rebound.
It was not explained using hindsight.
It was visible while it was being created.
Aggressive sellers hit the bid.
The bid absorbed them.
The liquidity reloaded.
The defended zone held.
The buyer lifted the liquidity higher.
Then price reacted.
That is the difference between watching the market and reading the engine that moves it.
🎥 Watch the complete COMEX GOLD order-flow sequence:
https://youtu.be/cLtXnOY_f1A
🚀 Discover the complete NEXUS ecosystem:
https://metaquantuniverse.com/nexus
#Gold #GC #COMEX #GoldFutures #OrderFlow #DOM #MarketDepth #Heatmap #MetaTrader5 #MT5 #Scalping #FuturesTrading #Liquidity #Absorption #Level2 #TradingTechnology #NEXUS #MetaQuantUniverse
YouTube
MT5 Has Never Looked Like This: 2.5D NEXUS DOM Heatmap Nails the GOLD Reversal
A COMEX GOLD bottom was not guessed here. It was constructed in real time inside the order book.
In this video, I record the GC Gold 100 oz futures contract directly inside MetaTrader 5 using the NEXUS DOM Heatmap v9, featuring its native 2.5D Order Book…
In this video, I record the GC Gold 100 oz futures contract directly inside MetaTrader 5 using the NEXUS DOM Heatmap v9, featuring its native 2.5D Order Book…
❤3
🚨 PRIVATE NEXUS UPDATE: THE LLM IS NOW INSIDE MT5
Guys, this is one of the most advanced integrations I have built for the NEXUS ecosystem.
The 2.5D NEXUS DOM Heatmap for MT5 now includes a fully integrated Neural Copilot connected directly to the live futures orderflow telemetry.
You can type questions directly inside the MT5 chart and receive a structured analysis of the current market microstructure.
📡 The LLM can receive live information about:
▪️ Best bid, best ask and spread
▪️ Full Level 2 order-book balance
▪️ Bid and ask depth concentration
▪️ Aggressive buy and sell flow
▪️ Tick-by-tick Time & Sales
▪️ Pulling and stacking
▪️ Absorption and replenishment
▪️ Liquidity vacuums
▪️ Market-state confidence
▪️ Bull and bear trap risk
▪️ Reversal and breakout context
▪️ Feed quality and telemetry health
⚙️ Technical Architecture
The system uses a dedicated companion EA so that LLM network requests remain outside the indicator and rendering thread.
Current inference layer:
⚡️ Groq integration
⚡️ Cerebras integration
⚡️ Automatic fallback between providers
⚡️ Contextual chat memory
⚡️ Live NEXUS telemetry injection
⚡️ Structured uncertainty and invalidation logic
This means the 2.5D heatmap can continue capturing and rendering live DOM events while the AI processes the orderflow context independently.
🧠 What This Changes
Until now, traders had to interpret every liquidity wall, vacuum, absorption cluster and order-book shift manually.
Now, the market can be interrogated directly:
The LLM does not replace the trader.
It becomes a second analytical layer inside the workstation.
Live futures data enters MT5.
NEXUS reconstructs the liquidity landscape.
The Neural Copilot explains the structure.
This is no longer a conventional indicator.
It is becoming an interactive market-intelligence terminal. 🧬📊
🔗 Full NEXUS ecosystem:
https://metaquantuniverse.com/nexus
Guys, this is one of the most advanced integrations I have built for the NEXUS ecosystem.
The 2.5D NEXUS DOM Heatmap for MT5 now includes a fully integrated Neural Copilot connected directly to the live futures orderflow telemetry.
You can type questions directly inside the MT5 chart and receive a structured analysis of the current market microstructure.
📡 The LLM can receive live information about:
▪️ Best bid, best ask and spread
▪️ Full Level 2 order-book balance
▪️ Bid and ask depth concentration
▪️ Aggressive buy and sell flow
▪️ Tick-by-tick Time & Sales
▪️ Pulling and stacking
▪️ Absorption and replenishment
▪️ Liquidity vacuums
▪️ Market-state confidence
▪️ Bull and bear trap risk
▪️ Reversal and breakout context
▪️ Feed quality and telemetry health
⚙️ Technical Architecture
The system uses a dedicated companion EA so that LLM network requests remain outside the indicator and rendering thread.
Current inference layer:
⚡️ Groq integration
⚡️ Cerebras integration
⚡️ Automatic fallback between providers
⚡️ Contextual chat memory
⚡️ Live NEXUS telemetry injection
⚡️ Structured uncertainty and invalidation logic
This means the 2.5D heatmap can continue capturing and rendering live DOM events while the AI processes the orderflow context independently.
🧠 What This Changes
Until now, traders had to interpret every liquidity wall, vacuum, absorption cluster and order-book shift manually.
Now, the market can be interrogated directly:
“Is the current buying pressure genuine?”
“Where is the nearest liquidity vacuum?”
“Is this breakout being absorbed?”
“What invalidates the current market-state hypothesis?”
The LLM does not replace the trader.
It becomes a second analytical layer inside the workstation.
Live futures data enters MT5.
NEXUS reconstructs the liquidity landscape.
The Neural Copilot explains the structure.
This is no longer a conventional indicator.
It is becoming an interactive market-intelligence terminal. 🧬📊
🔗 Full NEXUS ecosystem:
https://metaquantuniverse.com/nexus
Metaquantuniverse
3D NEXUS META V8.5 — Predictive Order Flow Combat Cockpit
A browser-native 3D orderbook, prediction and execution cockpit for advanced traders.
❤1🔥1
HFT ATTACK: THE MARKET IS NOT MOVING. IT IS BEING ENGINEERED.
100% CONTROLLED.
Not by a single trader.
Not by a secret button.
By speed.
By liquidity.
By market-making algorithms operating inside the order book.
Layering.
Pulling.
Stacking.
Repricing.
Absorbing.
Reloading.
The visible price is only the surface.
The real battle takes place inside the book.
Retail sees a breakout.
The HFT engine sees concentrated stop liquidity.
Retail sees resistance.
The market maker sees a cluster of conditional orders waiting to become market buys.
Retail sees support.
The algorithm sees sell-side liquidity waiting to be harvested.
Price does not always move because supply suddenly defeated demand.
Sometimes price moves because liquidity has been detected.
Targeted.
Provoked.
And extracted.
THE ORDER BOOK IS A CONTROL SYSTEM
Large bids appear.
Confidence rises.
Buyers enter.
Then the bids disappear.
Price collapses into the space they were supposedly protecting.
Large offers appear.
Sellers panic.
Short positions accumulate.
Then the offers are pulled.
Price launches upward through their stops.
The displayed liquidity was never a promise.
It was information.
A signal.
A pressure mechanism.
A way to influence positioning without necessarily executing the full displayed size.
The book creates the narrative.
The tape reveals the attack.
HFT DOES NOT NEED TO PREDICT THE MARKET
It can stimulate it.
A burst of aggressive selling hits the bid.
The bid absorbs.
More sellers enter.
Liquidity providers step back.
The spread expands.
Price drops through a visible level.
Stops activate.
Momentum systems join the move.
Then the original selling pressure disappears.
The book rebuilds underneath.
Price reverses.
The late sellers become forced buyers.
Their stop-losses provide the fuel for the recovery.
This is not simply direction.
It is a liquidity cycle.
Pressure. Reaction. Trigger. Extraction. Reversal.
Repeated thousands of times across instruments and timeframes.
MARKET MAKING IS NOT PASSIVE
The market maker is not sitting quietly between the bid and the ask.
Modern market making is adaptive.
It measures:
Order-flow imbalance
Queue position
Cancellation velocity
Aggressive trade intensity
Stop concentration
Short-term toxicity
Latency differences
Liquidity gaps
Hidden absorption
Cross-market reactions
It constantly decides where liquidity should appear.
Where it should disappear.
When the spread should tighten.
When it should widen.
When aggressive traders should be encouraged.
And when they should be trapped.
The objective is not to make the chart look logical.
The objective is to manage risk, capture spread, control inventory, and interact with liquidity before slower participants can react.
THE ATTACK HAPPENS BEFORE THE CANDLE
A candle shows the result.
The order book shows the preparation.
Liquidity is pulled from one side.
Depth is stacked on the other.
Market orders accelerate.
Passive orders absorb the attack.
The tape becomes one-sided.
Price appears ready to explode.
Then the imbalance vanishes.
The dominant side is trapped.
The reversal begins.
By the time the candle confirms the move, the operation may already be complete.
The candle is the footprint.
The machinery moved first.
100% CONTROLLED.
Not by a single trader.
Not by a secret button.
By speed.
By liquidity.
By market-making algorithms operating inside the order book.
Layering.
Pulling.
Stacking.
Repricing.
Absorbing.
Reloading.
The visible price is only the surface.
The real battle takes place inside the book.
Retail sees a breakout.
The HFT engine sees concentrated stop liquidity.
Retail sees resistance.
The market maker sees a cluster of conditional orders waiting to become market buys.
Retail sees support.
The algorithm sees sell-side liquidity waiting to be harvested.
Price does not always move because supply suddenly defeated demand.
Sometimes price moves because liquidity has been detected.
Targeted.
Provoked.
And extracted.
THE ORDER BOOK IS A CONTROL SYSTEM
Large bids appear.
Confidence rises.
Buyers enter.
Then the bids disappear.
Price collapses into the space they were supposedly protecting.
Large offers appear.
Sellers panic.
Short positions accumulate.
Then the offers are pulled.
Price launches upward through their stops.
The displayed liquidity was never a promise.
It was information.
A signal.
A pressure mechanism.
A way to influence positioning without necessarily executing the full displayed size.
The book creates the narrative.
The tape reveals the attack.
HFT DOES NOT NEED TO PREDICT THE MARKET
It can stimulate it.
A burst of aggressive selling hits the bid.
The bid absorbs.
More sellers enter.
Liquidity providers step back.
The spread expands.
Price drops through a visible level.
Stops activate.
Momentum systems join the move.
Then the original selling pressure disappears.
The book rebuilds underneath.
Price reverses.
The late sellers become forced buyers.
Their stop-losses provide the fuel for the recovery.
This is not simply direction.
It is a liquidity cycle.
Pressure. Reaction. Trigger. Extraction. Reversal.
Repeated thousands of times across instruments and timeframes.
MARKET MAKING IS NOT PASSIVE
The market maker is not sitting quietly between the bid and the ask.
Modern market making is adaptive.
It measures:
Order-flow imbalance
Queue position
Cancellation velocity
Aggressive trade intensity
Stop concentration
Short-term toxicity
Latency differences
Liquidity gaps
Hidden absorption
Cross-market reactions
It constantly decides where liquidity should appear.
Where it should disappear.
When the spread should tighten.
When it should widen.
When aggressive traders should be encouraged.
And when they should be trapped.
The objective is not to make the chart look logical.
The objective is to manage risk, capture spread, control inventory, and interact with liquidity before slower participants can react.
THE ATTACK HAPPENS BEFORE THE CANDLE
A candle shows the result.
The order book shows the preparation.
Liquidity is pulled from one side.
Depth is stacked on the other.
Market orders accelerate.
Passive orders absorb the attack.
The tape becomes one-sided.
Price appears ready to explode.
Then the imbalance vanishes.
The dominant side is trapped.
The reversal begins.
By the time the candle confirms the move, the operation may already be complete.
The candle is the footprint.
The machinery moved first.
❤1🔥1