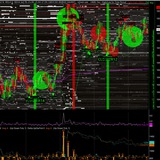
🚀 BIG UPDATE FOR 3D_NEXUS_META!
I’ve been working intensely behind the scenes, and I’m genuinely excited to share what is now being added to the platform.
The INFO panel has received a major order-flow upgrade.
In addition to the existing best bid, best ask, spread, volume, trades and delta data, it now includes a new layer of real-time metrics, each displayed numerically with its own integrated micro-chart:
📊 Cumulative Volume Delta
📊 Trades per minute
📊 Trades per hour
📊 Trades per day
📊 Volume per minute
📊 Volume per hour
📊 Volume per day
📊 Level 1 Depth Delta
📊 Full Order Book Depth Delta
These small charts make a real difference.
You can now see not only the current value, but also how each metric is evolving over time. It gives the INFO panel a much clearer sense of rhythm, pressure and market acceleration.
And that is only one part of the update.
I am also expanding the connectivity ecosystem of 3D_NEXUS_META with several new feeds, brokers and trading platforms.
Some integrations are already being tested, while others are currently being finalized:
1️⃣ Coinbase International Exchange
2️⃣ Interactive Brokers through TWS / IB Gateway
3️⃣ Alpaca for stocks, options and crypto
4️⃣ IQFeed for futures market data
5️⃣ Lightspeed for US stocks, with Polygon L2 data
The objective remains the same:
Build one powerful environment capable of connecting different markets, brokers, exchanges and institutional-grade data feeds into a single 3D order-flow universe.
Crypto. Futures. Stocks. Options. Market depth. Trades. Liquidity. Execution.
Everything is gradually coming together.
3D_NEXUS_META is growing fast, and this new update is another serious step forward.
Thank you to everyone testing it, sending feedback and helping me push the project further.
More integrations are already cooking. 🔥
#3DNEXUSMETA #OrderFlow #Trading #MarketData #CryptoTrading #FuturesTrading #StockTrading #InteractiveBrokers #Alpaca #IQFeed #Coinbase #Lightspeed #PolygonIO #HFT #Liquidity #MarketMicrostructure
I’ve been working intensely behind the scenes, and I’m genuinely excited to share what is now being added to the platform.
The INFO panel has received a major order-flow upgrade.
In addition to the existing best bid, best ask, spread, volume, trades and delta data, it now includes a new layer of real-time metrics, each displayed numerically with its own integrated micro-chart:
📊 Cumulative Volume Delta
📊 Trades per minute
📊 Trades per hour
📊 Trades per day
📊 Volume per minute
📊 Volume per hour
📊 Volume per day
📊 Level 1 Depth Delta
📊 Full Order Book Depth Delta
These small charts make a real difference.
You can now see not only the current value, but also how each metric is evolving over time. It gives the INFO panel a much clearer sense of rhythm, pressure and market acceleration.
And that is only one part of the update.
I am also expanding the connectivity ecosystem of 3D_NEXUS_META with several new feeds, brokers and trading platforms.
Some integrations are already being tested, while others are currently being finalized:
1️⃣ Coinbase International Exchange
2️⃣ Interactive Brokers through TWS / IB Gateway
3️⃣ Alpaca for stocks, options and crypto
4️⃣ IQFeed for futures market data
5️⃣ Lightspeed for US stocks, with Polygon L2 data
The objective remains the same:
Build one powerful environment capable of connecting different markets, brokers, exchanges and institutional-grade data feeds into a single 3D order-flow universe.
Crypto. Futures. Stocks. Options. Market depth. Trades. Liquidity. Execution.
Everything is gradually coming together.
3D_NEXUS_META is growing fast, and this new update is another serious step forward.
Thank you to everyone testing it, sending feedback and helping me push the project further.
More integrations are already cooking. 🔥
#3DNEXUSMETA #OrderFlow #Trading #MarketData #CryptoTrading #FuturesTrading #StockTrading #InteractiveBrokers #Alpaca #IQFeed #Coinbase #Lightspeed #PolygonIO #HFT #Liquidity #MarketMicrostructure
❤1🔥1
On financial markets, the only edge that truly matters is detecting manipulation setups.
That’s where the big money operates.
Retail and professional traders manipulate nothing. They are the liquidity.
Large positions need victims to enter and exit cheaply.
Not a conspiracy. A market mechanism.
And the best part?
It can be SEEN.
It can be MEASURED.
Welcome to 2026. This game has been running for 15+ years.
👉 3D_NEXUS_META
https://metaquantuniverse.com/nexus
That’s where the big money operates.
Retail and professional traders manipulate nothing. They are the liquidity.
Large positions need victims to enter and exit cheaply.
Not a conspiracy. A market mechanism.
And the best part?
It can be SEEN.
It can be MEASURED.
Welcome to 2026. This game has been running for 15+ years.
👉 3D_NEXUS_META
https://metaquantuniverse.com/nexus
Metaquantuniverse
3D NEXUS META V8.5 — Predictive Order Flow Combat Cockpit
A browser-native 3D orderbook, prediction and execution cockpit for advanced traders.
❤1🔥1
🚀 PRIVATE RELEASE FOR THE NEXUS COMMUNITY
Dear friends,
I’m happy to share the new:
⚙️ MT5/NEXUS Python Bridge v9.5
📊 NexusSignalsOverlay v5
This update completes the connection between 3D_NEXUS_META and MetaTrader 5.
The full workflow can now operate inside one synchronized loop:
MT5 market data
⬇️
3D order-flow and HFT analysis
⬇️
Signal filtering
⬇️
Automatic MT5 execution
⬇️
Signals displayed directly on the MT5 chart
🔥 WHAT CHANGES WITH V9.5
The bridge is now much cleaner and more stable during live sessions.
Key improvements include:
🧵 Dedicated MT5 worker architecture
📡 Improved real-time synchronization
🗂 Lightweight atomic signal snapshots
🔄 Automatic journal rotation
🩺 Watchdog and reconnection logic
🛑 Execution safeguards and kill-switch support
📉 Fill, latency and rejection monitoring
🧊 Major anti-freeze improvements
The previous freezing behavior linked to the signal pipeline has been corrected.
The bridge can now stream, execute and update the overlay much more smoothly.
📊 NEW NEXUS SIGNAL OVERLAY V5
The new indicator displays NEXUS detections directly on your MT5 chart:
🟢 BUY-side signals
🟠 SELL-side signals
🛡 Absorption
🧊 Iceberg
💀 Exhaustion
📍 Precise price and timestamp synchronization
This makes it possible to compare the 3D liquidity structure with the traditional MT5 candlestick chart in real time.
No more manual synchronization between platforms.
🤖 FULL AUTO MODE TEST
This morning, I tested the complete setup on:
📈 MNQU26 Micro E-mini Nasdaq-100 futures
Configuration:
✅ AUTO TRADE active
✅ SMART Mode enabled
✅ Absorption alerts enabled
✅ Iceberg alerts enabled
✅ Exhaustion alerts enabled
✅ Automatic TP and SL
✅ Native MT5 overlay active
At the time of capture:
💰 +31 net ticks
🎯 Latest Take Profit: approximately +37 ticks
⚡️ 16 automated entries processed
🔄 One position still active
The goal is not to pretend that every trade wins.
The goal is to control losses, capture stronger movements and maintain positive expectancy across the full sequence.
📥 DOWNLOAD THE NEW PACKAGE
The package contains:
⚙️ MT5/NEXUS Python Bridge v9.5
📊 NexusSignalsOverlay v5
📄 Installation and configuration files
Download:
https://metaquantuniverse.com/download/dualMT5bridgeNEXUSv9.5.zip
Please test it when you have some time.
I would genuinely appreciate your feedback, especially regarding:
• Stability during long sessions
• Signal synchronization
• MT5 chart responsiveness
• Automatic execution behavior
• Broker compatibility
I remain available if you need help with the installation or configuration.
Do not hesitate to message me directly.
Nico
META_quant UNIVERSE
🌐 https://metaquantuniverse.com/nexus
The session result shown is a real-time research snapshot and does not guarantee future performance. Automated trading and leveraged products involve substantial risk.
Dear friends,
I’m happy to share the new:
⚙️ MT5/NEXUS Python Bridge v9.5
📊 NexusSignalsOverlay v5
This update completes the connection between 3D_NEXUS_META and MetaTrader 5.
The full workflow can now operate inside one synchronized loop:
MT5 market data
⬇️
3D order-flow and HFT analysis
⬇️
Signal filtering
⬇️
Automatic MT5 execution
⬇️
Signals displayed directly on the MT5 chart
🔥 WHAT CHANGES WITH V9.5
The bridge is now much cleaner and more stable during live sessions.
Key improvements include:
🧵 Dedicated MT5 worker architecture
📡 Improved real-time synchronization
🗂 Lightweight atomic signal snapshots
🔄 Automatic journal rotation
🩺 Watchdog and reconnection logic
🛑 Execution safeguards and kill-switch support
📉 Fill, latency and rejection monitoring
🧊 Major anti-freeze improvements
The previous freezing behavior linked to the signal pipeline has been corrected.
The bridge can now stream, execute and update the overlay much more smoothly.
📊 NEW NEXUS SIGNAL OVERLAY V5
The new indicator displays NEXUS detections directly on your MT5 chart:
🟢 BUY-side signals
🟠 SELL-side signals
🛡 Absorption
🧊 Iceberg
💀 Exhaustion
📍 Precise price and timestamp synchronization
This makes it possible to compare the 3D liquidity structure with the traditional MT5 candlestick chart in real time.
No more manual synchronization between platforms.
🤖 FULL AUTO MODE TEST
This morning, I tested the complete setup on:
📈 MNQU26 Micro E-mini Nasdaq-100 futures
Configuration:
✅ AUTO TRADE active
✅ SMART Mode enabled
✅ Absorption alerts enabled
✅ Iceberg alerts enabled
✅ Exhaustion alerts enabled
✅ Automatic TP and SL
✅ Native MT5 overlay active
At the time of capture:
💰 +31 net ticks
🎯 Latest Take Profit: approximately +37 ticks
⚡️ 16 automated entries processed
🔄 One position still active
The goal is not to pretend that every trade wins.
The goal is to control losses, capture stronger movements and maintain positive expectancy across the full sequence.
📥 DOWNLOAD THE NEW PACKAGE
The package contains:
⚙️ MT5/NEXUS Python Bridge v9.5
📊 NexusSignalsOverlay v5
📄 Installation and configuration files
Download:
https://metaquantuniverse.com/download/dualMT5bridgeNEXUSv9.5.zip
Please test it when you have some time.
I would genuinely appreciate your feedback, especially regarding:
• Stability during long sessions
• Signal synchronization
• MT5 chart responsiveness
• Automatic execution behavior
• Broker compatibility
I remain available if you need help with the installation or configuration.
Do not hesitate to message me directly.
Nico
META_quant UNIVERSE
🌐 https://metaquantuniverse.com/nexus
The session result shown is a real-time research snapshot and does not guarantee future performance. Automated trading and leveraged products involve substantial risk.
👍2
Your candles are hiding the market.
Mine aren't.
This is what price REALLY trades through.
Liquidity.
Icebergs.
Absorption.
Traps.
NAKED.
https://youtu.be/uqylXyAJx3I
#OrderFlow #Trading #3DNEXUS_META
Mine aren't.
This is what price REALLY trades through.
Liquidity.
Icebergs.
Absorption.
Traps.
NAKED.
https://youtu.be/uqylXyAJx3I
#OrderFlow #Trading #3DNEXUS_META
❤1
⚡️ TAPE-CHART IS LIVE.
Candles are no longer just price.
They are execution maps.
🔴 BID hits on the left
🟢 ASK lifts on the right
Aggression. Imbalance. Absorption. Control.
All exposed inside every candle, in real time.
No lagging interpretation.
Just raw market microstructure.
3D_NEXUS_META
See the move before it becomes obvious.
#OrderFlow #Footprint #Trading #MarketMicrostructure #3DNEXUSMETA
Candles are no longer just price.
They are execution maps.
🔴 BID hits on the left
🟢 ASK lifts on the right
Aggression. Imbalance. Absorption. Control.
All exposed inside every candle, in real time.
No lagging interpretation.
Just raw market microstructure.
3D_NEXUS_META
See the move before it becomes obvious.
#OrderFlow #Footprint #Trading #MarketMicrostructure #3DNEXUSMETA
❤1
COMEX GOLD: The Bottom Was Built Inside the Order Book Before the Chart Reacted
Most traders saw a bounce.
The order book showed something far more important:
A buyer was actively constructing the bottom in real time.
In this new video, I recorded the GC Gold 100 oz futures contract on COMEX directly inside MetaTrader 5 using the NEXUS DOM Heatmap v9 and its native 2.5D Order Book Heatmap.
🎥 Watch the full video here:
https://youtu.be/cLtXnOY_f1A
This was not a random reversal.
It was not a technical pattern discovered after the move.
It was a live sequence of liquidity defense, absorption, replenishment and upward repositioning inside the order book.
🔍 The Setup
A very large resting BID size appeared below the market.
Price moved directly into that liquidity while aggressive sellers began executing into the bid.
At first glance, this could have looked bearish.
Sellers were active.
Price was under pressure.
The bid was being tested.
But the market was revealing a different story underneath the candles.
The large bid did not simply vanish after being touched.
It was:
✅ Hit by aggressive selling
✅ Partially consumed
✅ Reloaded after execution
✅ Replenished repeatedly
✅ Maintained beneath price
✅ Lifted toward higher price levels
That final point was critical.
The liquidity was not remaining static at one fixed level.
It was being repositioned upward, maintaining continuous buying pressure beneath the market as price attempted to recover.
This is where a basic liquidity wall becomes something much more significant.
It becomes active defense.
🧠 Why the Reload Matters
A large resting order alone tells you very little.
Large liquidity can be:
❌ Cancelled before execution
❌ Used as a spoofing mechanism
❌ Fully consumed by stronger aggression
❌ Displayed to attract opposing flow
❌ Pulled when price approaches
The important information comes from what happens after the order is tested.
Does the liquidity disappear?
Does price break through it easily?
Does the order refill?
Do sellers continue to execute without producing meaningful downside movement?
Does the defended liquidity migrate higher?
In this GC sequence, the answer was clear.
Aggressive sellers were hitting the bid, but their executions were no longer producing proportional downside progress.
The sell flow was being absorbed.
The liquidity survived.
Then it reloaded.
Then it moved upward.
That is the type of sequence that can reveal a short-term transfer of control.
🔵 What NEXUS Detected
The NEXUS DOM Heatmap v9 was not simply displaying a colorful order book.
The engine was reading the structure behind the interaction.
The sequence included:
🔹 Bid-side absorption
🔹 Resting liquidity replenishment
🔹 Aggressive sell flow failing to move price lower
🔹 Repeated defense of the same price area
🔹 Bid liquidity migrating upward
🔹 Recovery above the defended zone
🔹 A developing REVERSAL RISK UP market state
Near the end of the recording, the consequence becomes visible.
Price begins to rebound away from the defended liquidity zone.
The candle chart finally reacts.
But by that point, the order book had already shown the battle.
📊 The Chart Shows the Result. The DOM Shows the Cause.
Traditional charts compress market activity into candles.
A candle tells you where price opened, moved and closed.
It does not directly tell you:
Where large liquidity appeared.
Whether that liquidity was pulled or executed.
Whether it survived repeated aggression.
Whether it reloaded after being hit.
Whether the bid was lifted to maintain pressure.
Whether sellers were active but ineffective.
That information exists inside the interaction between liquidity and execution.
This is precisely where DOM analysis becomes useful.
The 2.5D heatmap makes the historical order book structure visually readable.
Instead of only seeing isolated numbers in a traditional price ladder, you can observe the development of liquidity through time and price.
Most traders saw a bounce.
The order book showed something far more important:
A buyer was actively constructing the bottom in real time.
In this new video, I recorded the GC Gold 100 oz futures contract on COMEX directly inside MetaTrader 5 using the NEXUS DOM Heatmap v9 and its native 2.5D Order Book Heatmap.
🎥 Watch the full video here:
https://youtu.be/cLtXnOY_f1A
This was not a random reversal.
It was not a technical pattern discovered after the move.
It was a live sequence of liquidity defense, absorption, replenishment and upward repositioning inside the order book.
🔍 The Setup
A very large resting BID size appeared below the market.
Price moved directly into that liquidity while aggressive sellers began executing into the bid.
At first glance, this could have looked bearish.
Sellers were active.
Price was under pressure.
The bid was being tested.
But the market was revealing a different story underneath the candles.
The large bid did not simply vanish after being touched.
It was:
✅ Hit by aggressive selling
✅ Partially consumed
✅ Reloaded after execution
✅ Replenished repeatedly
✅ Maintained beneath price
✅ Lifted toward higher price levels
That final point was critical.
The liquidity was not remaining static at one fixed level.
It was being repositioned upward, maintaining continuous buying pressure beneath the market as price attempted to recover.
This is where a basic liquidity wall becomes something much more significant.
It becomes active defense.
🧠 Why the Reload Matters
A large resting order alone tells you very little.
Large liquidity can be:
❌ Cancelled before execution
❌ Used as a spoofing mechanism
❌ Fully consumed by stronger aggression
❌ Displayed to attract opposing flow
❌ Pulled when price approaches
The important information comes from what happens after the order is tested.
Does the liquidity disappear?
Does price break through it easily?
Does the order refill?
Do sellers continue to execute without producing meaningful downside movement?
Does the defended liquidity migrate higher?
In this GC sequence, the answer was clear.
Aggressive sellers were hitting the bid, but their executions were no longer producing proportional downside progress.
The sell flow was being absorbed.
The liquidity survived.
Then it reloaded.
Then it moved upward.
That is the type of sequence that can reveal a short-term transfer of control.
🔵 What NEXUS Detected
The NEXUS DOM Heatmap v9 was not simply displaying a colorful order book.
The engine was reading the structure behind the interaction.
The sequence included:
🔹 Bid-side absorption
🔹 Resting liquidity replenishment
🔹 Aggressive sell flow failing to move price lower
🔹 Repeated defense of the same price area
🔹 Bid liquidity migrating upward
🔹 Recovery above the defended zone
🔹 A developing REVERSAL RISK UP market state
Near the end of the recording, the consequence becomes visible.
Price begins to rebound away from the defended liquidity zone.
The candle chart finally reacts.
But by that point, the order book had already shown the battle.
📊 The Chart Shows the Result. The DOM Shows the Cause.
Traditional charts compress market activity into candles.
A candle tells you where price opened, moved and closed.
It does not directly tell you:
Where large liquidity appeared.
Whether that liquidity was pulled or executed.
Whether it survived repeated aggression.
Whether it reloaded after being hit.
Whether the bid was lifted to maintain pressure.
Whether sellers were active but ineffective.
That information exists inside the interaction between liquidity and execution.
This is precisely where DOM analysis becomes useful.
The 2.5D heatmap makes the historical order book structure visually readable.
Instead of only seeing isolated numbers in a traditional price ladder, you can observe the development of liquidity through time and price.