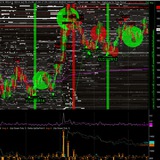
A massive new layer has been added to the machine.
The latest 3D_NEXUS_META build is not just a visual update.
It is a full structural upgrade.
The platform now goes deeper into real-time market microstructure, execution intelligence, signal filtering, data processing, bridge stability, and professional orderflow visualization.
The goal is simple:
see the book faster, understand the flow cleaner, detect regime shifts earlier, and trade with more context.
This update pushes 3D_NEXUS_META closer to a complete real-time trading cockpit.
1. New V8 Performance Foundation
The engine is now much lighter, faster, and more scalable.
A major part of the latest update is architectural.
3D_NEXUS_META now includes a V8 foundation layer designed to reduce main-thread overload and keep the visual interface responsive, even when the market becomes violent.
New Quant Worker
The Quant Engine has been moved into a dedicated worker layer.
This means heavy microstructure calculations can run outside the main visual thread.
The following components are now handled more efficiently:
• Kyle’s Lambda
• VPIN toxicity
• Hawkes clustering
• Signal modulation
• Quant regime calculation
• Toxic flow detection
• Confidence adjustment
• Cooldown modulation
This is a serious upgrade.
Instead of forcing the browser to render 3D orderflow and calculate quant metrics in the same lane, 3D_NEXUS_META now separates the brain from the eyes.
The visual engine keeps rendering.
The quant engine keeps calculating.
The machine breathes better.
2. New Data Worker Layer
WebSocket traffic is now smarter.
The latest build also introduces a Data Worker layer for local and LAN bridges.
This is designed for MT5, Sierra Chart, CQG, Rithmic, Dukascopy, cTrader, TT-style bridges, and other local feeds.
Instead of pushing all WebSocket traffic, JSON parsing, and book processing directly into the main thread, the data worker handles:
• WebSocket input
• JSON parsing
• book snapshot coalescing
• trade batching
• execution messages
• position updates
• order results
• PnL messages
• bridge status messages
The logic is brutal and clean:
book snapshots are coalesced, trades are preserved.
That matters.
Order book snapshots can arrive extremely fast, especially from local bridges. If every intermediate snapshot hits the UI, the browser wastes energy processing data that will be replaced almost instantly.
So the system keeps the latest useful book state and delivers it efficiently.
But trades are different.
Trades are events.
They carry footprint, tape, delta, replay, and signal meaning.
So trades are preserved.
No butchered tape.
No dead flow.
No fake smoothness.
3. Signal Intelligence Engine V1
Signals are no longer just detected.
They are scored, filtered, tracked, and learned from.
The new Signal Intelligence Engine, or SIE V1, is one of the biggest upgrades.
Before, a signal was mostly a detection event.
Now, a signal becomes part of a full decision loop:
detect → fire → quality gate → UI / map / voice / execution → outcome tracking → learning
This is a huge step forward.
New Signal Quality Gate
Every signal can now pass through a quality layer before it is allowed to matter.
The system blends:
• raw signal confidence
• signal type weight
• empirical win-rate adjustment
• market regime adjustment
• learned probability
• symbol context
• historical outcome behavior
This means not all signals are treated equally anymore.
A delta spike in a toxic regime is not the same as a delta spike in a dead book.
Absorption during bid support is not the same as absorption inside a liquidity vacuum.
Iceberg detection during trend continuation is not the same as iceberg detection during chop.
The Signal Intelligence Engine starts to understand that context matters.
4. Triple-Barrier Outcome Tracking
The platform now tracks what happens after a signal.
A major new concept has been added:
signals are followed forward in time.
The system tracks whether price reaches a favorable target before it hits an adverse threshold.
This is based on an ATR-normalized triple-barrier logic.
The latest 3D_NEXUS_META build is not just a visual update.
It is a full structural upgrade.
The platform now goes deeper into real-time market microstructure, execution intelligence, signal filtering, data processing, bridge stability, and professional orderflow visualization.
The goal is simple:
see the book faster, understand the flow cleaner, detect regime shifts earlier, and trade with more context.
This update pushes 3D_NEXUS_META closer to a complete real-time trading cockpit.
1. New V8 Performance Foundation
The engine is now much lighter, faster, and more scalable.
A major part of the latest update is architectural.
3D_NEXUS_META now includes a V8 foundation layer designed to reduce main-thread overload and keep the visual interface responsive, even when the market becomes violent.
New Quant Worker
The Quant Engine has been moved into a dedicated worker layer.
This means heavy microstructure calculations can run outside the main visual thread.
The following components are now handled more efficiently:
• Kyle’s Lambda
• VPIN toxicity
• Hawkes clustering
• Signal modulation
• Quant regime calculation
• Toxic flow detection
• Confidence adjustment
• Cooldown modulation
This is a serious upgrade.
Instead of forcing the browser to render 3D orderflow and calculate quant metrics in the same lane, 3D_NEXUS_META now separates the brain from the eyes.
The visual engine keeps rendering.
The quant engine keeps calculating.
The machine breathes better.
2. New Data Worker Layer
WebSocket traffic is now smarter.
The latest build also introduces a Data Worker layer for local and LAN bridges.
This is designed for MT5, Sierra Chart, CQG, Rithmic, Dukascopy, cTrader, TT-style bridges, and other local feeds.
Instead of pushing all WebSocket traffic, JSON parsing, and book processing directly into the main thread, the data worker handles:
• WebSocket input
• JSON parsing
• book snapshot coalescing
• trade batching
• execution messages
• position updates
• order results
• PnL messages
• bridge status messages
The logic is brutal and clean:
book snapshots are coalesced, trades are preserved.
That matters.
Order book snapshots can arrive extremely fast, especially from local bridges. If every intermediate snapshot hits the UI, the browser wastes energy processing data that will be replaced almost instantly.
So the system keeps the latest useful book state and delivers it efficiently.
But trades are different.
Trades are events.
They carry footprint, tape, delta, replay, and signal meaning.
So trades are preserved.
No butchered tape.
No dead flow.
No fake smoothness.
3. Signal Intelligence Engine V1
Signals are no longer just detected.
They are scored, filtered, tracked, and learned from.
The new Signal Intelligence Engine, or SIE V1, is one of the biggest upgrades.
Before, a signal was mostly a detection event.
Now, a signal becomes part of a full decision loop:
detect → fire → quality gate → UI / map / voice / execution → outcome tracking → learning
This is a huge step forward.
New Signal Quality Gate
Every signal can now pass through a quality layer before it is allowed to matter.
The system blends:
• raw signal confidence
• signal type weight
• empirical win-rate adjustment
• market regime adjustment
• learned probability
• symbol context
• historical outcome behavior
This means not all signals are treated equally anymore.
A delta spike in a toxic regime is not the same as a delta spike in a dead book.
Absorption during bid support is not the same as absorption inside a liquidity vacuum.
Iceberg detection during trend continuation is not the same as iceberg detection during chop.
The Signal Intelligence Engine starts to understand that context matters.
4. Triple-Barrier Outcome Tracking
The platform now tracks what happens after a signal.
A major new concept has been added:
signals are followed forward in time.
The system tracks whether price reaches a favorable target before it hits an adverse threshold.
This is based on an ATR-normalized triple-barrier logic.
🔥1
That is important because BTC, ES, NQ, Gold, FDAX, and other instruments do not move the same way.
A raw point move is not enough.
The signal must be judged relative to volatility.
This makes the signal evaluation cleaner across instruments.
A signal can now be studied not only by how good it looks when it appears, but by what actually happens after it appears.
That is the difference between visual noise and signal intelligence.
5. Online Learning Engine
3D_NEXUS_META now learns from its own signal history.
The new engine includes an online learning layer.
It can adapt over time using resolved signal outcomes.
The idea is powerful:
3D_NEXUS_META does not just detect.
It observes.
It tracks.
It scores.
It learns.
The learning layer can work per symbol while also using a global fallback when symbol-specific data is still limited.
This allows the system to become progressively better calibrated.
Not because of hype.
Because the signals now leave footprints inside the platform’s own memory.
6. Signal Lab UI
A new control center for signal quality.
The SCALP SIGNALS module now receives a new Signal Lab layer.
This gives the user direct control over how strict the signal engine should be.
The Signal Lab can manage:
• Signal Intelligence mode
• minimum quality threshold
• execution quality threshold
• learning horizon
• barrier-R settings
• per-signal toggles
• win-rate badges
• live stats
• reset controls
• export controls
This turns signals into a laboratory.
Not a toy panel.
Not a random alert feed.
A proper decision layer.
You can let signals pass freely.
You can run them in shadow mode.
You can make them stricter.
You can gate auto-trading.
You can let the system learn in the background.
That is a completely different level of control.
7. New V8.5 Futures Intent Engine
The platform now reads market intent more intelligently.
The V8.5 Futures Intent Engine adds a new layer designed specifically for futures-style orderflow behavior.
It brings several important concepts together:
• pipeline health
• book intent mode
• futures profiles
• regime engine
• aggressor-side normalizer
• Oracle anti-flicker guard
• pressure clock
• compact price mode
• round level awareness
• cancelled liquidity ghosts
• diagnostic export
This is not just another indicator.
It is a market behavior layer.
The engine is designed to understand whether the book is clean, balanced, distorted, compressed, unstable, inverted, or showing intent.
That matters enormously for scalpers.
Because on futures, especially NQ, ES, Gold, FDAX, and fast crypto feeds, the same visual signal can mean different things depending on the market state.
8. Book Intent Mode
Clean, Balanced, or Full.
V8.5 introduces a Book Intent logic.
Instead of treating the order book as a flat pile of numbers, the system now tries to classify how usable the book is.
The goal is to avoid reading noise as intent.
A clean book can reveal directional pressure.
A distorted book can trap weak signals.
A compressed book can create fake confidence.
A thin book can turn every aggressive order into violent displacement.
Book Intent Mode helps separate real executable structure from visual pollution.
This is exactly where 3D_NEXUS_META becomes different.
It does not only show liquidity.
It helps interpret the behavior of liquidity.
9. Futures Profiles
Different instruments need different logic.
The new V8.5 layer includes profile behavior for multiple markets.
The platform can adapt logic for:
• NQ
• ES
• GC
• FDAX
• crypto
• auto-profile behavior
That matters because NQ does not behave like BTC.
Gold does not behave like ES.
FDAX does not breathe like Ethereum.
Each instrument has different depth, tick behavior, aggression rhythm, reload behavior, and spoof density.
3D_NEXUS_META is moving toward instrument-aware orderflow intelligence.
Not generic one-size-fits-all signal spam.
10. Aggressor-Side Normalizer
The system can now defend itself against inverted flow logic.
Some bridges, brokers, exchanges, or data adapters can interpret aggressor side differently.
That can break delta logic.
A raw point move is not enough.
The signal must be judged relative to volatility.
This makes the signal evaluation cleaner across instruments.
A signal can now be studied not only by how good it looks when it appears, but by what actually happens after it appears.
That is the difference between visual noise and signal intelligence.
5. Online Learning Engine
3D_NEXUS_META now learns from its own signal history.
The new engine includes an online learning layer.
It can adapt over time using resolved signal outcomes.
The idea is powerful:
3D_NEXUS_META does not just detect.
It observes.
It tracks.
It scores.
It learns.
The learning layer can work per symbol while also using a global fallback when symbol-specific data is still limited.
This allows the system to become progressively better calibrated.
Not because of hype.
Because the signals now leave footprints inside the platform’s own memory.
6. Signal Lab UI
A new control center for signal quality.
The SCALP SIGNALS module now receives a new Signal Lab layer.
This gives the user direct control over how strict the signal engine should be.
The Signal Lab can manage:
• Signal Intelligence mode
• minimum quality threshold
• execution quality threshold
• learning horizon
• barrier-R settings
• per-signal toggles
• win-rate badges
• live stats
• reset controls
• export controls
This turns signals into a laboratory.
Not a toy panel.
Not a random alert feed.
A proper decision layer.
You can let signals pass freely.
You can run them in shadow mode.
You can make them stricter.
You can gate auto-trading.
You can let the system learn in the background.
That is a completely different level of control.
7. New V8.5 Futures Intent Engine
The platform now reads market intent more intelligently.
The V8.5 Futures Intent Engine adds a new layer designed specifically for futures-style orderflow behavior.
It brings several important concepts together:
• pipeline health
• book intent mode
• futures profiles
• regime engine
• aggressor-side normalizer
• Oracle anti-flicker guard
• pressure clock
• compact price mode
• round level awareness
• cancelled liquidity ghosts
• diagnostic export
This is not just another indicator.
It is a market behavior layer.
The engine is designed to understand whether the book is clean, balanced, distorted, compressed, unstable, inverted, or showing intent.
That matters enormously for scalpers.
Because on futures, especially NQ, ES, Gold, FDAX, and fast crypto feeds, the same visual signal can mean different things depending on the market state.
8. Book Intent Mode
Clean, Balanced, or Full.
V8.5 introduces a Book Intent logic.
Instead of treating the order book as a flat pile of numbers, the system now tries to classify how usable the book is.
The goal is to avoid reading noise as intent.
A clean book can reveal directional pressure.
A distorted book can trap weak signals.
A compressed book can create fake confidence.
A thin book can turn every aggressive order into violent displacement.
Book Intent Mode helps separate real executable structure from visual pollution.
This is exactly where 3D_NEXUS_META becomes different.
It does not only show liquidity.
It helps interpret the behavior of liquidity.
9. Futures Profiles
Different instruments need different logic.
The new V8.5 layer includes profile behavior for multiple markets.
The platform can adapt logic for:
• NQ
• ES
• GC
• FDAX
• crypto
• auto-profile behavior
That matters because NQ does not behave like BTC.
Gold does not behave like ES.
FDAX does not breathe like Ethereum.
Each instrument has different depth, tick behavior, aggression rhythm, reload behavior, and spoof density.
3D_NEXUS_META is moving toward instrument-aware orderflow intelligence.
Not generic one-size-fits-all signal spam.
10. Aggressor-Side Normalizer
The system can now defend itself against inverted flow logic.
Some bridges, brokers, exchanges, or data adapters can interpret aggressor side differently.
That can break delta logic.
🔥1
It can invert the meaning of buy and sell pressure.
The V8.5 update adds an aggressor-side normalization layer with modes such as normal, inverted, and auto.
This is an important technical safety layer.
Because if the aggressor side is wrong, the signal engine becomes poisoned.
With normalization, 3D_NEXUS_META becomes more robust across feeds.
11. Oracle Anti-Flicker and Signal Guard
Less nervous noise. More stable intent.
Fast orderflow can generate flickering signals.
One moment the book looks bullish.
A few milliseconds later it looks neutral.
Then bearish.
Then bullish again.
That creates weak alerts and visual instability.
The new V8.5 Signal Guard and Oracle Anti-Flicker layer are designed to reduce that problem.
The goal is not to make the system slower.
The goal is to stop micro-noise from pretending to be conviction.
Cleaner alerts.
Less flicker.
More stable signal behavior.
Better trader focus.
12. Pressure Clock
Timing pressure becomes visible.
The new pressure clock concept adds timing logic to market pressure.
It is not enough to know that pressure exists.
You need to know if pressure is building, fading, rotating, or becoming unstable.
The Pressure Clock helps create a more temporal read of the orderflow.
It turns pressure into a sequence.
Not just a snapshot.
For scalpers, that is vital.
Because the difference between early and late is often only a few seconds.
13. Cancelled Liquidity Ghosts
Pulled liquidity now leaves a memory.
One of the most important new concepts is ghost liquidity.
When liquidity disappears from the book, it matters.
A pulled wall is not nothing.
It is information.
A cancelled ask wall above price can mean the offer side stopped defending.
A cancelled bid wall below price can expose a sudden liquidity vacuum.
V8.5 adds cancelled liquidity ghosts so the platform can remember recently removed liquidity.
That is huge for spoofing, layering, fake defense, and liquidity trap analysis.
The book is no longer just what exists now.
It also carries memory of what just vanished.
That is where orderflow becomes forensic.
14. MT5 Signal Export
3D_NEXUS_META signals can now reach MT5.
A new MT5 signal export layer has been added.
It mirrors 3D_NEXUS_META signals, Oracle events, and Swarm events toward the MT5 bridge.
The bridge can write a dedicated signal file, allowing a MetaTrader overlay indicator to print Nexus events directly on the MT5 chart.
This is very important for traders who use MT5 as their execution or analysis terminal.
Now 3D_NEXUS_META can act as the orderflow intelligence engine while MT5 displays the signal layer visually on the chart.
The workflow becomes much stronger:
3D_NEXUS_META reads the market microstructure.
MT5 receives the signal footprint.
The trader sees both the flow and the chart context.
15. Sierra Chart Integration
Sierra Chart support has grown massively.
The build includes Sierra Chart bridge upgrades for both data and execution workflows.
The Sierra Chart DTC bridge layer can route:
• L2 DOM / order book
• trades
• footprint data
• Time & Sales
• delta
• signals
• order execution
• market orders
• limit orders
• stop orders
• position management
• close / close all
• auto-trade signal routing
This is a major professional bridge.
It turns Sierra Chart into a serious data and execution companion for 3D_NEXUS_META.
The idea is simple:
Sierra Chart provides institutional-grade futures connectivity.
3D_NEXUS_META transforms that flow into a 3D microstructure environment.
Together, they create a powerful futures trading cockpit.
16. Sierra Chart Execution V4.3
Token-auth execution and auto-trading unlock.
A separate Sierra Chart execution patch has also been added.
This layer improves the HTML-side routing for:
• token authentication
• BUY / SELL execution
• CLOSE commands
• auto-trade from signals
• WebSocket message handling
• execution readiness checks
• virtual TP/SL monitoring
This makes the EXECUTE panel more useful and more production-oriented.
The goal is not only to see the market.
The goal is to act from inside the same environment.
The V8.5 update adds an aggressor-side normalization layer with modes such as normal, inverted, and auto.
This is an important technical safety layer.
Because if the aggressor side is wrong, the signal engine becomes poisoned.
With normalization, 3D_NEXUS_META becomes more robust across feeds.
11. Oracle Anti-Flicker and Signal Guard
Less nervous noise. More stable intent.
Fast orderflow can generate flickering signals.
One moment the book looks bullish.
A few milliseconds later it looks neutral.
Then bearish.
Then bullish again.
That creates weak alerts and visual instability.
The new V8.5 Signal Guard and Oracle Anti-Flicker layer are designed to reduce that problem.
The goal is not to make the system slower.
The goal is to stop micro-noise from pretending to be conviction.
Cleaner alerts.
Less flicker.
More stable signal behavior.
Better trader focus.
12. Pressure Clock
Timing pressure becomes visible.
The new pressure clock concept adds timing logic to market pressure.
It is not enough to know that pressure exists.
You need to know if pressure is building, fading, rotating, or becoming unstable.
The Pressure Clock helps create a more temporal read of the orderflow.
It turns pressure into a sequence.
Not just a snapshot.
For scalpers, that is vital.
Because the difference between early and late is often only a few seconds.
13. Cancelled Liquidity Ghosts
Pulled liquidity now leaves a memory.
One of the most important new concepts is ghost liquidity.
When liquidity disappears from the book, it matters.
A pulled wall is not nothing.
It is information.
A cancelled ask wall above price can mean the offer side stopped defending.
A cancelled bid wall below price can expose a sudden liquidity vacuum.
V8.5 adds cancelled liquidity ghosts so the platform can remember recently removed liquidity.
That is huge for spoofing, layering, fake defense, and liquidity trap analysis.
The book is no longer just what exists now.
It also carries memory of what just vanished.
That is where orderflow becomes forensic.
14. MT5 Signal Export
3D_NEXUS_META signals can now reach MT5.
A new MT5 signal export layer has been added.
It mirrors 3D_NEXUS_META signals, Oracle events, and Swarm events toward the MT5 bridge.
The bridge can write a dedicated signal file, allowing a MetaTrader overlay indicator to print Nexus events directly on the MT5 chart.
This is very important for traders who use MT5 as their execution or analysis terminal.
Now 3D_NEXUS_META can act as the orderflow intelligence engine while MT5 displays the signal layer visually on the chart.
The workflow becomes much stronger:
3D_NEXUS_META reads the market microstructure.
MT5 receives the signal footprint.
The trader sees both the flow and the chart context.
15. Sierra Chart Integration
Sierra Chart support has grown massively.
The build includes Sierra Chart bridge upgrades for both data and execution workflows.
The Sierra Chart DTC bridge layer can route:
• L2 DOM / order book
• trades
• footprint data
• Time & Sales
• delta
• signals
• order execution
• market orders
• limit orders
• stop orders
• position management
• close / close all
• auto-trade signal routing
This is a major professional bridge.
It turns Sierra Chart into a serious data and execution companion for 3D_NEXUS_META.
The idea is simple:
Sierra Chart provides institutional-grade futures connectivity.
3D_NEXUS_META transforms that flow into a 3D microstructure environment.
Together, they create a powerful futures trading cockpit.
16. Sierra Chart Execution V4.3
Token-auth execution and auto-trading unlock.
A separate Sierra Chart execution patch has also been added.
This layer improves the HTML-side routing for:
• token authentication
• BUY / SELL execution
• CLOSE commands
• auto-trade from signals
• WebSocket message handling
• execution readiness checks
• virtual TP/SL monitoring
This makes the EXECUTE panel more useful and more production-oriented.
The goal is not only to see the market.
The goal is to act from inside the same environment.
🔥1
17. CQG WebAPI Bridge V1.6 Hard Isolation
CQG now has its own protected feed mode.
The CQG integration has been strengthened with hard isolation.
When CQG is active, the platform quarantines other feeds such as Binance Spot or Binance Perps to avoid cross-feed contamination.
This is important.
You do not want a futures depth surface polluted by leftover crypto data.
The CQG layer adds:
• CQG exchange option
• CQG symbol pool
• local bridge configuration
• safe symbol handling
• tick-size defaults
• exclusive active mode
• watchdog logic
• Binance quarantine
• bridge reconnect logic
• clean CQG status feedback
This is a professional stability upgrade.
CQG owns the book when CQG is selected.
No ghosts from another feed.
No dirty surface.
No feed spaghetti.
18. Volume Profile 3D
Session volume becomes part of the 3D world.
A new 3D Volume Profile has been added.
It displays session-accumulated volume as horizontal bars next to the orderflow surface.
It also includes VPOC, the Volume Point of Control, highlighted with a laser-style line.
This adds a new structural read:
• where volume accumulated
• where buy volume dominated
• where sell volume dominated
• where the session’s main volume node is located
• where price may react again
This turns the surface into more than live depth.
It becomes a hybrid between live order book, execution map, and session volume structure.
19. Trade Velocity Heatmap
The speed of tape is now visible.
The update also adds a Trade Velocity Heatmap.
This displays the speed of tape as a color band at the front of the surface.
The faster the tape, the more intense the heatmap becomes.
This is valuable for detecting:
• sudden execution bursts
• HFT acceleration
• tape bombs
• abnormal activity
• impulse phases
• panic flow
• breakout ignition
• absorption under stress
The platform now does not only show where the liquidity is.
It also shows how violently the market is trading into it.
That is a huge distinction.
20. Trade-Based Price Line
The price line now follows real trades.
A major visual fix has been implemented:
the price line can now connect actual trade bubbles chronologically instead of relying only on mid-price averaging.
That makes the visual read much more honest.
Mid-price can be clean, but trades are the actual executed story.
A trade-based price line shows where real execution happened.
It gives the 3D surface more tape truth.
The platform becomes closer to a living execution trail.
Not a synthetic chart floating above the book.
21. Better Trade Bubbles and Size Labels
Execution is now easier to read.
The latest patches improve how trade bubbles and size labels behave.
New improvements include:
• bubble scale controls
• trade size displayed inside bubbles
• front-row depth size labels
• persistent depth labels
• better bubble-to-surface sync
• improved lifecycle behavior
• less visual loss during active trading
The result is a clearer 3D read.
Large prints become easier to identify.
Depth walls become easier to interpret.
The relationship between trades and liquidity becomes more obvious.
This is exactly what 3D_NEXUS_META should do:
make the invisible market visible.
22. Enhanced 2D Heatmap Overlay
The Bookmap-style layer has evolved.
The 2D heatmap overlay has been improved with a more usable WALL2 / Bookmap-style visualization.
This includes:
• price line
• trade dots
• price scale
• heatmap texture logic
• better visual anchoring
• clearer front-facing map behavior
This gives users a powerful bridge between classic heatmap reading and 3D orderflow.
Some traders want the full 3D battlefield.
Others want a more direct Bookmap-style view.
Now both are stronger.
23. Footprint Mode Improvements
Footprint is becoming more usable and more expressive.
The code includes footprint-related upgrades, including footprint scale controls and mirrored liquidity labels.
This reinforces the core goal:
combine depth, prints, delta, and liquidity behavior into one unified visual language.
3D_NEXUS_META is not just a DOM.
Not just a heatmap.
Not just a footprint.
It is a microstructure fusion engine.
CQG now has its own protected feed mode.
The CQG integration has been strengthened with hard isolation.
When CQG is active, the platform quarantines other feeds such as Binance Spot or Binance Perps to avoid cross-feed contamination.
This is important.
You do not want a futures depth surface polluted by leftover crypto data.
The CQG layer adds:
• CQG exchange option
• CQG symbol pool
• local bridge configuration
• safe symbol handling
• tick-size defaults
• exclusive active mode
• watchdog logic
• Binance quarantine
• bridge reconnect logic
• clean CQG status feedback
This is a professional stability upgrade.
CQG owns the book when CQG is selected.
No ghosts from another feed.
No dirty surface.
No feed spaghetti.
18. Volume Profile 3D
Session volume becomes part of the 3D world.
A new 3D Volume Profile has been added.
It displays session-accumulated volume as horizontal bars next to the orderflow surface.
It also includes VPOC, the Volume Point of Control, highlighted with a laser-style line.
This adds a new structural read:
• where volume accumulated
• where buy volume dominated
• where sell volume dominated
• where the session’s main volume node is located
• where price may react again
This turns the surface into more than live depth.
It becomes a hybrid between live order book, execution map, and session volume structure.
19. Trade Velocity Heatmap
The speed of tape is now visible.
The update also adds a Trade Velocity Heatmap.
This displays the speed of tape as a color band at the front of the surface.
The faster the tape, the more intense the heatmap becomes.
This is valuable for detecting:
• sudden execution bursts
• HFT acceleration
• tape bombs
• abnormal activity
• impulse phases
• panic flow
• breakout ignition
• absorption under stress
The platform now does not only show where the liquidity is.
It also shows how violently the market is trading into it.
That is a huge distinction.
20. Trade-Based Price Line
The price line now follows real trades.
A major visual fix has been implemented:
the price line can now connect actual trade bubbles chronologically instead of relying only on mid-price averaging.
That makes the visual read much more honest.
Mid-price can be clean, but trades are the actual executed story.
A trade-based price line shows where real execution happened.
It gives the 3D surface more tape truth.
The platform becomes closer to a living execution trail.
Not a synthetic chart floating above the book.
21. Better Trade Bubbles and Size Labels
Execution is now easier to read.
The latest patches improve how trade bubbles and size labels behave.
New improvements include:
• bubble scale controls
• trade size displayed inside bubbles
• front-row depth size labels
• persistent depth labels
• better bubble-to-surface sync
• improved lifecycle behavior
• less visual loss during active trading
The result is a clearer 3D read.
Large prints become easier to identify.
Depth walls become easier to interpret.
The relationship between trades and liquidity becomes more obvious.
This is exactly what 3D_NEXUS_META should do:
make the invisible market visible.
22. Enhanced 2D Heatmap Overlay
The Bookmap-style layer has evolved.
The 2D heatmap overlay has been improved with a more usable WALL2 / Bookmap-style visualization.
This includes:
• price line
• trade dots
• price scale
• heatmap texture logic
• better visual anchoring
• clearer front-facing map behavior
This gives users a powerful bridge between classic heatmap reading and 3D orderflow.
Some traders want the full 3D battlefield.
Others want a more direct Bookmap-style view.
Now both are stronger.
23. Footprint Mode Improvements
Footprint is becoming more usable and more expressive.
The code includes footprint-related upgrades, including footprint scale controls and mirrored liquidity labels.
This reinforces the core goal:
combine depth, prints, delta, and liquidity behavior into one unified visual language.
3D_NEXUS_META is not just a DOM.
Not just a heatmap.
Not just a footprint.
It is a microstructure fusion engine.
24. Smart Signal Density Filter
Signal noise is now more controllable.
A Smart Signal Filter has been added.
It lets the user control signal density with profiles like more signals, balanced signals, or fewer signals.
This is important because not every trader wants the same signal frequency.
A scalper in high-speed mode may want more alerts.
A more selective trader may want fewer, higher-quality signals.
The new density logic can adjust:
• thresholds
• cooldown behavior
• pattern strictness
• imbalance requirements
• range sensitivity
This is a strong usability upgrade.
The trader can now tune the aggressiveness of the signal engine.
Not every session needs the same signal sensitivity.
25. Oracle and Swarm Export
Intelligence can now be saved and reused.
The update adds export options for Oracle and Swarm outputs.
That means the analysis layer can become a research layer.
You can export what the system saw.
You can study it later.
You can compare it with price action.
You can refine strategy logic.
You can build content, reports, training material, or post-session reviews.
This is not just trading.
This is signal forensics.
26. Panel Organizer and Anti-Overlap System
The interface is cleaner and less chaotic.
The UI now includes a panel organizer layer with sidebar control and anti-overlap logic.
That matters because 3D_NEXUS_META has become extremely dense.
There are many panels:
• controls
• signals
• Oracle
• Swarm
• execution
• Time & Sales
• heatmap
• quant metrics
• API keys
• delta gauge
• bridge modules
Without organization, the cockpit becomes a jungle.
The new organizer helps show, hide, clamp, and manage panels more cleanly.
Less screen chaos.
More cockpit discipline.
27. New Visual Theme System
3D_NEXUS_META can change personality.
A template switcher has been added with multiple visual styles:
• Nexus Cyber
• Terminal Pro
• Aurora Deep
This is more than cosmetic.
Different traders want different environments.
Some want neon cyberpunk.
Some want a darker professional terminal.
Some want something more elegant and atmospheric.
3D_NEXUS_META is becoming customizable not only as a tool, but as a trading environment.
28. Expanded Bridge and Market Universe
3D_NEXUS_META is becoming multi-market by design.
The code now includes or references multiple bridge and exchange layers, expanding the potential coverage of the platform.
Recent additions and patches include:
• MT5 bridge
• Sierra Chart bridge
• Sierra Chart execution
• CQG bridge
• Rithmic futures bridge
• Hyperliquid execution bridge
• Polymarket CLOB integration
• Dukascopy JForex bridge
• FXCM integration
• Bitget REST polling fix
• Kraken Spot support
• dYdX v4 support
• Aster DEX support
• Crypto.com support
• Deribit perps and options
• Binance RWA token patch
• Tradovate futures data patch
This is a major direction.
3D_NEXUS_META is no longer only a crypto visualization tool.
It is becoming a cross-market microstructure platform.
Crypto.
Futures.
FX.
CFDs.
Prediction markets.
RWA tokens.
DEX flows.
Execution bridges.
The universe is expanding.
29. Hyperliquid Execution Bridge
Direct order routing for Hyperliquid-style workflows.
A Hyperliquid execution bridge has been added for execution routing.
It supports:
• manual BUY / SELL
• auto-trading from signals
• market orders
• limit orders
• TP/SL in ticks
• close all
• position requests
• HIP-3 TradFi symbols
This is another step toward making 3D_NEXUS_META not only a visualization layer, but a command layer.
See the flow.
Detect the setup.
Route the execution.
All from one cockpit.
30. Polymarket CLOB Integration
Prediction markets enter the 3D world.
The platform now includes a Polymarket CLOB integration layer.
This allows prediction market order books to be visualized inside the same 3D logic.
Instead of classic price levels, prediction markets can be read as probability markets.
YES bids.
YES asks.
CLOB execution.
Trade bubbles.
Probability depth.
This opens a new frontier.
3D_NEXUS_META can visualize not only financial instruments, but also event probability markets.
That is rare.
Signal noise is now more controllable.
A Smart Signal Filter has been added.
It lets the user control signal density with profiles like more signals, balanced signals, or fewer signals.
This is important because not every trader wants the same signal frequency.
A scalper in high-speed mode may want more alerts.
A more selective trader may want fewer, higher-quality signals.
The new density logic can adjust:
• thresholds
• cooldown behavior
• pattern strictness
• imbalance requirements
• range sensitivity
This is a strong usability upgrade.
The trader can now tune the aggressiveness of the signal engine.
Not every session needs the same signal sensitivity.
25. Oracle and Swarm Export
Intelligence can now be saved and reused.
The update adds export options for Oracle and Swarm outputs.
That means the analysis layer can become a research layer.
You can export what the system saw.
You can study it later.
You can compare it with price action.
You can refine strategy logic.
You can build content, reports, training material, or post-session reviews.
This is not just trading.
This is signal forensics.
26. Panel Organizer and Anti-Overlap System
The interface is cleaner and less chaotic.
The UI now includes a panel organizer layer with sidebar control and anti-overlap logic.
That matters because 3D_NEXUS_META has become extremely dense.
There are many panels:
• controls
• signals
• Oracle
• Swarm
• execution
• Time & Sales
• heatmap
• quant metrics
• API keys
• delta gauge
• bridge modules
Without organization, the cockpit becomes a jungle.
The new organizer helps show, hide, clamp, and manage panels more cleanly.
Less screen chaos.
More cockpit discipline.
27. New Visual Theme System
3D_NEXUS_META can change personality.
A template switcher has been added with multiple visual styles:
• Nexus Cyber
• Terminal Pro
• Aurora Deep
This is more than cosmetic.
Different traders want different environments.
Some want neon cyberpunk.
Some want a darker professional terminal.
Some want something more elegant and atmospheric.
3D_NEXUS_META is becoming customizable not only as a tool, but as a trading environment.
28. Expanded Bridge and Market Universe
3D_NEXUS_META is becoming multi-market by design.
The code now includes or references multiple bridge and exchange layers, expanding the potential coverage of the platform.
Recent additions and patches include:
• MT5 bridge
• Sierra Chart bridge
• Sierra Chart execution
• CQG bridge
• Rithmic futures bridge
• Hyperliquid execution bridge
• Polymarket CLOB integration
• Dukascopy JForex bridge
• FXCM integration
• Bitget REST polling fix
• Kraken Spot support
• dYdX v4 support
• Aster DEX support
• Crypto.com support
• Deribit perps and options
• Binance RWA token patch
• Tradovate futures data patch
This is a major direction.
3D_NEXUS_META is no longer only a crypto visualization tool.
It is becoming a cross-market microstructure platform.
Crypto.
Futures.
FX.
CFDs.
Prediction markets.
RWA tokens.
DEX flows.
Execution bridges.
The universe is expanding.
29. Hyperliquid Execution Bridge
Direct order routing for Hyperliquid-style workflows.
A Hyperliquid execution bridge has been added for execution routing.
It supports:
• manual BUY / SELL
• auto-trading from signals
• market orders
• limit orders
• TP/SL in ticks
• close all
• position requests
• HIP-3 TradFi symbols
This is another step toward making 3D_NEXUS_META not only a visualization layer, but a command layer.
See the flow.
Detect the setup.
Route the execution.
All from one cockpit.
30. Polymarket CLOB Integration
Prediction markets enter the 3D world.
The platform now includes a Polymarket CLOB integration layer.
This allows prediction market order books to be visualized inside the same 3D logic.
Instead of classic price levels, prediction markets can be read as probability markets.
YES bids.
YES asks.
CLOB execution.
Trade bubbles.
Probability depth.
This opens a new frontier.
3D_NEXUS_META can visualize not only financial instruments, but also event probability markets.
That is rare.
🔥1
And very powerful.
31. Stronger Execution Finalization
Better handling of closures, PnL, retries, and TP/SL.
Execution-side fixes were also added.
These improve practical trading behavior after an order is opened or closed.
The update includes logic around:
• closure detection
• bridge PnL requests
• local fallback if bridge PnL fails
• manual close requests
• SL/TP retry logic
• execution message handling
• open-position state repair
This is the kind of update traders actually feel.
Not flashy.
But critical.
Because in trading, the ugly edge cases matter.
A beautiful interface is useless if execution state becomes confused.
This patch makes the execution layer more battle-ready.
32. Cleaner Stability and Recovery Logic
Less fragility. More self-healing.
Several recent patches focus on stability:
• worker fallback
• bridge reconnect handling
• feed isolation
• cleanup on exchange switch
• symbol sanitization
• partial-freeze watchdog
• auto-repair logic
• safe mode behavior
• dedupe logic
• signal cooldowns
• guarded wrappers
This is the boring part that makes the sexy part possible.
Real-time market software cannot just look good.
It has to survive ugly feeds, broken sockets, browser limits, wrong symbols, stale state, and aggressive data bursts.
The recent updates clearly push 3D_NEXUS_META toward a more resilient architecture.
Final Summary
3D_NEXUS_META is becoming a full microstructure intelligence cockpit.
The latest updates transform the platform in five major ways:
1. Faster core architecture
With Quant Worker and Data Worker layers.
2. Smarter signals
With Signal Intelligence Engine, quality gates, learning, and outcome tracking.
3. Better futures logic
With V8.5 Futures Intent, Book Intent Mode, Pressure Clock, and cancelled liquidity ghosts.
4. Deeper visualization
With 3D Volume Profile, trade velocity heatmap, persistent labels, trade-based price line, and enhanced 2D heatmap.
5. Stronger connectivity
With MT5, Sierra Chart, CQG, Hyperliquid, Polymarket, Dukascopy, Rithmic, FXCM, Deribit, Tradovate, Kraken, dYdX, Bitget, and more.
This is not a simple update.
This is a transformation.
3D_NEXUS_META is moving from visual orderflow tool to multi-market, signal-aware, execution-capable, microstructure intelligence platform.
See the book.
See the flow.
See the regime shift.
See the execution.
See the market before the candle explains it too late.
3D_NEXUS_META is no longer just watching price.
It is reading the machine behind price.
31. Stronger Execution Finalization
Better handling of closures, PnL, retries, and TP/SL.
Execution-side fixes were also added.
These improve practical trading behavior after an order is opened or closed.
The update includes logic around:
• closure detection
• bridge PnL requests
• local fallback if bridge PnL fails
• manual close requests
• SL/TP retry logic
• execution message handling
• open-position state repair
This is the kind of update traders actually feel.
Not flashy.
But critical.
Because in trading, the ugly edge cases matter.
A beautiful interface is useless if execution state becomes confused.
This patch makes the execution layer more battle-ready.
32. Cleaner Stability and Recovery Logic
Less fragility. More self-healing.
Several recent patches focus on stability:
• worker fallback
• bridge reconnect handling
• feed isolation
• cleanup on exchange switch
• symbol sanitization
• partial-freeze watchdog
• auto-repair logic
• safe mode behavior
• dedupe logic
• signal cooldowns
• guarded wrappers
This is the boring part that makes the sexy part possible.
Real-time market software cannot just look good.
It has to survive ugly feeds, broken sockets, browser limits, wrong symbols, stale state, and aggressive data bursts.
The recent updates clearly push 3D_NEXUS_META toward a more resilient architecture.
Final Summary
3D_NEXUS_META is becoming a full microstructure intelligence cockpit.
The latest updates transform the platform in five major ways:
1. Faster core architecture
With Quant Worker and Data Worker layers.
2. Smarter signals
With Signal Intelligence Engine, quality gates, learning, and outcome tracking.
3. Better futures logic
With V8.5 Futures Intent, Book Intent Mode, Pressure Clock, and cancelled liquidity ghosts.
4. Deeper visualization
With 3D Volume Profile, trade velocity heatmap, persistent labels, trade-based price line, and enhanced 2D heatmap.
5. Stronger connectivity
With MT5, Sierra Chart, CQG, Hyperliquid, Polymarket, Dukascopy, Rithmic, FXCM, Deribit, Tradovate, Kraken, dYdX, Bitget, and more.
This is not a simple update.
This is a transformation.
3D_NEXUS_META is moving from visual orderflow tool to multi-market, signal-aware, execution-capable, microstructure intelligence platform.
See the book.
See the flow.
See the regime shift.
See the execution.
See the market before the candle explains it too late.
3D_NEXUS_META is no longer just watching price.
It is reading the machine behind price.
Crypto.com
Crypto.com Nederland: Veilig Bitcoin, Ethereum en meer dan 400 cryptovaluta kopen, verkopen en verhandelen
Koop, verkoop, bewaar en verhandel meer dan 400+ cryptovaluta op Crypto.com, een veilig en vertrouwd handelsplatform in Nederland.
🔥1
🚨 PRIVATE ORDER FLOW BREAKDOWN
HOW TO RECOGNIZE A PREDATORY HFT BID ATTACK
Real-time case study on SpaceX
Instrument: SPCXUSDT
Visualized through 3D_NEXUS_META
Guys, this is a sequence you need to study carefully.
The screenshots and video captured on SPCXUSDT show an exceptionally clear example of what a predatory-style HFT pressure event can look like inside the order book.
The setup develops directly beneath an important resistance zone.
A massive bid-side liquidity structure suddenly appears, absorbs incoming market sells, repeatedly reloads, follows price upward and remains active until resistance finally breaks.
Then the structure disappears.
This is not simply:
This is a complete microstructure sequence:
🔹 Sudden liquidity deployment
🔹 Multi-level clustering
🔹 Sell-side absorption
🔹 Aggressive replenishment
🔹 Upward liquidity ratcheting
🔹 Breakout pressure
🔹 Tactical disappearance
DEPLOYMENT → ABSORPTION → RELOAD → PRESSURE → BREAKOUT
🧠 THE CORE IDEA
A predatory-style HFT does not always push price higher by aggressively buying with market orders.
It can influence the auction from underneath.
Instead of chasing the ask, the algorithm deploys large resting buy orders near the best bid.
These orders create a liquidity floor beneath the market.
When sellers hit that floor, the liquidity absorbs them.
When the displayed size is consumed, it reloads.
When price moves upward, the bid cluster moves upward too.
The HFT is effectively building a moving support platform beneath price.
Think of it as:
A hydraulic jack made of limit orders.
⚠️ 7 THINGS THAT SHOULD IMMEDIATELY ATTRACT YOUR ATTENTION
1️⃣ THE LIQUIDITY APPEARS SUDDENLY
The first signal is speed.
The large orders are not resting inside the book for several minutes.
They appear almost instantly, close to the current traded price.
The bid-side structure changes in a fraction of a second.
An ordinary order book suddenly becomes dominated by enormous liquidity columns.
This abrupt transformation is the first footprint.
2️⃣ THE DISPLAYED SIZE IS ABNORMAL
The HFT does not place one slightly larger order.
It deploys quantities that are massive compared with the surrounding depth.
The important factor is not simply the absolute quantity.
It is the quantity relative to:
• Nearby orders
• Average displayed depth
• Recent book activity
• Normal order size
• Current liquidity conditions
Inside 3D_NEXUS_META, this becomes visually obvious.
Normal liquidity appears as relatively small structures.
The suspected HFT orders become giant vertical towers that dominate the local order book.
3️⃣ THE ORDERS FORM A MULTI-LEVEL CLUSTER
The liquidity is not concentrated at one exact price.
It is spread across several adjacent bid levels:
• Best bid
• One tick below
• Two ticks below
• Additional support levels underneath
This creates a defensive liquidity zone.
A single large bid can be consumed.
A multi-level cluster forces aggressive sellers to cross several consecutive barriers.
HOW TO RECOGNIZE A PREDATORY HFT BID ATTACK
Real-time case study on SpaceX
Instrument: SPCXUSDT
Visualized through 3D_NEXUS_META
Guys, this is a sequence you need to study carefully.
The screenshots and video captured on SPCXUSDT show an exceptionally clear example of what a predatory-style HFT pressure event can look like inside the order book.
The setup develops directly beneath an important resistance zone.
A massive bid-side liquidity structure suddenly appears, absorbs incoming market sells, repeatedly reloads, follows price upward and remains active until resistance finally breaks.
Then the structure disappears.
This is not simply:
“A large buyer entered the market.”
This is a complete microstructure sequence:
🔹 Sudden liquidity deployment
🔹 Multi-level clustering
🔹 Sell-side absorption
🔹 Aggressive replenishment
🔹 Upward liquidity ratcheting
🔹 Breakout pressure
🔹 Tactical disappearance
DEPLOYMENT → ABSORPTION → RELOAD → PRESSURE → BREAKOUT
🧠 THE CORE IDEA
A predatory-style HFT does not always push price higher by aggressively buying with market orders.
It can influence the auction from underneath.
Instead of chasing the ask, the algorithm deploys large resting buy orders near the best bid.
These orders create a liquidity floor beneath the market.
When sellers hit that floor, the liquidity absorbs them.
When the displayed size is consumed, it reloads.
When price moves upward, the bid cluster moves upward too.
The HFT is effectively building a moving support platform beneath price.
Sellers hit the bid.
The bid refuses to disappear.
Lower prices are tested.
The liquidity survives.
Sellers lose control.
Price advances toward resistance.
Think of it as:
A hydraulic jack made of limit orders.
⚠️ 7 THINGS THAT SHOULD IMMEDIATELY ATTRACT YOUR ATTENTION
1️⃣ THE LIQUIDITY APPEARS SUDDENLY
The first signal is speed.
The large orders are not resting inside the book for several minutes.
They appear almost instantly, close to the current traded price.
The bid-side structure changes in a fraction of a second.
An ordinary order book suddenly becomes dominated by enormous liquidity columns.
This abrupt transformation is the first footprint.
2️⃣ THE DISPLAYED SIZE IS ABNORMAL
The HFT does not place one slightly larger order.
It deploys quantities that are massive compared with the surrounding depth.
The important factor is not simply the absolute quantity.
It is the quantity relative to:
• Nearby orders
• Average displayed depth
• Recent book activity
• Normal order size
• Current liquidity conditions
Inside 3D_NEXUS_META, this becomes visually obvious.
Normal liquidity appears as relatively small structures.
The suspected HFT orders become giant vertical towers that dominate the local order book.
3️⃣ THE ORDERS FORM A MULTI-LEVEL CLUSTER
The liquidity is not concentrated at one exact price.
It is spread across several adjacent bid levels:
• Best bid
• One tick below
• Two ticks below
• Additional support levels underneath
This creates a defensive liquidity zone.
A single large bid can be consumed.
A multi-level cluster forces aggressive sellers to cross several consecutive barriers.
One large bid is an order.
Several synchronized large bids are a structure.
🔥1
4️⃣ THE CLUSTER STAYS CLOSE TO THE BEST BID
The large orders remain directly beneath the traded price.
This is critical.
They are not sitting far away from the active market.
They are positioned where market sellers are forced to interact with them.
That proximity gives the cluster influence over:
• Short-term imbalance
• Queue behavior
• Execution probability
• Perceived support
• Market-order routing
• Other automated strategies
• Breakout expectations
The liquidity appears executable, credible and strategically positioned.
5️⃣ THE ORDERS RELOAD WHEN THEY ARE HIT
This is the most important test.
Large size alone proves very little.
What matters is how the liquidity behaves when sellers attack it.
In this sequence, market sell orders begin hitting the bid.
The displayed quantity declines.
Then it returns.
The structure is hit again.
It reloads again.
HIT → REDUCE → RELOAD → HIT AGAIN → RELOAD AGAIN
This behavior may be associated with:
• Iceberg execution
• Hidden reserve quantity
• Rapid cancel-and-replace logic
• Coordinated child orders
• Queue-management algorithms
• Adaptive liquidity replenishment
A static wall is only a screenshot.
A wall that rebuilds itself is a process.
6️⃣ THE CLUSTER FOLLOWS PRICE UPWARD
As SPCXUSDT begins to rise, the liquidity does not remain at its original level.
The HFT raises the bid structure.
It cancels lower support and recreates it closer to the active market.
The cluster sticks to price.
This is the ratcheting mechanism:
Establish support
Absorb market sellers
Allow price to advance
Cancel obsolete lower orders
Rebuild the structure higher
Repeat
The algorithm is no longer defending one fixed price.
It is defending the direction of the move.
7️⃣ THE EVENT OCCURS BELOW RESISTANCE
Context gives the structure meaning.
The liquidity appears directly beneath an important resistance zone.
That is where strong bid support can become tactically useful.
The algorithm may be attempting to:
• Prevent downside continuation
• Absorb available sellers
• Exhaust short-term bears
• Trigger short covering
• Attract momentum buyers
• Increase breakout probability
• Facilitate movement through resistance
The timing is not random.
The liquidity appears precisely where pressure beneath the market can matter most.
🔬 THE COMPLETE 6-PHASE SEQUENCE
🔵 PHASE 1: SUDDEN DEPLOYMENT
SPCXUSDT is trading beneath resistance.
Massive bid liquidity suddenly appears near the active market.
The most important event is not yet visible on the candle chart.
It is the sudden transformation of the order book beneath price.
What we see:
✓ Abnormal increase in bid depth
✓ Giant liquidity columns
✓ Strong bid-side asymmetry
✓ Placement near the best bid
✓ Strategic positioning below resistance
The support platform is deployed.
🔵 PHASE 2: CLUSTER FORMATION
The large bid structure spreads across several neighboring prices.
It becomes a multi-level cluster.
As price starts rising, the structure begins to follow it.
The wall is no longer static.
It becomes mobile.
The algorithm appears to continuously adjust:
• Order placement
• Queue position
• Distance from price
• Displayed quantity
• Number of active levels
• Exposure to incoming sells
🔵 PHASE 3: THE LIQUIDITY IS TESTED
Market sellers begin hitting the large bid quantities.
This is the decisive moment.
The structure is not simply displayed.
It is tested by real aggression.
The quantity decreases, but the liquidity rapidly returns.
SELL AGGRESSION → ABSORPTION → REPLENISHMENT
The bid behaves as though it is extremely difficult to exhaust.
This is where the difference between a simple wall and an active execution process becomes visible.
🔵 PHASE 4: SELLERS FAIL TO PUSH PRICE LOWER
The liquidity survives repeated attacks.
Aggressive selling continues, but price refuses to decline materially.
This failure becomes information.
When sellers cannot obtain downside continuation:
• Shorts may begin covering
• Momentum systems may activate
• Other algorithms may detect absorption
• Passive buyers may become more confident
• Breakout probability may increase
The large orders remain directly beneath the traded price.
This is critical.
They are not sitting far away from the active market.
They are positioned where market sellers are forced to interact with them.
That proximity gives the cluster influence over:
• Short-term imbalance
• Queue behavior
• Execution probability
• Perceived support
• Market-order routing
• Other automated strategies
• Breakout expectations
The liquidity appears executable, credible and strategically positioned.
5️⃣ THE ORDERS RELOAD WHEN THEY ARE HIT
This is the most important test.
Large size alone proves very little.
What matters is how the liquidity behaves when sellers attack it.
In this sequence, market sell orders begin hitting the bid.
The displayed quantity declines.
Then it returns.
The structure is hit again.
It reloads again.
HIT → REDUCE → RELOAD → HIT AGAIN → RELOAD AGAIN
This behavior may be associated with:
• Iceberg execution
• Hidden reserve quantity
• Rapid cancel-and-replace logic
• Coordinated child orders
• Queue-management algorithms
• Adaptive liquidity replenishment
A static wall is only a screenshot.
A wall that rebuilds itself is a process.
6️⃣ THE CLUSTER FOLLOWS PRICE UPWARD
As SPCXUSDT begins to rise, the liquidity does not remain at its original level.
The HFT raises the bid structure.
It cancels lower support and recreates it closer to the active market.
The cluster sticks to price.
This is the ratcheting mechanism:
Establish support
Absorb market sellers
Allow price to advance
Cancel obsolete lower orders
Rebuild the structure higher
Repeat
The algorithm is no longer defending one fixed price.
It is defending the direction of the move.
7️⃣ THE EVENT OCCURS BELOW RESISTANCE
Context gives the structure meaning.
The liquidity appears directly beneath an important resistance zone.
That is where strong bid support can become tactically useful.
The algorithm may be attempting to:
• Prevent downside continuation
• Absorb available sellers
• Exhaust short-term bears
• Trigger short covering
• Attract momentum buyers
• Increase breakout probability
• Facilitate movement through resistance
The timing is not random.
The liquidity appears precisely where pressure beneath the market can matter most.
🔬 THE COMPLETE 6-PHASE SEQUENCE
🔵 PHASE 1: SUDDEN DEPLOYMENT
SPCXUSDT is trading beneath resistance.
Massive bid liquidity suddenly appears near the active market.
The most important event is not yet visible on the candle chart.
It is the sudden transformation of the order book beneath price.
What we see:
✓ Abnormal increase in bid depth
✓ Giant liquidity columns
✓ Strong bid-side asymmetry
✓ Placement near the best bid
✓ Strategic positioning below resistance
The support platform is deployed.
🔵 PHASE 2: CLUSTER FORMATION
The large bid structure spreads across several neighboring prices.
It becomes a multi-level cluster.
As price starts rising, the structure begins to follow it.
The wall is no longer static.
It becomes mobile.
The algorithm appears to continuously adjust:
• Order placement
• Queue position
• Distance from price
• Displayed quantity
• Number of active levels
• Exposure to incoming sells
🔵 PHASE 3: THE LIQUIDITY IS TESTED
Market sellers begin hitting the large bid quantities.
This is the decisive moment.
The structure is not simply displayed.
It is tested by real aggression.
The quantity decreases, but the liquidity rapidly returns.
SELL AGGRESSION → ABSORPTION → REPLENISHMENT
The bid behaves as though it is extremely difficult to exhaust.
This is where the difference between a simple wall and an active execution process becomes visible.
🔵 PHASE 4: SELLERS FAIL TO PUSH PRICE LOWER
The liquidity survives repeated attacks.
Aggressive selling continues, but price refuses to decline materially.
This failure becomes information.
When sellers cannot obtain downside continuation:
• Shorts may begin covering
• Momentum systems may activate
• Other algorithms may detect absorption
• Passive buyers may become more confident
• Breakout probability may increase
🔥1
The original HFT does not necessarily need to buy the entire breakout.
It may simply need to prevent price from falling long enough for other participants to become the fuel.
Supporting the bid can indirectly create aggressive buying.
🔵 PHASE 5: THE LIQUIDITY RATCHETS HIGHER
As SPCXUSDT rises, the massive bid structure rises too.
Lower orders are removed.
New orders appear higher.
The cluster remains close to the best bid.
The space available for sellers becomes progressively smaller.
The structure crawls beneath price and continues to maintain pressure.
This is no longer passive support.
It is directional support.
🔵 PHASE 6: RESISTANCE BREAKS
SPCXUSDT moves from approximately $207.30 toward $208.00.
The resistance finally breaks.
Then the enormous bid-side structure disappears or becomes significantly weaker.
This disappearance is highly revealing.
It suggests the liquidity may have served a temporary tactical objective.
The goal may have been to:
• Support the immediate auction
• Absorb selling pressure
• Facilitate accumulation
• Trigger short covering
• Attract momentum algorithms
• Push price through resistance
Once the market reaches the new zone, the original structure is no longer required.
♻️ WHY RELOADING IS MORE IMPORTANT THAN SIZE
A genuine institutional buyer may also place a large bid.
Therefore, size alone is not enough.
The real information appears when the order is attacked.
There are three important forms of reloading:
① STATIC RELOADING
The quantity repeatedly returns at the same price.
② LAYERED RELOADING
The liquidity is rebuilt across several adjacent prices.
③ MOBILE RELOADING
The original structure is removed and recreated higher as price advances.
In this SPCXUSDT sequence, we can observe a combination of:
Layered reloading + mobile reloading
That combination makes the structure much more significant than a simple isolated bid wall.
🎯 WHAT MAY THE HFT BE TRYING TO ACHIEVE?
Several tactical objectives are possible.
1. Absorb aggressive sellers
Market sells provide liquidity to the buyer while price remains supported.
2. Accumulate inventory
The algorithm may build a position without aggressively chasing price.
3. Exhaust the sell side
Repeated failed attempts to break the bid reduce the influence of aggressive sellers.
4. Trigger short covering
Short sellers may exit when price refuses to fall.
Their buy orders become additional fuel.
5. Attract momentum algorithms
Automated systems may react to absorption, imbalance and persistent support.
6. Facilitate the breakout
Once the sell side is weakened, less aggressive buying is needed to move through resistance.
✅ QUICK RECOGNITION CHECKLIST
A predatory-style bid attack becomes more credible when several signals appear together.
LIQUIDITY DEPLOYMENT
✓ Sudden appearance
✓ Abnormal size
✓ Multiple adjacent levels
✓ Close to the best bid
✓ Positioned near resistance
REACTION TO EXECUTION
✓ Sellers repeatedly hit the structure
✓ The liquidity remains active
✓ Size reloads after execution
✓ New orders appear immediately
✓ The cluster survives sustained aggression
PRICE INTERACTION
✓ Sell pressure creates little downside movement
✓ Price remains supported
✓ The cluster follows price upward
✓ Resistance is challenged
✓ The structure disappears after the breakout
CONFIRMATION
✓ Strong bid-side imbalance
✓ Absorption signals
✓ Sell-side exhaustion
✓ Increased trade velocity
✓ Short covering
✓ Breakout shortly afterward
One signal alone proves little.
The power comes from the combination.
⚖️ IMPORTANT: THIS IS NOT AUTOMATICALLY SPOOFING
We must distinguish several different behaviors.
🧊 ICEBERG ORDER
Hidden quantity is gradually revealed as the visible portion is executed.
🏗 AGGRESSIVE LIQUIDITY SUPPORT
Large executable bids remain close to price, absorb sellers and follow the market upward.
🎭 SPOOFING
Orders are generally placed with the intention of misleading the market and being cancelled before execution.
A large bid that is genuinely hit and repeatedly filled is not automatically spoofing.
It may simply need to prevent price from falling long enough for other participants to become the fuel.
Supporting the bid can indirectly create aggressive buying.
🔵 PHASE 5: THE LIQUIDITY RATCHETS HIGHER
As SPCXUSDT rises, the massive bid structure rises too.
Lower orders are removed.
New orders appear higher.
The cluster remains close to the best bid.
The space available for sellers becomes progressively smaller.
The structure crawls beneath price and continues to maintain pressure.
This is no longer passive support.
It is directional support.
🔵 PHASE 6: RESISTANCE BREAKS
SPCXUSDT moves from approximately $207.30 toward $208.00.
The resistance finally breaks.
Then the enormous bid-side structure disappears or becomes significantly weaker.
This disappearance is highly revealing.
It suggests the liquidity may have served a temporary tactical objective.
The goal may have been to:
• Support the immediate auction
• Absorb selling pressure
• Facilitate accumulation
• Trigger short covering
• Attract momentum algorithms
• Push price through resistance
Once the market reaches the new zone, the original structure is no longer required.
The scaffold is removed after the building crosses the gap.
♻️ WHY RELOADING IS MORE IMPORTANT THAN SIZE
A genuine institutional buyer may also place a large bid.
Therefore, size alone is not enough.
The real information appears when the order is attacked.
There are three important forms of reloading:
① STATIC RELOADING
The quantity repeatedly returns at the same price.
② LAYERED RELOADING
The liquidity is rebuilt across several adjacent prices.
③ MOBILE RELOADING
The original structure is removed and recreated higher as price advances.
In this SPCXUSDT sequence, we can observe a combination of:
Layered reloading + mobile reloading
That combination makes the structure much more significant than a simple isolated bid wall.
🎯 WHAT MAY THE HFT BE TRYING TO ACHIEVE?
Several tactical objectives are possible.
1. Absorb aggressive sellers
Market sells provide liquidity to the buyer while price remains supported.
2. Accumulate inventory
The algorithm may build a position without aggressively chasing price.
3. Exhaust the sell side
Repeated failed attempts to break the bid reduce the influence of aggressive sellers.
4. Trigger short covering
Short sellers may exit when price refuses to fall.
Their buy orders become additional fuel.
5. Attract momentum algorithms
Automated systems may react to absorption, imbalance and persistent support.
6. Facilitate the breakout
Once the sell side is weakened, less aggressive buying is needed to move through resistance.
✅ QUICK RECOGNITION CHECKLIST
A predatory-style bid attack becomes more credible when several signals appear together.
LIQUIDITY DEPLOYMENT
✓ Sudden appearance
✓ Abnormal size
✓ Multiple adjacent levels
✓ Close to the best bid
✓ Positioned near resistance
REACTION TO EXECUTION
✓ Sellers repeatedly hit the structure
✓ The liquidity remains active
✓ Size reloads after execution
✓ New orders appear immediately
✓ The cluster survives sustained aggression
PRICE INTERACTION
✓ Sell pressure creates little downside movement
✓ Price remains supported
✓ The cluster follows price upward
✓ Resistance is challenged
✓ The structure disappears after the breakout
CONFIRMATION
✓ Strong bid-side imbalance
✓ Absorption signals
✓ Sell-side exhaustion
✓ Increased trade velocity
✓ Short covering
✓ Breakout shortly afterward
One signal alone proves little.
The power comes from the combination.
⚖️ IMPORTANT: THIS IS NOT AUTOMATICALLY SPOOFING
We must distinguish several different behaviors.
🧊 ICEBERG ORDER
Hidden quantity is gradually revealed as the visible portion is executed.
🏗 AGGRESSIVE LIQUIDITY SUPPORT
Large executable bids remain close to price, absorb sellers and follow the market upward.
🎭 SPOOFING
Orders are generally placed with the intention of misleading the market and being cancelled before execution.
A large bid that is genuinely hit and repeatedly filled is not automatically spoofing.
🔥1
From visualization alone, we can observe the footprint.
We cannot prove:
• The identity of the participant
• The exact strategy
• The legal intent
• Whether one or several algorithms are involved
The most accurate description here is:
🌐 WHY 3D_NEXUS_META CHANGES THE ANALYSIS
On a traditional candlestick chart, this sequence would appear relatively ordinary.
You would only see:
• Price below resistance
• Several bullish candles
• Increasing momentum
• A breakout toward $208
But the candlestick would not explain why the breakout became possible.
Inside 3D_NEXUS_META, we can observe:
🔹 The abnormal height of liquidity
🔹 The multi-level bid cluster
🔹 The proximity to the best bid
🔹 The sell orders striking the structure
🔹 The repeated replenishment
🔹 The upward movement of the cluster
🔹 The relationship between liquidity and price
🔹 The disappearance after the breakout
The candlestick shows the result.
The order book shows the mechanism.
The 3D environment reveals the architecture of the event.
🚨 FINAL LESSON
Never interpret every large bid as automatically bullish.
Displayed liquidity may be:
• Genuine
• Temporary
• Defensive
• Manipulative
• Hidden behind reserve quantity
• Cancelled before execution
• Unrelated to directional intent
Do not study only the size.
Study the behavior.
Ask yourself:
❓ Does the liquidity remain when tested?
❓ Does it absorb real market selling?
❓ Does it reload after execution?
❓ Does it remain near the best bid?
❓ Does it follow price upward?
❓ Does it cover several adjacent levels?
❓ Is it positioned beneath resistance?
❓ Does price respond while it remains active?
❓ Does the structure disappear after the breakout?
The market does not directly reveal intention.
The market reveals behavior under pressure.
In this SPCXUSDT sequence:
Massive bid liquidity appears
↓
A multi-level cluster forms
↓
Sellers attack it
↓
The structure absorbs and reloads
↓
Price begins advancing
↓
The liquidity follows price upward
↓
Resistance breaks
↓
The structure disappears
🔥 FINAL TAKEAWAY
Do not only watch where price is going.
Watch what is being built underneath it.
Sometimes the breakout begins long before the candle crosses resistance.
It begins when aggressive selling stops producing downside movement.
It begins when the liquidity survives every attack.
It begins when the support structure moves upward with price.
It begins when an algorithm transforms the best bid into a moving fortress.
🔬 Captured and visualized through 3D_NEXUS_META
🌐 https://metaquantuniverse.com/nexus
We cannot prove:
• The identity of the participant
• The exact strategy
• The legal intent
• Whether one or several algorithms are involved
The most accurate description here is:
A predatory-style bid-side HFT liquidity campaign consistent with aggressive replenishment, multi-level support, absorption and upward price ratcheting beneath resistance.
🌐 WHY 3D_NEXUS_META CHANGES THE ANALYSIS
On a traditional candlestick chart, this sequence would appear relatively ordinary.
You would only see:
• Price below resistance
• Several bullish candles
• Increasing momentum
• A breakout toward $208
But the candlestick would not explain why the breakout became possible.
Inside 3D_NEXUS_META, we can observe:
🔹 The abnormal height of liquidity
🔹 The multi-level bid cluster
🔹 The proximity to the best bid
🔹 The sell orders striking the structure
🔹 The repeated replenishment
🔹 The upward movement of the cluster
🔹 The relationship between liquidity and price
🔹 The disappearance after the breakout
The candlestick shows the result.
The order book shows the mechanism.
The 3D environment reveals the architecture of the event.
🚨 FINAL LESSON
Never interpret every large bid as automatically bullish.
Displayed liquidity may be:
• Genuine
• Temporary
• Defensive
• Manipulative
• Hidden behind reserve quantity
• Cancelled before execution
• Unrelated to directional intent
Do not study only the size.
Study the behavior.
Ask yourself:
❓ Does the liquidity remain when tested?
❓ Does it absorb real market selling?
❓ Does it reload after execution?
❓ Does it remain near the best bid?
❓ Does it follow price upward?
❓ Does it cover several adjacent levels?
❓ Is it positioned beneath resistance?
❓ Does price respond while it remains active?
❓ Does the structure disappear after the breakout?
The market does not directly reveal intention.
The market reveals behavior under pressure.
In this SPCXUSDT sequence:
Massive bid liquidity appears
↓
A multi-level cluster forms
↓
Sellers attack it
↓
The structure absorbs and reloads
↓
Price begins advancing
↓
The liquidity follows price upward
↓
Resistance breaks
↓
The structure disappears
🔥 FINAL TAKEAWAY
Do not only watch where price is going.
Watch what is being built underneath it.
Sometimes the breakout begins long before the candle crosses resistance.
It begins when aggressive selling stops producing downside movement.
It begins when the liquidity survives every attack.
It begins when the support structure moves upward with price.
It begins when an algorithm transforms the best bid into a moving fortress.
🔬 Captured and visualized through 3D_NEXUS_META
🌐 https://metaquantuniverse.com/nexus
Metaquantuniverse
3D NEXUS META V8.5 — Predictive Order Flow Combat Cockpit
A browser-native 3D orderbook, prediction and execution cockpit for advanced traders.
🔥1