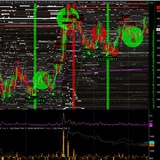
🔥 BIG UPDATE FOR 3D_NEXUS_META MEMBERS 🔥
My friends, this is a big one.
We have just completed and validated a brand-new CQG WebAPI Bridge for 3D_NEXUS_META.
This means NEXUS can now connect more directly to CQG market data, with a cleaner professional-grade feed, deeper market depth, smoother updates, and a much more fluid order flow experience inside the 3D cockpit.
The bridge is now running perfectly on the DATA / READ side:
✅ live liquidity visible inside the 3D map
✅ volume flowing into the Tape
✅ Depth of Market updates
✅ cleaner Level 2 structure
✅ smoother refresh
✅ more professional futures data pipeline
✅ fully integrated into 3D_NEXUS_META
✅ simple user GUI with credentials + START button
Technically, this new bridge acts as a local translator between CQG WebAPI and NEXUS.
CQG sends the market data through its WebAPI layer, the bridge receives and normalizes the book/trade updates, then NEXUS renders everything in real time inside the 3D order flow environment.
In simple words:
CQG WebAPI → Local CQG Bridge → 3D_NEXUS_META → full 3D DOM / Tape / liquidity map.
This opens a new level for NEXUS.
More direct connection.
More depth.
More updates per second.
More fluidity.
More professional futures order flow.
The bridge is available now for all 3D_NEXUS_META members.
Download the CQG NEXUS Bridge here:
https://metaquantuniverse.com/download/CQG_NEXUS_BRIDGE_v3.zip
You just enter your CQG credentials in the small GUI, click START, open NEXUS online, select CQG Futures, and enjoy the flow.
Of course, your CQG account still needs the required market data / WebAPI permissions from your broker or CQG provider, but on the NEXUS side, the integration is ready.
Enjoy it my freros.
This is the next level opening for 3D_NEXUS_META. 🚀
My friends, this is a big one.
We have just completed and validated a brand-new CQG WebAPI Bridge for 3D_NEXUS_META.
This means NEXUS can now connect more directly to CQG market data, with a cleaner professional-grade feed, deeper market depth, smoother updates, and a much more fluid order flow experience inside the 3D cockpit.
The bridge is now running perfectly on the DATA / READ side:
✅ live liquidity visible inside the 3D map
✅ volume flowing into the Tape
✅ Depth of Market updates
✅ cleaner Level 2 structure
✅ smoother refresh
✅ more professional futures data pipeline
✅ fully integrated into 3D_NEXUS_META
✅ simple user GUI with credentials + START button
Technically, this new bridge acts as a local translator between CQG WebAPI and NEXUS.
CQG sends the market data through its WebAPI layer, the bridge receives and normalizes the book/trade updates, then NEXUS renders everything in real time inside the 3D order flow environment.
In simple words:
CQG WebAPI → Local CQG Bridge → 3D_NEXUS_META → full 3D DOM / Tape / liquidity map.
This opens a new level for NEXUS.
More direct connection.
More depth.
More updates per second.
More fluidity.
More professional futures order flow.
The bridge is available now for all 3D_NEXUS_META members.
Download the CQG NEXUS Bridge here:
https://metaquantuniverse.com/download/CQG_NEXUS_BRIDGE_v3.zip
You just enter your CQG credentials in the small GUI, click START, open NEXUS online, select CQG Futures, and enjoy the flow.
Of course, your CQG account still needs the required market data / WebAPI permissions from your broker or CQG provider, but on the NEXUS side, the integration is ready.
Enjoy it my freros.
This is the next level opening for 3D_NEXUS_META. 🚀
❤1👍1🔥1
🔥 BIG CONNECTIVITY UPDATE FOR 3D_NEXUS_META MEMBERS 🔥
My friends, this is an important update.
The latest versions of the main 3D_NEXUS_META bridges are now available for all 3D_NEXUS_META members.
These bridges are not just “extra connectors”.
They are the foundation of what NEXUS is becoming:
A real central trading cockpit for your market activity.
Futures data.
Market depth.
Orderflow.
Tape.
Liquidity visualization.
Execution routes.
Multi-platform connectivity.
All connected into one 3D decision environment.
Here are the latest bridge versions now available:
CQG WebAPI Bridge
https://metaquantuniverse.com/download/CQG_NEXUS_BRIDGE_v3.zip
Sierra Chart Bridge
https://metaquantuniverse.com/download/SC_bridgeV4.3_forNEXUS.zip
Rithmic Bridge
https://metaquantuniverse.com/download/Rithmic_NEXUS_Bridge_V7.zip
MT5 Dual Bridge
https://metaquantuniverse.com/download/dualMT5bridgeNEXUSv7.zip
The biggest new one is the brand-new CQG WebAPI Bridge.
This bridge connects 3D_NEXUS_META directly to the CQG WebAPI through a local Python bridge.
CQG WebAPI → Python Bridge → 3D_NEXUS_META
The result is extremely clean.
Professional futures data.
Tick-by-tick flow.
Unfiltered market activity.
Level 2 market depth.
Up to 40 levels of depth on each side.
CME Group futures support, depending on your CQG account and market data permissions.
CME, CBOT, COMEX, NYMEX, and more.
This is a serious step forward for futures traders.
Liquidity is displayed directly inside the 3D map.
Volumes flow into the Tape.
The DOM updates are smooth.
The market depth is deeper.
The feed is faster, cleaner, and much more professional.
The CQG bridge is now one of the most powerful futures data routes available inside 3D_NEXUS_META.
Then we also have the latest Sierra Chart Bridge.
The Sierra Chart bridge has been updated and is working very well on the READ / DATA side.
You can use it to send futures data, trades, and market depth from Sierra Chart into NEXUS.
It also includes the TRADING / EXECUTION part, so you can test the execution workflow and send me your feedback.
For traders already using Sierra Chart, this is a very strong route.
Sierra Chart → NEXUS Bridge → 3D_NEXUS_META
Clean data path.
Strong futures workflow.
Real orderflow reading inside the 3D cockpit.
The Rithmic bridge has also been updated.
Important note: the Rithmic bridge requires an active futures account with Rithmic data access.
If you use a Rithmic demo or real account, your broker must enable the correct Rithmic API / market data permissions. Otherwise, you may get a “permission denied” error.
But if your Rithmic account is properly enabled, this bridge gives you another direct route into NEXUS.
Rithmic → NEXUS Bridge → 3D_NEXUS_META
And finally, the MT5 Dual Bridge V7 is also available.
This version is more stable, faster, and easier to adapt to almost any MT5 setup.
It can be used for data, execution, or dual-terminal workflows.
For example:
MT5 Terminal 1 = data feed
MT5 Terminal 2 = execution broker
3D_NEXUS_META = visualization, analysis, orderflow, and decision cockpit
This is very useful if you want to use MT5 as your bridge between futures, CFDs, brokers, and NEXUS.
All these different connectivity routes make 3D_NEXUS_META much more than a visual tool.
It becomes a central trading cockpit.
A place where you can connect your data feeds, read the market structure, observe liquidity, follow the Tape, analyze aggressive flow, detect absorption, watch market depth, and build a more complete view of what is happening inside the auction.
CQG.
Sierra Chart.
Rithmic.
MT5.
Four powerful bridges.
Four professional routes.
One 3D orderflow cockpit.
Available now for all 3D_NEXUS_META members.
Enjoy it my friends.
Enjoy it mes freros.
The cockpit keeps evolving. 🚀
My friends, this is an important update.
The latest versions of the main 3D_NEXUS_META bridges are now available for all 3D_NEXUS_META members.
These bridges are not just “extra connectors”.
They are the foundation of what NEXUS is becoming:
A real central trading cockpit for your market activity.
Futures data.
Market depth.
Orderflow.
Tape.
Liquidity visualization.
Execution routes.
Multi-platform connectivity.
All connected into one 3D decision environment.
Here are the latest bridge versions now available:
CQG WebAPI Bridge
https://metaquantuniverse.com/download/CQG_NEXUS_BRIDGE_v3.zip
Sierra Chart Bridge
https://metaquantuniverse.com/download/SC_bridgeV4.3_forNEXUS.zip
Rithmic Bridge
https://metaquantuniverse.com/download/Rithmic_NEXUS_Bridge_V7.zip
MT5 Dual Bridge
https://metaquantuniverse.com/download/dualMT5bridgeNEXUSv7.zip
The biggest new one is the brand-new CQG WebAPI Bridge.
This bridge connects 3D_NEXUS_META directly to the CQG WebAPI through a local Python bridge.
CQG WebAPI → Python Bridge → 3D_NEXUS_META
The result is extremely clean.
Professional futures data.
Tick-by-tick flow.
Unfiltered market activity.
Level 2 market depth.
Up to 40 levels of depth on each side.
CME Group futures support, depending on your CQG account and market data permissions.
CME, CBOT, COMEX, NYMEX, and more.
This is a serious step forward for futures traders.
Liquidity is displayed directly inside the 3D map.
Volumes flow into the Tape.
The DOM updates are smooth.
The market depth is deeper.
The feed is faster, cleaner, and much more professional.
The CQG bridge is now one of the most powerful futures data routes available inside 3D_NEXUS_META.
Then we also have the latest Sierra Chart Bridge.
The Sierra Chart bridge has been updated and is working very well on the READ / DATA side.
You can use it to send futures data, trades, and market depth from Sierra Chart into NEXUS.
It also includes the TRADING / EXECUTION part, so you can test the execution workflow and send me your feedback.
For traders already using Sierra Chart, this is a very strong route.
Sierra Chart → NEXUS Bridge → 3D_NEXUS_META
Clean data path.
Strong futures workflow.
Real orderflow reading inside the 3D cockpit.
The Rithmic bridge has also been updated.
Important note: the Rithmic bridge requires an active futures account with Rithmic data access.
If you use a Rithmic demo or real account, your broker must enable the correct Rithmic API / market data permissions. Otherwise, you may get a “permission denied” error.
But if your Rithmic account is properly enabled, this bridge gives you another direct route into NEXUS.
Rithmic → NEXUS Bridge → 3D_NEXUS_META
And finally, the MT5 Dual Bridge V7 is also available.
This version is more stable, faster, and easier to adapt to almost any MT5 setup.
It can be used for data, execution, or dual-terminal workflows.
For example:
MT5 Terminal 1 = data feed
MT5 Terminal 2 = execution broker
3D_NEXUS_META = visualization, analysis, orderflow, and decision cockpit
This is very useful if you want to use MT5 as your bridge between futures, CFDs, brokers, and NEXUS.
All these different connectivity routes make 3D_NEXUS_META much more than a visual tool.
It becomes a central trading cockpit.
A place where you can connect your data feeds, read the market structure, observe liquidity, follow the Tape, analyze aggressive flow, detect absorption, watch market depth, and build a more complete view of what is happening inside the auction.
CQG.
Sierra Chart.
Rithmic.
MT5.
Four powerful bridges.
Four professional routes.
One 3D orderflow cockpit.
Available now for all 3D_NEXUS_META members.
Enjoy it my friends.
Enjoy it mes freros.
The cockpit keeps evolving. 🚀
❤1👍1
🔥 NEW 3D_NEXUS_META VIDEO IS LIVE! 🔥
My friends, this one is a very clean and powerful example of ETHUSDT weekend order flow.
🎥 Watch here:
https://youtu.be/TkZX-IIjo_0
This is exactly the kind of market condition I love to analyze:
⚖️ balanced flow
📉 low weekend volume
🧊 hidden liquidity
🟢 absorption
🔴 exhaustion
👀 iceberg behavior
♟ market maker control
🎯 clean short-term scalping zones
Most traders see the weekend and think:
“Nothing is happening.”
But when you read the order book properly, you realize something very different.
When volume decreases, the market can become cleaner.
When participation drops, liquidity games can become more visible.
When toxic flow is lower, absorption and exhaustion are easier to detect.
And on ETHUSDT, during these calm weekend sessions, the structure can become almost textbook.
This is the base of real order flow reading:
➡️ aggressive flow attacks a level
➡️ liquidity absorbs it
➡️ momentum starts to fade
➡️ hidden size appears
➡️ price reacts
➡️ the trap becomes visible
With 3D_NEXUS_META, you can see this directly inside a 3D liquidity environment.
Not just candles.
Not just a flat DOM.
Not just random red and green prints.
You see the market architecture:
🧱 liquidity walls
📊 bid / ask depth
🟢 buyer pressure
🔴 seller pressure
🧊 icebergs
⚡️ absorption zones
💥 exhaustion signals
This is why I keep saying:
Candles show the result. Liquidity shows the cause.
For short-term scalping, this kind of calm weekend environment can be extremely interesting, especially when the market is balanced, controlled, and readable.
Less noise.
More structure.
More precision.
🎥 Watch the full video here:
https://youtu.be/TkZX-IIjo_0
More examples and access to 3D_NEXUS_META:
🌐 https://metaquantuniverse.com/nexus
Let’s gooo 🔥
This is exactly the kind of order flow reading I built NEXUS for.
#3DNEXUSMETA #ETHUSDT #OrderFlow #CryptoScalping #Liquidity #MarketMakers #Icebergs #Absorption #Exhaustion
My friends, this one is a very clean and powerful example of ETHUSDT weekend order flow.
🎥 Watch here:
https://youtu.be/TkZX-IIjo_0
This is exactly the kind of market condition I love to analyze:
⚖️ balanced flow
📉 low weekend volume
🧊 hidden liquidity
🟢 absorption
🔴 exhaustion
👀 iceberg behavior
♟ market maker control
🎯 clean short-term scalping zones
Most traders see the weekend and think:
“Nothing is happening.”
But when you read the order book properly, you realize something very different.
When volume decreases, the market can become cleaner.
When participation drops, liquidity games can become more visible.
When toxic flow is lower, absorption and exhaustion are easier to detect.
And on ETHUSDT, during these calm weekend sessions, the structure can become almost textbook.
This is the base of real order flow reading:
➡️ aggressive flow attacks a level
➡️ liquidity absorbs it
➡️ momentum starts to fade
➡️ hidden size appears
➡️ price reacts
➡️ the trap becomes visible
With 3D_NEXUS_META, you can see this directly inside a 3D liquidity environment.
Not just candles.
Not just a flat DOM.
Not just random red and green prints.
You see the market architecture:
🧱 liquidity walls
📊 bid / ask depth
🟢 buyer pressure
🔴 seller pressure
🧊 icebergs
⚡️ absorption zones
💥 exhaustion signals
This is why I keep saying:
Candles show the result. Liquidity shows the cause.
For short-term scalping, this kind of calm weekend environment can be extremely interesting, especially when the market is balanced, controlled, and readable.
Less noise.
More structure.
More precision.
🎥 Watch the full video here:
https://youtu.be/TkZX-IIjo_0
More examples and access to 3D_NEXUS_META:
🌐 https://metaquantuniverse.com/nexus
Let’s gooo 🔥
This is exactly the kind of order flow reading I built NEXUS for.
#3DNEXUSMETA #ETHUSDT #OrderFlow #CryptoScalping #Liquidity #MarketMakers #Icebergs #Absorption #Exhaustion
YouTube
How Market Makers Manipulate ETHUSDT During Low-Volume Weekends | 3D_NEXUS_META - BinancePerps
🔥 ETHUSDT Weekend Order Flow Breakdown with 3D_NEXUS_META 🔥
In this video, we analyze ETHUSDT during the weekend, when the market often becomes quieter, cleaner, and easier to read for short-term order flow traders.
https://metaquantuniverse.com/nexus
…
In this video, we analyze ETHUSDT during the weekend, when the market often becomes quieter, cleaner, and easier to read for short-term order flow traders.
https://metaquantuniverse.com/nexus
…
🔥1
The Touch-Pressure Law
Why Limit Orders Near the Best Bid / Best Ask Can Control Price Pressure
Most traders look at the order book and only ask one basic question:
“Where is the big size?”
But the real question is more precise:
How close is that size to the best bid or best ask?
Because in order flow, proximity is power.
A large limit order placed far away from the current price is information.
But a large limit order placed directly at the best bid, best ask, or just one or two ticks behind it is something else entirely.
It is pressure.
It is intent.
It is immediate liquidity aggression.
I call this:
The Touch-Pressure Law.
The closer a limit order sits to the touch, the more pressure it can impose on price.
Why?
Because a limit order placed close to the best bid or best ask is exposed to immediate execution risk.
It is no longer “passive liquidity” sitting comfortably in the distance.
It is standing in the impact zone.
If buyers place large bids at the best bid, second best bid, and third best bid, they are not hiding in the back of the book.
They are saying:
“We are here.
We are willing to be filled.
And we are forcing sellers to deal with us now.”
This is very different from placing one large limit order several levels away.
Example:
Imagine you see:
• 50 contracts at best bid
• 50 contracts at second best bid
• 50 contracts at third best bid
Total: 150 contracts distributed across the first three bid levels.
Now compare that to:
• 150 contracts placed only at the fourth bid level.
Same total size.
Completely different market meaning.
The first structure is much more aggressive.
Why?
Because the liquidity is stacked directly near the execution zone.
Sellers cannot push price lower without immediately attacking that liquidity.
They must consume it.
They must break through it.
They must prove that their aggression is stronger than the buyers defending the touch.
This creates a form of microstructural pressure.
Not because the size is big.
But because the size is close.
This is the key.
Size matters.
But proximity transforms size into pressure.
Now the next question is critical:
What happens when those bids are attacked?
There are three major scenarios.
1. The bids are hit, consumed, and instantly reloaded
This is one of the strongest signs of real buying power.
If aggressive market sells hit the bid, consume the visible size, and the bid is quickly reloaded with equal or even larger size, this suggests that buyers are not just showing liquidity.
They are absorbing.
They are defending.
They are refreshing.
They are willing to take the other side of aggressive sell pressure.
In that case, the probability of an upside push increases.
Why?
Because sellers are spending energy, but price is not breaking down.
The bid is not disappearing.
It is regenerating.
That is not weakness.
That is absorption under pressure.
This is where the order book starts whispering something very important:
“Someone is buying what others are panic-selling.”
2. The bids are not hit, price moves up, and the liquidity follows higher
This is also bullish.
If the market moves up and those large bid layers are quickly lifted higher to the new best bid area, then the buyer is following the price.
That means the aggression is still active.
The buyer is not just parked at one level.
The buyer is chasing the market through the limit order book.
This is a major distinction.
A static bid can be support.
A bid that follows price can become a pressure engine.
In this case, the order book is showing commitment.
The liquidity is not passive.
It is migrating upward.
The buyer is trying to stay close to the touch.
That is real order book aggression.
3. The bids are not hit, price moves up, then the bids disappear
This is where traders must be careful.
If large bids appear near the best bid, price moves up without those bids being meaningfully attacked, and then the bids are suddenly cancelled, the message becomes more dangerous.
This can indicate a trap.
The bids may have been used to create confidence.
To attract buyers.
To make the market look supported.
Why Limit Orders Near the Best Bid / Best Ask Can Control Price Pressure
Most traders look at the order book and only ask one basic question:
“Where is the big size?”
But the real question is more precise:
How close is that size to the best bid or best ask?
Because in order flow, proximity is power.
A large limit order placed far away from the current price is information.
But a large limit order placed directly at the best bid, best ask, or just one or two ticks behind it is something else entirely.
It is pressure.
It is intent.
It is immediate liquidity aggression.
I call this:
The Touch-Pressure Law.
The closer a limit order sits to the touch, the more pressure it can impose on price.
Why?
Because a limit order placed close to the best bid or best ask is exposed to immediate execution risk.
It is no longer “passive liquidity” sitting comfortably in the distance.
It is standing in the impact zone.
If buyers place large bids at the best bid, second best bid, and third best bid, they are not hiding in the back of the book.
They are saying:
“We are here.
We are willing to be filled.
And we are forcing sellers to deal with us now.”
This is very different from placing one large limit order several levels away.
Example:
Imagine you see:
• 50 contracts at best bid
• 50 contracts at second best bid
• 50 contracts at third best bid
Total: 150 contracts distributed across the first three bid levels.
Now compare that to:
• 150 contracts placed only at the fourth bid level.
Same total size.
Completely different market meaning.
The first structure is much more aggressive.
Why?
Because the liquidity is stacked directly near the execution zone.
Sellers cannot push price lower without immediately attacking that liquidity.
They must consume it.
They must break through it.
They must prove that their aggression is stronger than the buyers defending the touch.
This creates a form of microstructural pressure.
Not because the size is big.
But because the size is close.
This is the key.
Size matters.
But proximity transforms size into pressure.
Now the next question is critical:
What happens when those bids are attacked?
There are three major scenarios.
1. The bids are hit, consumed, and instantly reloaded
This is one of the strongest signs of real buying power.
If aggressive market sells hit the bid, consume the visible size, and the bid is quickly reloaded with equal or even larger size, this suggests that buyers are not just showing liquidity.
They are absorbing.
They are defending.
They are refreshing.
They are willing to take the other side of aggressive sell pressure.
In that case, the probability of an upside push increases.
Why?
Because sellers are spending energy, but price is not breaking down.
The bid is not disappearing.
It is regenerating.
That is not weakness.
That is absorption under pressure.
This is where the order book starts whispering something very important:
“Someone is buying what others are panic-selling.”
2. The bids are not hit, price moves up, and the liquidity follows higher
This is also bullish.
If the market moves up and those large bid layers are quickly lifted higher to the new best bid area, then the buyer is following the price.
That means the aggression is still active.
The buyer is not just parked at one level.
The buyer is chasing the market through the limit order book.
This is a major distinction.
A static bid can be support.
A bid that follows price can become a pressure engine.
In this case, the order book is showing commitment.
The liquidity is not passive.
It is migrating upward.
The buyer is trying to stay close to the touch.
That is real order book aggression.
3. The bids are not hit, price moves up, then the bids disappear
This is where traders must be careful.
If large bids appear near the best bid, price moves up without those bids being meaningfully attacked, and then the bids are suddenly cancelled, the message becomes more dangerous.
This can indicate a trap.
The bids may have been used to create confidence.
To attract buyers.
To make the market look supported.
🔥1
To manufacture the illusion of demand.
Then once buyers step in, the liquidity vanishes.
That is not support.
That is a possible bull trap.
The book showed strength, but the strength did not stay.
In order flow, disappearance matters as much as appearance.
A wall that follows price can be aggressive.
A wall that refreshes after being hit can be powerful.
But a wall that vanishes after attracting buyers can become a warning signal.
This logic works exactly the same on the ask side, but in reverse.
Large limit sell orders placed directly at the best ask, second best ask, and third best ask create immediate pressure against buyers.
If they are hit and reloaded, sellers may be absorbing market buys.
If they follow price lower, sellers are actively pressing the market.
If they disappear after attracting shorts, it can become a bear trap.
This is why reading the order book is not about saying:
“There is big size here.”
That is too basic.
The real question is:
Where is the size?
How close is it to the touch?
Is it being hit?
Is it being reloaded?
Is it following price?
Or is it disappearing after creating a false signal?
That sequence is the story.
This is the difference between seeing liquidity and understanding liquidity behavior.
The order book is not a static table.
It is a battlefield of intention, cancellation risk, execution pressure, absorption, and deception.
And this is exactly the kind of logic that 3D_NEXUS_META was built to visualize.
Instead of watching bid and ask numbers flicker in a flat DOM, 3D_NEXUS_META transforms the market into a 3D liquidity environment.
You can see:
• where the bid/ask pressure is building
• how close liquidity is to the best bid / best ask
• whether aggressive trades are hitting those zones
• whether the liquidity is being consumed, refreshed, or cancelled
• how delta reacts
• where absorption, iceberg behavior, spoofing, whale walls, and smart-money pressure may appear
This is where the Touch-Pressure Law becomes visual.
Not theoretical.
Not hidden inside a spreadsheet.
Visible.
Spatial.
Alive.
Because in modern markets, price does not move only because “buyers are stronger than sellers.”
Price moves when liquidity is placed, attacked, defended, reloaded, chased, or removed.
And the closer that liquidity is to the touch…
…the more dangerous, powerful, and informative it becomes.
Welcome to the microstructure layer.
Welcome to 3D_NEXUS_META.
https://metaquantuniverse.com/nexus
#OrderFlow #Trading #MarketMicrostructure #Liquidity #Scalping #FuturesTrading #CryptoTrading #3DNEXUSMETA #METAquant #HFT #LimitOrders
Then once buyers step in, the liquidity vanishes.
That is not support.
That is a possible bull trap.
The book showed strength, but the strength did not stay.
In order flow, disappearance matters as much as appearance.
A wall that follows price can be aggressive.
A wall that refreshes after being hit can be powerful.
But a wall that vanishes after attracting buyers can become a warning signal.
This logic works exactly the same on the ask side, but in reverse.
Large limit sell orders placed directly at the best ask, second best ask, and third best ask create immediate pressure against buyers.
If they are hit and reloaded, sellers may be absorbing market buys.
If they follow price lower, sellers are actively pressing the market.
If they disappear after attracting shorts, it can become a bear trap.
This is why reading the order book is not about saying:
“There is big size here.”
That is too basic.
The real question is:
Where is the size?
How close is it to the touch?
Is it being hit?
Is it being reloaded?
Is it following price?
Or is it disappearing after creating a false signal?
That sequence is the story.
This is the difference between seeing liquidity and understanding liquidity behavior.
The order book is not a static table.
It is a battlefield of intention, cancellation risk, execution pressure, absorption, and deception.
And this is exactly the kind of logic that 3D_NEXUS_META was built to visualize.
Instead of watching bid and ask numbers flicker in a flat DOM, 3D_NEXUS_META transforms the market into a 3D liquidity environment.
You can see:
• where the bid/ask pressure is building
• how close liquidity is to the best bid / best ask
• whether aggressive trades are hitting those zones
• whether the liquidity is being consumed, refreshed, or cancelled
• how delta reacts
• where absorption, iceberg behavior, spoofing, whale walls, and smart-money pressure may appear
This is where the Touch-Pressure Law becomes visual.
Not theoretical.
Not hidden inside a spreadsheet.
Visible.
Spatial.
Alive.
Because in modern markets, price does not move only because “buyers are stronger than sellers.”
Price moves when liquidity is placed, attacked, defended, reloaded, chased, or removed.
And the closer that liquidity is to the touch…
…the more dangerous, powerful, and informative it becomes.
Welcome to the microstructure layer.
Welcome to 3D_NEXUS_META.
https://metaquantuniverse.com/nexus
#OrderFlow #Trading #MarketMicrostructure #Liquidity #Scalping #FuturesTrading #CryptoTrading #3DNEXUSMETA #METAquant #HFT #LimitOrders
Metaquantuniverse
3D NEXUS META V8.5 — Predictive Order Flow Combat Cockpit
A browser-native 3D orderbook, prediction and execution cockpit for advanced traders.
🔥1
⚔️ New orderflow concept for the private group:
THE BEST BID / BEST ASK BATTLEFIELD
This one is very important.
Most traders think price is decided by candles.
But in reality, on the very short term, price is decided at the front line:
🟢 Best Bid
🔴 Best Ask
This is where passive liquidity and aggressive flow collide.
Limit orders wait.
Market orders attack.
Liquidity absorbs.
Price reacts.
And here is the key point:
The closer a limit order is to the best bid or best ask, the more immediate pressure it can apply on price.
A big wall far away from price can look impressive, but it is still only potential liquidity.
A smaller order sitting directly at the best bid or best ask is different.
It is on the battlefield.
It can absorb now.
It can defend now.
It can slow the move now.
It can disappear and create a vacuum now.
This is why the best bid / best ask zone is so important for scalping, orderflow reading and HFT-style market interpretation.
When the bid keeps reloading while sellers hit it, you may be seeing absorption.
When the ask keeps reloading while buyers attack it, you may be seeing passive selling.
When liquidity suddenly disappears at the front line, price can move violently because there is nothing left to stop it.
Candles show the result.
The orderbook shows the fight.
This is exactly what I want to make visible with 3D_NEXUS_META.
3D_NEXUS_META is not just a visual tool.
It is a 3D orderflow cockpit designed to help traders see liquidity, pressure, aggression, absorption and market depth in real time.
The goal is simple:
See deeper than candles.
https://metaquantuniverse.com/nexus
3D_NEXUS_META
The market predicts.
You execute first.
THE BEST BID / BEST ASK BATTLEFIELD
This one is very important.
Most traders think price is decided by candles.
But in reality, on the very short term, price is decided at the front line:
🟢 Best Bid
🔴 Best Ask
This is where passive liquidity and aggressive flow collide.
Limit orders wait.
Market orders attack.
Liquidity absorbs.
Price reacts.
And here is the key point:
The closer a limit order is to the best bid or best ask, the more immediate pressure it can apply on price.
A big wall far away from price can look impressive, but it is still only potential liquidity.
A smaller order sitting directly at the best bid or best ask is different.
It is on the battlefield.
It can absorb now.
It can defend now.
It can slow the move now.
It can disappear and create a vacuum now.
This is why the best bid / best ask zone is so important for scalping, orderflow reading and HFT-style market interpretation.
When the bid keeps reloading while sellers hit it, you may be seeing absorption.
When the ask keeps reloading while buyers attack it, you may be seeing passive selling.
When liquidity suddenly disappears at the front line, price can move violently because there is nothing left to stop it.
Candles show the result.
The orderbook shows the fight.
This is exactly what I want to make visible with 3D_NEXUS_META.
3D_NEXUS_META is not just a visual tool.
It is a 3D orderflow cockpit designed to help traders see liquidity, pressure, aggression, absorption and market depth in real time.
The goal is simple:
See deeper than candles.
https://metaquantuniverse.com/nexus
3D_NEXUS_META
The market predicts.
You execute first.
Metaquantuniverse
3D NEXUS META V8.5 — Predictive Order Flow Combat Cockpit
A browser-native 3D orderbook, prediction and execution cockpit for advanced traders.
🚀 3D_NEXUS_META MEMBERS — START HERE
My friends,
I strongly recommend that every 3D_NEXUS_META member takes a moment to explore the official guides and tutorials.
3D_NEXUS_META is not just a visual trading tool.
It is a complete 3D orderflow cockpit.
It brings together:
⚔️ Market depth
🟢 Bid liquidity
🔴 Ask liquidity
⚡️ Aggressive flow
🔮 Prediction Oracle
🧠 Market intelligence
🔌 Bridges and connectors
📊 Strategy logic
🛰 Multi-market connectivity
🎯 Manual / assisted / automated trading workflows
But to use it properly, you need to understand the ecosystem.
That is why I created a full documentation path for you.
━━━━━━━━━━━━━━━━━━
📘 USER GUIDE
Everything you need to get started with the platform.
https://metaquantuniverse.com/download/userguidenexusmeta.html
━━━━━━━━━━━━━━━━━━
📈 PROFITABILITY STRATEGY
How to think with NEXUS, read signals, understand orderflow logic, and build better trading decisions.
https://metaquantuniverse.com/download/nexus-meta-guide.html
━━━━━━━━━━━━━━━━━━
🔌 DUAL MT5 BRIDGE
How to connect 3D_NEXUS_META with MT5, including the dual-station logic: one MT5 for data, one MT5 for execution.
https://metaquantuniverse.com/download/NEXUS_DUAL_BRIDGE_GUIDE.html
━━━━━━━━━━━━━━━━━━
🔮 PREDICTION ORACLE
Understand the multi-horizon prediction engine, probabilistic signals, market regime logic, and orderflow-based forecasting.
https://metaquantuniverse.com/nexus/PREDICTION_ORACLE_GUIDE.html
━━━━━━━━━━━━━━━━━━
🛰 CONNECTIVITY GUIDE
All supported data feeds, bridges, exchanges, execution routes, crypto feeds, futures feeds, MT5 workflows, and external connections.
https://metaquantuniverse.com/nexus/NEXUS_CONNECTIVITY_GUIDE.html
━━━━━━━━━━━━━━━━━━
🧠 FUNDAMENTALS
The best place to start if you want to understand the foundation:
Price.
Volume.
Liquidity.
Orderflow.
Market depth.
https://metaquantuniverse.com/nexus/base.html
━━━━━━━━━━━━━━━━━━
🧠 BRIDGES ARSENAL
Download and understand the bridge ecosystem for Sierra Chart, Rithmic, MT5, Hyperliquid, Polymarket and more.
https://metaquantuniverse.com/nexus/NEXUS_BRIDGES_ARSENAL.html
━━━━━━━━━━━━━━━━━━
🎯 FREE TRIAL ACCESS
For new users who want to test 3D_NEXUS_META before joining.
https://nexus-meta-auth.3dnexusmeta.workers.dev/
━━━━━━━━━━━━━━━━━━
🌐 MAIN 3D_NEXUS_META PAGE
https://metaquantuniverse.com/nexus
━━━━━━━━━━━━━━━━━━
🔥 My recommended reading order:
1️⃣ Fundamentals
2️⃣ User Guide
3️⃣ Profitability Strategy
4️⃣ Prediction Oracle
5️⃣ Connectivity Guide
6️⃣ Dual MT5 Bridge
7️⃣ Bridges Arsenal
Do not try to master everything in one hour.
Start step by step.
First understand the logic.
Then the interface.
Then the signals.
Then the bridges.
Then the execution workflows.
3D_NEXUS_META is deep.
The more you understand the documentation, the more powerful the platform becomes.
This is not just about watching candles.
This is about learning to read the market structure behind the candles.
3D_NEXUS_META
The market predicts.
You execute first.
https://metaquantuniverse.com/nexus
My friends,
I strongly recommend that every 3D_NEXUS_META member takes a moment to explore the official guides and tutorials.
3D_NEXUS_META is not just a visual trading tool.
It is a complete 3D orderflow cockpit.
It brings together:
⚔️ Market depth
🟢 Bid liquidity
🔴 Ask liquidity
⚡️ Aggressive flow
🔮 Prediction Oracle
🧠 Market intelligence
🔌 Bridges and connectors
📊 Strategy logic
🛰 Multi-market connectivity
🎯 Manual / assisted / automated trading workflows
But to use it properly, you need to understand the ecosystem.
That is why I created a full documentation path for you.
━━━━━━━━━━━━━━━━━━
📘 USER GUIDE
Everything you need to get started with the platform.
https://metaquantuniverse.com/download/userguidenexusmeta.html
━━━━━━━━━━━━━━━━━━
📈 PROFITABILITY STRATEGY
How to think with NEXUS, read signals, understand orderflow logic, and build better trading decisions.
https://metaquantuniverse.com/download/nexus-meta-guide.html
━━━━━━━━━━━━━━━━━━
🔌 DUAL MT5 BRIDGE
How to connect 3D_NEXUS_META with MT5, including the dual-station logic: one MT5 for data, one MT5 for execution.
https://metaquantuniverse.com/download/NEXUS_DUAL_BRIDGE_GUIDE.html
━━━━━━━━━━━━━━━━━━
🔮 PREDICTION ORACLE
Understand the multi-horizon prediction engine, probabilistic signals, market regime logic, and orderflow-based forecasting.
https://metaquantuniverse.com/nexus/PREDICTION_ORACLE_GUIDE.html
━━━━━━━━━━━━━━━━━━
🛰 CONNECTIVITY GUIDE
All supported data feeds, bridges, exchanges, execution routes, crypto feeds, futures feeds, MT5 workflows, and external connections.
https://metaquantuniverse.com/nexus/NEXUS_CONNECTIVITY_GUIDE.html
━━━━━━━━━━━━━━━━━━
🧠 FUNDAMENTALS
The best place to start if you want to understand the foundation:
Price.
Volume.
Liquidity.
Orderflow.
Market depth.
https://metaquantuniverse.com/nexus/base.html
━━━━━━━━━━━━━━━━━━
🧠 BRIDGES ARSENAL
Download and understand the bridge ecosystem for Sierra Chart, Rithmic, MT5, Hyperliquid, Polymarket and more.
https://metaquantuniverse.com/nexus/NEXUS_BRIDGES_ARSENAL.html
━━━━━━━━━━━━━━━━━━
🎯 FREE TRIAL ACCESS
For new users who want to test 3D_NEXUS_META before joining.
https://nexus-meta-auth.3dnexusmeta.workers.dev/
━━━━━━━━━━━━━━━━━━
🌐 MAIN 3D_NEXUS_META PAGE
https://metaquantuniverse.com/nexus
━━━━━━━━━━━━━━━━━━
🔥 My recommended reading order:
1️⃣ Fundamentals
2️⃣ User Guide
3️⃣ Profitability Strategy
4️⃣ Prediction Oracle
5️⃣ Connectivity Guide
6️⃣ Dual MT5 Bridge
7️⃣ Bridges Arsenal
Do not try to master everything in one hour.
Start step by step.
First understand the logic.
Then the interface.
Then the signals.
Then the bridges.
Then the execution workflows.
3D_NEXUS_META is deep.
The more you understand the documentation, the more powerful the platform becomes.
This is not just about watching candles.
This is about learning to read the market structure behind the candles.
3D_NEXUS_META
The market predicts.
You execute first.
https://metaquantuniverse.com/nexus
🔥 FDAX BUYERS GOT ABSORBED… THEN DESTROYED 🔥
My friends, this is exactly why 3D order flow visualization matters.
Here we have a clean bearish setup on FDAX, captured with 3D_NEXUS_META during the EU/UK morning session.
The sequence is brutal:
1️⃣ Large market BUY orders hit the ASK
2️⃣ Price does NOT lift
3️⃣ Ask liquidity reloads lower
4️⃣ HFT Sell Signal triggers near 25,274
5️⃣ FDAX drops toward 25,261
Result:
✅ Around 20 points down
✅ Around 40 ticks
✅ In only a few minutes
The trap was not visible only on price.
The real clue was inside the order book:
Large buy bubbles were hitting the ask side, but the price failed to move higher.
That is ask-side absorption.
Then sellers started offering lower and lower.
That is where the bull trap became obvious.
With 3D_NEXUS_META, you don’t just read the DOM.
You see the battlefield:
🔹 market buys hitting the ask
🔹 passive sellers absorbing
🔹 ask liquidity reloading lower
🔹 buyers getting trapped
🔹 HFT sell signal confirming the move
🔹 final downside continuation
This is not random price action.
This is market microstructure.
This is where the edge lives.
👉 More about 3D_NEXUS_META:
https://metaquantuniverse.com/nexus
#FDAX #OrderFlow #Scalping #HFT #MarketMaking #Liquidity #BullTrap #3DNEXUSMETA
My friends, this is exactly why 3D order flow visualization matters.
Here we have a clean bearish setup on FDAX, captured with 3D_NEXUS_META during the EU/UK morning session.
The sequence is brutal:
1️⃣ Large market BUY orders hit the ASK
2️⃣ Price does NOT lift
3️⃣ Ask liquidity reloads lower
4️⃣ HFT Sell Signal triggers near 25,274
5️⃣ FDAX drops toward 25,261
Result:
✅ Around 20 points down
✅ Around 40 ticks
✅ In only a few minutes
The trap was not visible only on price.
The real clue was inside the order book:
Buyers were aggressive, but sellers were in control.
Large buy bubbles were hitting the ask side, but the price failed to move higher.
That is ask-side absorption.
Then sellers started offering lower and lower.
That is where the bull trap became obvious.
With 3D_NEXUS_META, you don’t just read the DOM.
You see the battlefield:
🔹 market buys hitting the ask
🔹 passive sellers absorbing
🔹 ask liquidity reloading lower
🔹 buyers getting trapped
🔹 HFT sell signal confirming the move
🔹 final downside continuation
This is not random price action.
This is market microstructure.
This is where the edge lives.
👉 More about 3D_NEXUS_META:
https://metaquantuniverse.com/nexus
#FDAX #OrderFlow #Scalping #HFT #MarketMaking #Liquidity #BullTrap #3DNEXUSMETA
Metaquantuniverse
3D NEXUS META V8.5 — Predictive Order Flow Combat Cockpit
A browser-native 3D orderbook, prediction and execution cockpit for advanced traders.
❤1🔥1