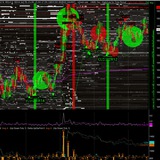
Guys, I’m really happy to show you the new FOOTPRINT MODE inside 3D NEXUS META. 🚀
This one is special.
The goal was to take the classic Bid-Ask Footprint chart, which is already one of the most powerful tools for reading order flow, and bring it into a fully interactive 3D environment.
Now we can see:
🟢 buyers lifting the ask
🔴 sellers hitting the bid
🟩 BID liquidity
🟥 ASK liquidity
🔢 numerical size labels
📍 price levels
🏆 POC
⚖️ delta
🎚 scale controls for footprint and orderbook bars
Everything is rendered in real time with Three.js and WebGL.
What I love about this mode is that it does not just look impressive.
It actually helps you understand what is happening inside the market.
You can see where aggressive volume appears.
You can see where liquidity is stacked.
You can see how price reacts around certain levels.
You can compare executed volume versus passive orderbook liquidity.
And because it is in 3D, you can rotate around the structure and inspect the market from multiple angles.
It feels like stepping inside the footprint chart instead of just looking at it.
This is a huge step for 3D NEXUS META.
FOOTPRINT MODE is live. ⚡️
This one is special.
The goal was to take the classic Bid-Ask Footprint chart, which is already one of the most powerful tools for reading order flow, and bring it into a fully interactive 3D environment.
Now we can see:
🟢 buyers lifting the ask
🔴 sellers hitting the bid
🟩 BID liquidity
🟥 ASK liquidity
🔢 numerical size labels
📍 price levels
🏆 POC
⚖️ delta
🎚 scale controls for footprint and orderbook bars
Everything is rendered in real time with Three.js and WebGL.
What I love about this mode is that it does not just look impressive.
It actually helps you understand what is happening inside the market.
You can see where aggressive volume appears.
You can see where liquidity is stacked.
You can see how price reacts around certain levels.
You can compare executed volume versus passive orderbook liquidity.
And because it is in 3D, you can rotate around the structure and inspect the market from multiple angles.
It feels like stepping inside the footprint chart instead of just looking at it.
This is a huge step for 3D NEXUS META.
FOOTPRINT MODE is live. ⚡️
❤1🔥1
🚀 New video is live for the 3D NEXUS META community.
I’m presenting the brand new FOOTPRINT MODE, probably one of the most important updates so far.
The idea is simple:
Take the power of a professional Bid-Ask Footprint chart…
And bring it into a full 3D WebGL environment.
Now you can see:
🟢 aggressive buyers
🔴 aggressive sellers
🧱 orderbook liquidity
📍 price levels
🏆 POC
⚖️ delta
🔢 volume & liquidity labels
🎚 live scale controls
🌌 full 3D navigation
This is not just a visual effect.
It’s a new way to read order flow, liquidity, absorption, pressure, and market structure.
The market is no longer flat.
Watch it here 👇
https://youtu.be/NW4teXLBWJE
I’m presenting the brand new FOOTPRINT MODE, probably one of the most important updates so far.
The idea is simple:
Take the power of a professional Bid-Ask Footprint chart…
And bring it into a full 3D WebGL environment.
Now you can see:
🟢 aggressive buyers
🔴 aggressive sellers
🧱 orderbook liquidity
📍 price levels
🏆 POC
⚖️ delta
🔢 volume & liquidity labels
🎚 live scale controls
🌌 full 3D navigation
This is not just a visual effect.
It’s a new way to read order flow, liquidity, absorption, pressure, and market structure.
The market is no longer flat.
Watch it here 👇
https://youtu.be/NW4teXLBWJE
YouTube
The footprint chart just entered the third dimension. A new lens for market nanostructure.
🚀 **Introducing FOOTPRINT MODE in 3D NEXUS META**
In this new video, I’m presenting one of the biggest updates ever added to **3D NEXUS META**: **FOOTPRINT MODE**.
This new visualization mode brings the logic of a professional **Bid-Ask Footprint chart**…
In this new video, I’m presenting one of the biggest updates ever added to **3D NEXUS META**: **FOOTPRINT MODE**.
This new visualization mode brings the logic of a professional **Bid-Ask Footprint chart**…
❤1
🚨 3D NEXUS META just unlocked full 3D Order Flow visualization.
The DOM is no longer a flat table.
It is terrain.
It is pressure.
It is liquidity you can *walk through*. 🧬
You now have access to multiple native 3D visualization modes:
🟢 SURFACE MODE
The core view. The cleanest, sharpest, most battle-ready mode.
A full 3D liquidity landscape where bid and ask depth rise like market architecture.
Essential.
🟣 TUNNEL MODE
Step inside the DOM.
Same precision, but from within the liquidity structure itself.
You are no longer watching order flow from outside.
You are *inside the machine*.
🟡 FOOTPRINT MODE
Classic price action, rebuilt inside the 3D scene.
For every price level, you see delta, bid-ask volume, horizontal pressure bars, and market depth layered above it.
Traditional footprint logic, upgraded into a full spatial battlefield.
🔵 X-RAY MODE
Go beneath the surface.
Layer by layer. Price level by price level. Time slice by time slice.
A native 3D/4D microscope for the orderbook.
You are not just reading liquidity. You are dissecting it.
🔴 CANYON MODE
Similar to Surface, but with cumulative depth across all price levels.
Bids and asks form two massive liquidity walls, with price flowing through the middle like a river inside the canyon.
Hyper immersive. Brutally useful for spotting depth imbalances.
This is not just another chart.
This is order flow turned into a living 3D environment.
A market scanner. A liquidity radar. A DOM exoskeleton.
Welcome to 3D NEXUS META.
Trade the structure. See the pressure. Enter the flow. ⚡️
https://metaquantuniverse.com/nexus/
The DOM is no longer a flat table.
It is terrain.
It is pressure.
It is liquidity you can *walk through*. 🧬
You now have access to multiple native 3D visualization modes:
🟢 SURFACE MODE
The core view. The cleanest, sharpest, most battle-ready mode.
A full 3D liquidity landscape where bid and ask depth rise like market architecture.
Essential.
🟣 TUNNEL MODE
Step inside the DOM.
Same precision, but from within the liquidity structure itself.
You are no longer watching order flow from outside.
You are *inside the machine*.
🟡 FOOTPRINT MODE
Classic price action, rebuilt inside the 3D scene.
For every price level, you see delta, bid-ask volume, horizontal pressure bars, and market depth layered above it.
Traditional footprint logic, upgraded into a full spatial battlefield.
🔵 X-RAY MODE
Go beneath the surface.
Layer by layer. Price level by price level. Time slice by time slice.
A native 3D/4D microscope for the orderbook.
You are not just reading liquidity. You are dissecting it.
🔴 CANYON MODE
Similar to Surface, but with cumulative depth across all price levels.
Bids and asks form two massive liquidity walls, with price flowing through the middle like a river inside the canyon.
Hyper immersive. Brutally useful for spotting depth imbalances.
This is not just another chart.
This is order flow turned into a living 3D environment.
A market scanner. A liquidity radar. A DOM exoskeleton.
Welcome to 3D NEXUS META.
Trade the structure. See the pressure. Enter the flow. ⚡️
https://metaquantuniverse.com/nexus/
Metaquantuniverse
3D NEXUS META V8.5 — Predictive Order Flow Combat Cockpit
A browser-native 3D orderbook, prediction and execution cockpit for advanced traders.
❤1🔥1