You’re on Easter weekend, the holidays are here… and you’re bored because your favorite instrument, like the Nasdaq 100 Index, is closed on the CME? 😏
No problem.
With 3D_NEXUS_META, you get access to multiple TradeFi / RWA feeds so you can still find and monitor your favorite futures-style instruments:
EURUSD, Gold, Oil, SP500, Nasdaq100, and much more.
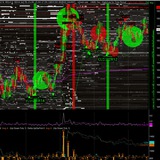
As you can see on this screenshot, the Nasdaq100 Index is running in real time through HyperLiquid PERPS. Even on the weekend.
Of course, liquidity is lighter and trade activity is thinner than during regular traditional market hours, but it is still live, tradable, and scalpable for those who want a bit of action while the old-school markets are sleeping. ⚡️
And for those who think nothing moves on weekends, and that it is pointless to watch these markets, keep this in mind: with the current fundamental and geopolitical backdrop, we have very often seen major moves during weekends over the past several weeks. Just take a look at oil in particular. Sometimes the volatility hits hard. Very hard.
And this is exactly why TradeFi and RWA perps are becoming more and more interesting:
they are still relatively new, but volume is growing fast, adoption is accelerating, and the whole space is expanding like crazy.
For your info, you can already access these futures-style contracts across several NEXUS feeds:
* Binance PERPS for instruments like XAUUSDT and XAGUSDT
* HyperLiquid: the full TradeFi / RWA universe is there
* Bitget RWA: same story
* Aster TradeFi: with its absolutely wild leverage
There’s something for every style, every mood, every beast of a trader. 🎯
Place your bets.
Even on holidays, we’re here.
No problem.
With 3D_NEXUS_META, you get access to multiple TradeFi / RWA feeds so you can still find and monitor your favorite futures-style instruments:
EURUSD, Gold, Oil, SP500, Nasdaq100, and much more.
As you can see on this screenshot, the Nasdaq100 Index is running in real time through HyperLiquid PERPS. Even on the weekend.
Of course, liquidity is lighter and trade activity is thinner than during regular traditional market hours, but it is still live, tradable, and scalpable for those who want a bit of action while the old-school markets are sleeping. ⚡️
And for those who think nothing moves on weekends, and that it is pointless to watch these markets, keep this in mind: with the current fundamental and geopolitical backdrop, we have very often seen major moves during weekends over the past several weeks. Just take a look at oil in particular. Sometimes the volatility hits hard. Very hard.
And this is exactly why TradeFi and RWA perps are becoming more and more interesting:
they are still relatively new, but volume is growing fast, adoption is accelerating, and the whole space is expanding like crazy.
For your info, you can already access these futures-style contracts across several NEXUS feeds:
* Binance PERPS for instruments like XAUUSDT and XAGUSDT
* HyperLiquid: the full TradeFi / RWA universe is there
* Bitget RWA: same story
* Aster TradeFi: with its absolutely wild leverage
There’s something for every style, every mood, every beast of a trader. 🎯
Place your bets.
Even on holidays, we’re here.
❤1👍1
Back then, trading had a face: the desks, the floor, the pit.
Today, everything is algorithmic. Automated. HFT rules. Market makers dominate.
But the core game has not changed.
The mechanics are the same. The traps are the same. The manipulation is the same.
Want to understand it with your own eyes?
Watch this.
Old-school footage. MATIF CAC40 pit. Late 80s, early 90s. Raw. Direct. Surgical.
This is a true masterclass in understanding stop-loss hunting.
The technology changed.
Human behavior didn’t.
https://www.youtube.com/watch?v=wPgPWkuZiHg&t=249s
Today, everything is algorithmic. Automated. HFT rules. Market makers dominate.
But the core game has not changed.
The mechanics are the same. The traps are the same. The manipulation is the same.
Want to understand it with your own eyes?
Watch this.
Old-school footage. MATIF CAC40 pit. Late 80s, early 90s. Raw. Direct. Surgical.
This is a true masterclass in understanding stop-loss hunting.
The technology changed.
Human behavior didn’t.
https://www.youtube.com/watch?v=wPgPWkuZiHg&t=249s
YouTube
Stop Loss Hunting process shown in SCALP tv series - Understand the ORDERFLOW !
Hello to all! Dear friends! Dear colleagues ! I know that for most of you, you are not French speaking, but this morning, I made you a small video clip of a superb TV series, French, which relates the trading on the PIT, at the time of the MATIF CAC40 (FCE);…
USOIL (CL) Scalp Breakdown – +30 Ticks in Minutes, Pure 3D NEXUS META Edge
Hey team,
Just dropped this live sequence on HyperLiquid’s CL (US Oil) contract inside 3D NEXUS META — and it’s one of the cleanest examples yet of how this platform turns short-term chaos into a predictable, high-probability setup.
We caught the move from 111.830 → 111.995 (basically +30 ticks) in a matter of minutes. No guesswork. No staring at flat 2D ladders. Just crystal-clear confluence from the 3D order flow + the NEXUS AI ORACLE doing what it’s built for.
Here’s exactly how it played out across the phases:
Phase 1 – Initial Buy Signal @ 111.83Strong WHALE WALL printed on the bid side. Multiple BUY signals lit up across the SIGNALS tab. The NEXUS AI ORACLE immediately flagged:
Iceberg Order (hidden liquidity stacking)
Ask Exhaustion (sellers losing steam)
Tape Bomb + rapid execution burst
The 3D visualization made it obvious — massive green buy-side liquidity stacking in real-time, with velocity and footprint bars showing aggressive absorption. That’s the moment we went long.
Phase 2 – First Leg Up (+15 ticks)Price ripped straight to 111.900+. The 3D order flow showed buyer dominance — big green blocks pushing through the ask ladder with almost no red resistance. The AI Oracle kept confirming “Buyers losing steam – upside risk at $112.XXX” while sellers were getting exhausted.
Phase 3 – Healthy PullbackClassic liquidity sweep. Price dipped back toward 111.81. But here’s where the 3D meta shines: even during the pullback, the WHALE WALL on the bid never broke. The AI Oracle stayed neutral-to-bullish, no new seller exhaustion alerts, just “hidden liquidity refill detected.” We held. The 3D depth map showed buyers quietly reloading below.
Phase 4 – Fresh Buy Signals @ 111.85New BUY $111.850 confirmation box popped with 79% EXHAUSTION reading. Multiple iceberg orders reappeared on the bid. The SIGNALS tab lit up again. This was the re-entry / add-on zone — same exact confluence as Phase 1, but with even stronger 3D footprint confirmation.
Phase 5 – Explosive ContinuationThe move accelerated. You could literally watch the 3D order flow “tilt” bullish — massive green volume blocks cascading upward, seller walls evaporating in real-time. The NEXUS AI ORACLE was screaming upside: Ask Exhaustion, Sellers losing steam, Tape Bomb events. Price flew toward 111.94–111.99 with almost zero hesitation.
Phase 6 – Target Hit+30 ticks secured. 112.000 zone almost touched. Take-profit executed perfectly.
Why 3D NEXUS META Made This Stupidly Easy
True 3D Order Flow — You don’t just see numbers on a ladder. You see liquidity as physical walls, velocity as movement, and absorption as real-time collisions in 3D space. Imbalances jump out instantly.
NEXUS AI ORACLE — This is the game-changer. It detects HFT-level events (icebergs, hidden refills, tape bombs, exhaustion) the moment they happen and translates them into plain-English, color-coded alerts. No more “maybe there’s a big order” — you get told exactly what the smart money is doing.
SIGNALS Tab + Multi-Layer Confluence — When the AI Oracle, Whale Walls, footprint velocity, and exhaustion readings all line up… the probability of the next 10–30 tick move becomes ridiculously high.
Zero Lag, HyperLiquid Native — Everything is real-time on the actual CL contract. No delays, no fake 2D approximations.
This isn’t just another order-flow tool. This is the first platform that makes short-term price action feel almost… predictable.
If you’re tired of fighting the noise on flat charts, this is the edge.
Check it out here: https://metaquantuniverse.com/nexus
Who’s ready for the next one? 🔥
— MetaQuant Universe Team
Hey team,
Just dropped this live sequence on HyperLiquid’s CL (US Oil) contract inside 3D NEXUS META — and it’s one of the cleanest examples yet of how this platform turns short-term chaos into a predictable, high-probability setup.
We caught the move from 111.830 → 111.995 (basically +30 ticks) in a matter of minutes. No guesswork. No staring at flat 2D ladders. Just crystal-clear confluence from the 3D order flow + the NEXUS AI ORACLE doing what it’s built for.
Here’s exactly how it played out across the phases:
Phase 1 – Initial Buy Signal @ 111.83Strong WHALE WALL printed on the bid side. Multiple BUY signals lit up across the SIGNALS tab. The NEXUS AI ORACLE immediately flagged:
Iceberg Order (hidden liquidity stacking)
Ask Exhaustion (sellers losing steam)
Tape Bomb + rapid execution burst
The 3D visualization made it obvious — massive green buy-side liquidity stacking in real-time, with velocity and footprint bars showing aggressive absorption. That’s the moment we went long.
Phase 2 – First Leg Up (+15 ticks)Price ripped straight to 111.900+. The 3D order flow showed buyer dominance — big green blocks pushing through the ask ladder with almost no red resistance. The AI Oracle kept confirming “Buyers losing steam – upside risk at $112.XXX” while sellers were getting exhausted.
Phase 3 – Healthy PullbackClassic liquidity sweep. Price dipped back toward 111.81. But here’s where the 3D meta shines: even during the pullback, the WHALE WALL on the bid never broke. The AI Oracle stayed neutral-to-bullish, no new seller exhaustion alerts, just “hidden liquidity refill detected.” We held. The 3D depth map showed buyers quietly reloading below.
Phase 4 – Fresh Buy Signals @ 111.85New BUY $111.850 confirmation box popped with 79% EXHAUSTION reading. Multiple iceberg orders reappeared on the bid. The SIGNALS tab lit up again. This was the re-entry / add-on zone — same exact confluence as Phase 1, but with even stronger 3D footprint confirmation.
Phase 5 – Explosive ContinuationThe move accelerated. You could literally watch the 3D order flow “tilt” bullish — massive green volume blocks cascading upward, seller walls evaporating in real-time. The NEXUS AI ORACLE was screaming upside: Ask Exhaustion, Sellers losing steam, Tape Bomb events. Price flew toward 111.94–111.99 with almost zero hesitation.
Phase 6 – Target Hit+30 ticks secured. 112.000 zone almost touched. Take-profit executed perfectly.
Why 3D NEXUS META Made This Stupidly Easy
True 3D Order Flow — You don’t just see numbers on a ladder. You see liquidity as physical walls, velocity as movement, and absorption as real-time collisions in 3D space. Imbalances jump out instantly.
NEXUS AI ORACLE — This is the game-changer. It detects HFT-level events (icebergs, hidden refills, tape bombs, exhaustion) the moment they happen and translates them into plain-English, color-coded alerts. No more “maybe there’s a big order” — you get told exactly what the smart money is doing.
SIGNALS Tab + Multi-Layer Confluence — When the AI Oracle, Whale Walls, footprint velocity, and exhaustion readings all line up… the probability of the next 10–30 tick move becomes ridiculously high.
Zero Lag, HyperLiquid Native — Everything is real-time on the actual CL contract. No delays, no fake 2D approximations.
This isn’t just another order-flow tool. This is the first platform that makes short-term price action feel almost… predictable.
If you’re tired of fighting the noise on flat charts, this is the edge.
Check it out here: https://metaquantuniverse.com/nexus
Who’s ready for the next one? 🔥
— MetaQuant Universe Team
Metaquantuniverse
3D NEXUS META V8.5 — Predictive Order Flow Combat Cockpit
A browser-native 3D orderbook, prediction and execution cockpit for advanced traders.
❤1
This 2-screenshot USOIL sequence is a very clean example of how 3D NEXUS META can help spot a high-probability short-term reversal before the broader market fully reacts.
At the key 112.00 area, buyers were clearly pressing into the offer, but the structure was not behaving like a true breakout. On the contrary, the move was meeting heavy overhead supply, with dense sell-side liquidity stacked above price and no real acceptance through the level. That is a critical distinction. When aggressive buying reaches a major level but fails to lift and hold, it often signals that the upside auction is being absorbed, not expanded.
This is exactly where 3D NEXUS META becomes so powerful. Instead of watching candles after the rejection is obvious, the platform allows you to read the microstructure of failure in real time. The first screenshot shows a market attempting to push higher into 112, but the offer remains dominant. The breakout effort is capped. The buy-side initiative is not converting into continuation. Structurally, that is a serious warning sign for late buyers and a strong signal for short-term sellers.
Then the second screenshot confirms the rotation. Price snaps back quickly toward 111.83 / 111.825, showing that the attempted upside auction was rejected fast. And that speed matters. When the market falls away sharply after absorption at the highs, it usually means the breakout has failed and sellers have regained control of the very short-term auction.
What makes this setup especially valuable is that the short was not based on guesswork. It was based on visible order-flow logic:
• aggressive buyers pushing into resistance
• heavy offer-side liquidity holding firm
• no clean acceptance above 112
• failed breakout behavior
• immediate downside rotation back toward 111.825
That is the kind of sequence 3D NEXUS META reads exceptionally well.
The edge here is not just “catching a short.” The edge is understanding, in real time, that 112 was acting as a trap, not as a breakout.
This is the difference between reacting late to price and reading the market through liquidity, absorption, and auction failure.
On this USOIL move, the message was clear:
buyers hit the offer, got absorbed, failed to take 112, and price rotated lower fast.
That is exactly the kind of short-term structural read that makes 3D NEXUS META such a serious execution tool.
🔗 https://metaquantuniverse.com/nexus
At the key 112.00 area, buyers were clearly pressing into the offer, but the structure was not behaving like a true breakout. On the contrary, the move was meeting heavy overhead supply, with dense sell-side liquidity stacked above price and no real acceptance through the level. That is a critical distinction. When aggressive buying reaches a major level but fails to lift and hold, it often signals that the upside auction is being absorbed, not expanded.
This is exactly where 3D NEXUS META becomes so powerful. Instead of watching candles after the rejection is obvious, the platform allows you to read the microstructure of failure in real time. The first screenshot shows a market attempting to push higher into 112, but the offer remains dominant. The breakout effort is capped. The buy-side initiative is not converting into continuation. Structurally, that is a serious warning sign for late buyers and a strong signal for short-term sellers.
Then the second screenshot confirms the rotation. Price snaps back quickly toward 111.83 / 111.825, showing that the attempted upside auction was rejected fast. And that speed matters. When the market falls away sharply after absorption at the highs, it usually means the breakout has failed and sellers have regained control of the very short-term auction.
What makes this setup especially valuable is that the short was not based on guesswork. It was based on visible order-flow logic:
• aggressive buyers pushing into resistance
• heavy offer-side liquidity holding firm
• no clean acceptance above 112
• failed breakout behavior
• immediate downside rotation back toward 111.825
That is the kind of sequence 3D NEXUS META reads exceptionally well.
The edge here is not just “catching a short.” The edge is understanding, in real time, that 112 was acting as a trap, not as a breakout.
This is the difference between reacting late to price and reading the market through liquidity, absorption, and auction failure.
On this USOIL move, the message was clear:
buyers hit the offer, got absorbed, failed to take 112, and price rotated lower fast.
That is exactly the kind of short-term structural read that makes 3D NEXUS META such a serious execution tool.
🔗 https://metaquantuniverse.com/nexus
Metaquantuniverse
3D NEXUS META V8.5 — Predictive Order Flow Combat Cockpit
A browser-native 3D orderbook, prediction and execution cockpit for advanced traders.
❤2
This 3-screenshot USOIL sequence is a very clean example of how 3D NEXUS META helps traders not only identify a strong short-term continuation long, but also recognize a highly logical profit-taking zone as the move matures.
The first screenshot shows the market stabilizing around the 111.81 / 111.82 area, with the structure starting to shift in favor of buyers. What immediately stands out is that the market is not behaving like a weak bounce. The bid-side environment begins to look supported, while the flow context starts aligning with a bullish continuation scenario. The setup is not built on random price action. It is built on structure.
This is where 3D NEXUS META becomes extremely valuable. Instead of waiting for candles to confirm the move after the fact, the platform lets you read the auction as it is developing. In this case, the market starts to show a constructive buy-side framework: support is holding, sellers are losing traction, and the path higher begins to open.
The second screenshot confirms that bullish continuation very clearly. Price rotates higher from the 111.81 zone and extends cleanly toward 111.96, validating the initial read. At that point, the long has already delivered a very solid short-term move, and the internal structure remains favorable enough to support the continuation.
But the third screenshot is what makes the sequence even more interesting from a professional execution standpoint.
As price pushes into the 111.99 area, just under the 112.00 level, the market begins to show signs that the upside leg is becoming stretched. The structure overhead looks heavier, sell-side liquidity remains stacked above price, and the local behavior starts to reflect exhaustion near the highs rather than fresh expansion. That is a very important shift.
This is exactly the type of information that helps traders move from “good entry” to “good exit.”
Because in short-term trading, the edge is not only about spotting where the move begins. It is also about recognizing when the auction is reaching a less efficient area for holding longs, and when the reward on the buy side is no longer as attractive as it was earlier in the sequence.
From these 3 screenshots, the logic becomes very clear:
* buyers found support near 111.81 / 111.82
* the flow progressively aligned in favor of continuation
* price expanded cleanly toward 111.96
* and by 111.99, the market was offering a very logical take-profit zone for buyers already in position
That final phase matters a lot.
The push into 111.99 is not just another bullish print. It looks like a moment where the move has already delivered most of its short-term efficiency, while the surrounding structure starts to signal caution for late buyers. In other words, it becomes a very smart place to reduce exposure, lock gains, and avoid overstaying the trade directly into heavier overhead resistance.
This is one of the strongest advantages of 3D NEXUS META:
it helps traders understand both sides of execution quality,
where the move is being built,
and where the move is starting to lose its best asymmetry.
On this USOIL setup, the read was clean from start to finish:
support near 111.81, bullish continuation toward 111.96, then an excellent buyer take-profit window around 111.99.
That is what high-level short-term market reading looks like when liquidity, structure, and exhaustion are all visible in real time.
🔗 https://metaquantuniverse.com/nexus
The first screenshot shows the market stabilizing around the 111.81 / 111.82 area, with the structure starting to shift in favor of buyers. What immediately stands out is that the market is not behaving like a weak bounce. The bid-side environment begins to look supported, while the flow context starts aligning with a bullish continuation scenario. The setup is not built on random price action. It is built on structure.
This is where 3D NEXUS META becomes extremely valuable. Instead of waiting for candles to confirm the move after the fact, the platform lets you read the auction as it is developing. In this case, the market starts to show a constructive buy-side framework: support is holding, sellers are losing traction, and the path higher begins to open.
The second screenshot confirms that bullish continuation very clearly. Price rotates higher from the 111.81 zone and extends cleanly toward 111.96, validating the initial read. At that point, the long has already delivered a very solid short-term move, and the internal structure remains favorable enough to support the continuation.
But the third screenshot is what makes the sequence even more interesting from a professional execution standpoint.
As price pushes into the 111.99 area, just under the 112.00 level, the market begins to show signs that the upside leg is becoming stretched. The structure overhead looks heavier, sell-side liquidity remains stacked above price, and the local behavior starts to reflect exhaustion near the highs rather than fresh expansion. That is a very important shift.
This is exactly the type of information that helps traders move from “good entry” to “good exit.”
Because in short-term trading, the edge is not only about spotting where the move begins. It is also about recognizing when the auction is reaching a less efficient area for holding longs, and when the reward on the buy side is no longer as attractive as it was earlier in the sequence.
From these 3 screenshots, the logic becomes very clear:
* buyers found support near 111.81 / 111.82
* the flow progressively aligned in favor of continuation
* price expanded cleanly toward 111.96
* and by 111.99, the market was offering a very logical take-profit zone for buyers already in position
That final phase matters a lot.
The push into 111.99 is not just another bullish print. It looks like a moment where the move has already delivered most of its short-term efficiency, while the surrounding structure starts to signal caution for late buyers. In other words, it becomes a very smart place to reduce exposure, lock gains, and avoid overstaying the trade directly into heavier overhead resistance.
This is one of the strongest advantages of 3D NEXUS META:
it helps traders understand both sides of execution quality,
where the move is being built,
and where the move is starting to lose its best asymmetry.
On this USOIL setup, the read was clean from start to finish:
support near 111.81, bullish continuation toward 111.96, then an excellent buyer take-profit window around 111.99.
That is what high-level short-term market reading looks like when liquidity, structure, and exhaustion are all visible in real time.
🔗 https://metaquantuniverse.com/nexus
Metaquantuniverse
3D NEXUS META V8.5 — Predictive Order Flow Combat Cockpit
A browser-native 3D orderbook, prediction and execution cockpit for advanced traders.
🚨 New Video Dropped
THE CLEANEST USOIL BUY OF THE SESSION | 111.81 TO 112.00 | 3D NEXUS META
In this new breakdown, I show how 3D NEXUS META helped reveal a very clean USOIL buy opportunity on HyperLiquid Crude Oil, with key buy-side areas building around 111.81 / 111.83 / 111.85.
What makes this sequence so interesting is that the bullish move was not just visible after the fact. The structure was already developing inside the order flow, with the market progressively showing signs of support, continuation, and upside efficiency.
From there, price extended exactly where it had room to go, first into 111.96, then into 111.99, and finally right into the 112.00 area.
This is exactly why 3D NEXUS META is such a powerful tool for short-term traders.
It helps you read when a move is being built through:
* liquidity structure
* order-flow confirmation
* short-term imbalance
* buy-side support behavior
* real-time auction logic
This is not about chasing candles.
This is about understanding why a move has edge *before* the broader market fully reacts.
If you want to see how the 111.81 / 111.83 / 111.85 zone turned into one of the cleanest long opportunities of the session, and how the path toward 111.99 / 112.00 became readable through the internal structure of the market, this video is for you.
🔥 3D NEXUS META:
https://metaquantuniverse.com/nexus
THE CLEANEST USOIL BUY OF THE SESSION | 111.81 TO 112.00 | 3D NEXUS META
In this new breakdown, I show how 3D NEXUS META helped reveal a very clean USOIL buy opportunity on HyperLiquid Crude Oil, with key buy-side areas building around 111.81 / 111.83 / 111.85.
What makes this sequence so interesting is that the bullish move was not just visible after the fact. The structure was already developing inside the order flow, with the market progressively showing signs of support, continuation, and upside efficiency.
From there, price extended exactly where it had room to go, first into 111.96, then into 111.99, and finally right into the 112.00 area.
This is exactly why 3D NEXUS META is such a powerful tool for short-term traders.
It helps you read when a move is being built through:
* liquidity structure
* order-flow confirmation
* short-term imbalance
* buy-side support behavior
* real-time auction logic
This is not about chasing candles.
This is about understanding why a move has edge *before* the broader market fully reacts.
If you want to see how the 111.81 / 111.83 / 111.85 zone turned into one of the cleanest long opportunities of the session, and how the path toward 111.99 / 112.00 became readable through the internal structure of the market, this video is for you.
🔥 3D NEXUS META:
https://metaquantuniverse.com/nexus
Metaquantuniverse
3D NEXUS META V8.5 — Predictive Order Flow Combat Cockpit
A browser-native 3D orderbook, prediction and execution cockpit for advanced traders.