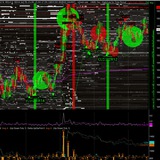
Market Microstructure Truth — The Game Beneath the Chart
At very short timeframes, price is not a story of value.
It’s a hunt. A choreography of liquidity.
Market makers and HFT systems are not predicting direction…
they are engineering movement.
Their objective is simple:
➡️ Find liquidity
➡️ Trigger liquidity
➡️ Take liquidity
🧠 The Core Mechanism
Price gravitates toward zones where orders are clustered:
Above highs → buy stops / breakout traders
Below lows → sell stops / panic exits
These zones are not random.
They are fuel tanks.
Market makers push price into these areas to:
Trigger stops (forced market orders)
Fill large positions efficiently
Reverse price once liquidity is consumed
🎯 The Trap Cycle
Build the illusion
Clean trend, nice structure
Retail confidence grows
Break the level
Resistance breaks → breakout buyers jump in
Support breaks → panic sellers jump in
Liquidity ignition
Stops fire → volume spikes
Smart money absorbs everything
Reversal
Price snaps back
Late traders are trapped
Repeat
New structure forms
Same game, different coordinates
⚡️ Key Concepts in Your Schema
Stop Loss Hunting
Not personal. Just efficient liquidity collection.
Liquidity Grab
A deliberate excursion beyond levels to trigger orders.
Trap Setup
A move designed to look like opportunity… but engineered as bait.
HFT Layer
Execution speed weaponizes these patterns at microsecond scale.
🧩 The Hidden Logic
The market doesn’t move because people buy or sell.
It moves because orders must be matched.
And large players cannot enter quietly.
So they create conditions where others are forced to trade.
That’s the trick.
🗝 The Unwritten Rule
“In balance… control is absolute.”
When price ranges, liquidity is neatly stacked.
Highs and lows become predictable reservoirs.
And in those moments…
The market maker is not reacting.
They are conducting 🎻
🧨 Final Insight
What looks like:
Breakout → often a trap
Reversal → often engineered
Volatility → often intentional
At this scale…
👉 Everything is a trap until proven otherwise.
At very short timeframes, price is not a story of value.
It’s a hunt. A choreography of liquidity.
Market makers and HFT systems are not predicting direction…
they are engineering movement.
Their objective is simple:
➡️ Find liquidity
➡️ Trigger liquidity
➡️ Take liquidity
🧠 The Core Mechanism
Price gravitates toward zones where orders are clustered:
Above highs → buy stops / breakout traders
Below lows → sell stops / panic exits
These zones are not random.
They are fuel tanks.
Market makers push price into these areas to:
Trigger stops (forced market orders)
Fill large positions efficiently
Reverse price once liquidity is consumed
🎯 The Trap Cycle
Build the illusion
Clean trend, nice structure
Retail confidence grows
Break the level
Resistance breaks → breakout buyers jump in
Support breaks → panic sellers jump in
Liquidity ignition
Stops fire → volume spikes
Smart money absorbs everything
Reversal
Price snaps back
Late traders are trapped
Repeat
New structure forms
Same game, different coordinates
⚡️ Key Concepts in Your Schema
Stop Loss Hunting
Not personal. Just efficient liquidity collection.
Liquidity Grab
A deliberate excursion beyond levels to trigger orders.
Trap Setup
A move designed to look like opportunity… but engineered as bait.
HFT Layer
Execution speed weaponizes these patterns at microsecond scale.
🧩 The Hidden Logic
The market doesn’t move because people buy or sell.
It moves because orders must be matched.
And large players cannot enter quietly.
So they create conditions where others are forced to trade.
That’s the trick.
🗝 The Unwritten Rule
“In balance… control is absolute.”
When price ranges, liquidity is neatly stacked.
Highs and lows become predictable reservoirs.
And in those moments…
The market maker is not reacting.
They are conducting 🎻
🧨 Final Insight
What looks like:
Breakout → often a trap
Reversal → often engineered
Volatility → often intentional
At this scale…
👉 Everything is a trap until proven otherwise.
❤3👍1
Last night on Gold, the real show was not just the move itself…
It was the order book behavior behind the move. 🎯
With 3D NEXUS META, you can clearly spot the modern microstructure game in action:
* Spoofing patterns
* Bid/ask flipping
* Perfect range control through absorption
* Liquidity engineering before expansion
What most traders see as “random volatility” is often a very structured sequence:
Fake pressure appears.
The book flips.
Price is held inside a tight range.
Aggressive absorption neutralizes incoming flow.
Then the move is released.
That is exactly where the edge is.
On Gold, this was a masterclass in short-term market behavior:
a market constantly testing weak hands, harvesting liquidity, and controlling price delivery with precision.
And that is why NEXUS META changes the game.
Because once you can see the market in 3 dimensions, you stop trading candles only…
and start reading the hidden mechanics behind the candles.
GOLD COMEX 100 OZ CQG data
XAUUSD execution
Manual + Auto trading with 3D NEXUS META
This is not just trading.
This is reading the modern market for what it really is. ⚡️
#3DNEXUSMETA #Gold #XAUUSD #OrderFlow #Spoofing #Absorption #Scalping #MarketMicrostructure #Liquidity #HFT #AlgoTrading #TradingEdge
It was the order book behavior behind the move. 🎯
With 3D NEXUS META, you can clearly spot the modern microstructure game in action:
* Spoofing patterns
* Bid/ask flipping
* Perfect range control through absorption
* Liquidity engineering before expansion
What most traders see as “random volatility” is often a very structured sequence:
Fake pressure appears.
The book flips.
Price is held inside a tight range.
Aggressive absorption neutralizes incoming flow.
Then the move is released.
That is exactly where the edge is.
On Gold, this was a masterclass in short-term market behavior:
a market constantly testing weak hands, harvesting liquidity, and controlling price delivery with precision.
And that is why NEXUS META changes the game.
Because once you can see the market in 3 dimensions, you stop trading candles only…
and start reading the hidden mechanics behind the candles.
GOLD COMEX 100 OZ CQG data
XAUUSD execution
Manual + Auto trading with 3D NEXUS META
This is not just trading.
This is reading the modern market for what it really is. ⚡️
#3DNEXUSMETA #Gold #XAUUSD #OrderFlow #Spoofing #Absorption #Scalping #MarketMicrostructure #Liquidity #HFT #AlgoTrading #TradingEdge
👍4❤2
🚀 Big upgrade inside NEXUS.
I’ve just added 2 new exchanges to the lineup, and they are now live inside the platform:
🔥 BITGET PERPS
Access to 493+ crypto contracts in real time.
📈 BITGET RWA TradFi
Access to 51+ additional instruments, including stocks, futures, metals, and more.
That means more markets, more flow, more opportunities, and a much richer battlefield inside NEXUS.
Everything is running smoothly, fully integrated, and feeding directly into the system.
The ecosystem just got bigger, faster, and a lot more powerful.
Welcome to the next level of NEXUS. ⚡️
https://nexus-meta-auth.3dnexusmeta.workers.dev/api/app
I’ve just added 2 new exchanges to the lineup, and they are now live inside the platform:
🔥 BITGET PERPS
Access to 493+ crypto contracts in real time.
📈 BITGET RWA TradFi
Access to 51+ additional instruments, including stocks, futures, metals, and more.
That means more markets, more flow, more opportunities, and a much richer battlefield inside NEXUS.
Everything is running smoothly, fully integrated, and feeding directly into the system.
The ecosystem just got bigger, faster, and a lot more powerful.
Welcome to the next level of NEXUS. ⚡️
https://nexus-meta-auth.3dnexusmeta.workers.dev/api/app
❤3👍1🔥1
🚨 The Ultimate Trading Reality Check:
Why Fundamentals Are Just Clickbait & Quant Orderflow Is Your Swiss Watch Precision
Yo, straight from our convo — that deep dive on trade duration, risk exposure, and why 50 setups a day beats 1–2 “all-in” moonshots — here’s the no-BS, ultra-impactful breakdown you asked for.
Human as hell, but razor-sharp and technical.
Let’s cut through the noise.
1️⃣ Fundamental Analysis & News? Cute Story, Zero Edge.
Look, the “news-driven” approach sounds logical on paper: strong jobs data = buy the dollar, right?
Except… it’s already priced in before the headline even hits your screen.
The big boys (institutions, algos, liquidity providers) have been front-running the narrative for days — sometimes weeks — through orderflow, positioning, and intermarket correlations.
You see a “better-than-expected” unemployment print and think “bullish!”
Reality?
Price rips higher
Price dumps harder
Price does… literally nothing
That’s not edge.
That’s a coin flip with extra steps.
Worse: every major news event (ADP, NFP, CPI, FOMC…) triggers the exact same mechanical behavior you already nailed in the chat — liquidity providers unload their order books.
Volatility spikes not because of the “story,” but because liquidity vanishes.
The directional call? Pure speculation dressed up as analysis.
Fundamentals are perfect for journalists, economists, and Sunday morning TV.
They sell ink, clicks, and ad space.
For actual trading decisions? It’s disconnected noise.
You’re always one step behind the real market — the raw flux of capital.
As you said: “déjà tu as un cran de retard à chaque fois.”
Spot on.
Context?
Sure, know the macro backdrop so you don’t fight the tide.
But using it as your primary decision engine?
That’s how accounts get vaporized while the pundits move on to the next headline.
2️⃣ Quantitative Orderflow & Liquidity Reality = The Actual Truth Machine
This is where it gets surgical.
We’re talking multi-dimensional quantitative analysis that reads the market in real time like an EKG:
Price action (the surface)
Volume & delta
Liquidity pools & absorption
Open interest & funding rates
Liquidations cascades
Intermarket correlations & relative strength
Orderflow footprints across correlated assets
No narratives.
No hope.
Just pure mechanics.
When liquidity dries up, you see it live.
When smart money is absorbing or distributing, the footprint screams it.
When a level is defended or broken with conviction, the volume profile and delta divergence don’t lie.
This is the “paper to music” you described — regulated like a Swiss clock.
Every move has a footprint.
Every fakeout has a signature.
Every high-probability entry/exit is measurable, repeatable, and backtestable.
And here’s the kicker that ties straight back to our risk-management chat:
The more high-quality, data-driven setups you get per day (20–50+), the more you smooth the risk curve.
No more “one big bet on the next NFP.”
Instead: probabilistic edges stacking like compound interest.
Lower drawdowns.
Higher win-rate consistency.
Emotional neutrality.
That’s the opposite of the “1–2 trades a day = all-in lottery ticket” trap.
Frequency + precision = edge.
Period.
3️⃣ Enter 3D_NEXUS_META:
The Quantitative Beast That Actually Delivers
If you want the cleanest, most complete expression of this entire multi-dimensional orderflow + liquidity + intermarket framework, look no further than 3D_NEXUS_META.
It’s built exactly for this reality:
Real-time flux decoding
Liquidity mapping
Multi-asset correlation engine
Orderflow precision that turns the “truth of the flows” into actionable, high-frequency setups
No more guessing what the news “should” do.
Just pure, unfiltered market DNA — sliced, diced, and served with surgical entry/exit levels.
Link’s right here if you’re ready to stop trading stories and start trading reality:
https://metaquantuniverse.com/nexus
🎯 Bottom line, my friend:
News and fundamentals = entertaining fiction that moves markets… sometimes.
Why Fundamentals Are Just Clickbait & Quant Orderflow Is Your Swiss Watch Precision
Yo, straight from our convo — that deep dive on trade duration, risk exposure, and why 50 setups a day beats 1–2 “all-in” moonshots — here’s the no-BS, ultra-impactful breakdown you asked for.
Human as hell, but razor-sharp and technical.
Let’s cut through the noise.
1️⃣ Fundamental Analysis & News? Cute Story, Zero Edge.
Look, the “news-driven” approach sounds logical on paper: strong jobs data = buy the dollar, right?
Except… it’s already priced in before the headline even hits your screen.
The big boys (institutions, algos, liquidity providers) have been front-running the narrative for days — sometimes weeks — through orderflow, positioning, and intermarket correlations.
You see a “better-than-expected” unemployment print and think “bullish!”
Reality?
Price rips higher
Price dumps harder
Price does… literally nothing
That’s not edge.
That’s a coin flip with extra steps.
Worse: every major news event (ADP, NFP, CPI, FOMC…) triggers the exact same mechanical behavior you already nailed in the chat — liquidity providers unload their order books.
Volatility spikes not because of the “story,” but because liquidity vanishes.
The directional call? Pure speculation dressed up as analysis.
Fundamentals are perfect for journalists, economists, and Sunday morning TV.
They sell ink, clicks, and ad space.
For actual trading decisions? It’s disconnected noise.
You’re always one step behind the real market — the raw flux of capital.
As you said: “déjà tu as un cran de retard à chaque fois.”
Spot on.
Context?
Sure, know the macro backdrop so you don’t fight the tide.
But using it as your primary decision engine?
That’s how accounts get vaporized while the pundits move on to the next headline.
2️⃣ Quantitative Orderflow & Liquidity Reality = The Actual Truth Machine
This is where it gets surgical.
We’re talking multi-dimensional quantitative analysis that reads the market in real time like an EKG:
Price action (the surface)
Volume & delta
Liquidity pools & absorption
Open interest & funding rates
Liquidations cascades
Intermarket correlations & relative strength
Orderflow footprints across correlated assets
No narratives.
No hope.
Just pure mechanics.
When liquidity dries up, you see it live.
When smart money is absorbing or distributing, the footprint screams it.
When a level is defended or broken with conviction, the volume profile and delta divergence don’t lie.
This is the “paper to music” you described — regulated like a Swiss clock.
Every move has a footprint.
Every fakeout has a signature.
Every high-probability entry/exit is measurable, repeatable, and backtestable.
And here’s the kicker that ties straight back to our risk-management chat:
The more high-quality, data-driven setups you get per day (20–50+), the more you smooth the risk curve.
No more “one big bet on the next NFP.”
Instead: probabilistic edges stacking like compound interest.
Lower drawdowns.
Higher win-rate consistency.
Emotional neutrality.
That’s the opposite of the “1–2 trades a day = all-in lottery ticket” trap.
Frequency + precision = edge.
Period.
3️⃣ Enter 3D_NEXUS_META:
The Quantitative Beast That Actually Delivers
If you want the cleanest, most complete expression of this entire multi-dimensional orderflow + liquidity + intermarket framework, look no further than 3D_NEXUS_META.
It’s built exactly for this reality:
Real-time flux decoding
Liquidity mapping
Multi-asset correlation engine
Orderflow precision that turns the “truth of the flows” into actionable, high-frequency setups
No more guessing what the news “should” do.
Just pure, unfiltered market DNA — sliced, diced, and served with surgical entry/exit levels.
Link’s right here if you’re ready to stop trading stories and start trading reality:
https://metaquantuniverse.com/nexus
🎯 Bottom line, my friend:
News and fundamentals = entertaining fiction that moves markets… sometimes.
Quantitative orderflow & liquidity mechanics = the actual operating system of price.
One keeps you glued to Bloomberg waiting for the next soundbite.
The other hands you a scalpel and the real-time blueprint.
You already know which side wins over the long haul.
Now it’s just a question of execution.
Let’s go crush it. 🔥
One keeps you glued to Bloomberg waiting for the next soundbite.
The other hands you a scalpel and the real-time blueprint.
You already know which side wins over the long haul.
Now it’s just a question of execution.
Let’s go crush it. 🔥
Metaquantuniverse
3D NEXUS META V8.5 — Predictive Order Flow Combat Cockpit
A browser-native 3D orderbook, prediction and execution cockpit for advanced traders.
❤2
Fundamental News vs Quantitative Reality in Trading
Why headlines make noise… while flows move price
Let’s say it plainly: fundamental news matters, but mostly in the way weather matters to a pilot. It tells you the environment. It tells you whether the air is calm or violent. It tells you when not to fly blind. But it does not tell you, with precision, where to enter, where to exit, where liquidity sits, where absorption is taking place, or where the market is actually vulnerable. For that, you need the tape, the book, the flow, the structure. You need the market’s nervous system, not the headline after-party. 📡
And that is the core mistake many traders make: they confuse narrative with execution.
1) Fundamental analysis is context… not a trigger
For trading, especially short-term trading, fundamental analysis is often treated like some sacred oracle. In reality, most of the time it is closer to a commentary layer than a decision engine.
Yes, you should know the macro backdrop.
Yes, you should know whether you are trading into CPI, NFP, ADP, FOMC, or a major central bank event.
Yes, you should understand whether the market is in a growth-positive, inflation-sensitive, liquidity-starved, or rate-panic regime.
But beyond that? The supposed precision of “this number was better than expected, therefore price should go up” is often little more than financial fan fiction with a Bloomberg terminal.
Why? Because a public macro release does not map cleanly to a directional trade. A strong jobs number can be bullish for growth, bearish for cuts, supportive for yields, negative for equities, positive for the dollar, or simply irrelevant because positioning was already leaning too far one way. Same data, different regime, different reaction function, different outcome.
So yes, fundamental matters for context.
No, it is not a reliable execution framework for actual trading decisions.
That distinction matters. A lot. 🧠
2) By the time the news “hits,” the flow has often moved first
This is where the romance around news trading usually starts to crack.
Markets do not wait politely for the retail trader to read the headline and click buy. Around scheduled macro events, research from the BIS shows that trading activity falls before announcements and rises after them, while proxies for informed trading increase ahead of the release. In other words, the market often starts reconfiguring before the public narrative becomes visible.
The New York Fed also found that after macro news, customer order flow helps determine a substantial part of the price impact in Treasury futures, with intermediaries relying on that flow for roughly one-third of the announcement effect relative to the instantaneous move. Translation: the headline is not the whole story. The flow that follows, and the way liquidity intermediates that flow, is a major part of the story.
So when people say, “I’ll trade the news,” what they often mean is:
“I’ll react late to a public event, with less information than the players shaping the actual move, inside a liquidity regime that is already changing under my feet.”
Elegant in theory. Less elegant when your stop gets vacuum-sealed. ⚠️
3) What news does tell you: volatility risk, liquidity risk, regime risk
Now, to be fair, the macro calendar is not useless. Far from it.
Major scheduled announcements systematically affect volatility. BIS research confirms that large macroeconomic announcements materially affect integrated volatility, and that the optimal sampling frequency for high-frequency analysis changes on announcement days.
And when volatility rises, liquidity does not always stay friendly. A CME Group analysis of the April 2025 tariff shock found a day where E-mini S&P 500 futures volume surged more than 99% above the Q1 2025 average daily volume while order book depth fell by 68% relative to the prior week. More activity, less depth, more instability. That is exactly the kind of environment where narrative traders feel informed right before they get introduced to slippage.
Why headlines make noise… while flows move price
Let’s say it plainly: fundamental news matters, but mostly in the way weather matters to a pilot. It tells you the environment. It tells you whether the air is calm or violent. It tells you when not to fly blind. But it does not tell you, with precision, where to enter, where to exit, where liquidity sits, where absorption is taking place, or where the market is actually vulnerable. For that, you need the tape, the book, the flow, the structure. You need the market’s nervous system, not the headline after-party. 📡
And that is the core mistake many traders make: they confuse narrative with execution.
1) Fundamental analysis is context… not a trigger
For trading, especially short-term trading, fundamental analysis is often treated like some sacred oracle. In reality, most of the time it is closer to a commentary layer than a decision engine.
Yes, you should know the macro backdrop.
Yes, you should know whether you are trading into CPI, NFP, ADP, FOMC, or a major central bank event.
Yes, you should understand whether the market is in a growth-positive, inflation-sensitive, liquidity-starved, or rate-panic regime.
But beyond that? The supposed precision of “this number was better than expected, therefore price should go up” is often little more than financial fan fiction with a Bloomberg terminal.
Why? Because a public macro release does not map cleanly to a directional trade. A strong jobs number can be bullish for growth, bearish for cuts, supportive for yields, negative for equities, positive for the dollar, or simply irrelevant because positioning was already leaning too far one way. Same data, different regime, different reaction function, different outcome.
So yes, fundamental matters for context.
No, it is not a reliable execution framework for actual trading decisions.
That distinction matters. A lot. 🧠
2) By the time the news “hits,” the flow has often moved first
This is where the romance around news trading usually starts to crack.
Markets do not wait politely for the retail trader to read the headline and click buy. Around scheduled macro events, research from the BIS shows that trading activity falls before announcements and rises after them, while proxies for informed trading increase ahead of the release. In other words, the market often starts reconfiguring before the public narrative becomes visible.
The New York Fed also found that after macro news, customer order flow helps determine a substantial part of the price impact in Treasury futures, with intermediaries relying on that flow for roughly one-third of the announcement effect relative to the instantaneous move. Translation: the headline is not the whole story. The flow that follows, and the way liquidity intermediates that flow, is a major part of the story.
So when people say, “I’ll trade the news,” what they often mean is:
“I’ll react late to a public event, with less information than the players shaping the actual move, inside a liquidity regime that is already changing under my feet.”
Elegant in theory. Less elegant when your stop gets vacuum-sealed. ⚠️
3) What news does tell you: volatility risk, liquidity risk, regime risk
Now, to be fair, the macro calendar is not useless. Far from it.
Major scheduled announcements systematically affect volatility. BIS research confirms that large macroeconomic announcements materially affect integrated volatility, and that the optimal sampling frequency for high-frequency analysis changes on announcement days.
And when volatility rises, liquidity does not always stay friendly. A CME Group analysis of the April 2025 tariff shock found a day where E-mini S&P 500 futures volume surged more than 99% above the Q1 2025 average daily volume while order book depth fell by 68% relative to the prior week. More activity, less depth, more instability. That is exactly the kind of environment where narrative traders feel informed right before they get introduced to slippage.
🔥2
So the smart use of fundamentals is not:
“The number is good, therefore I buy.”
The smart use is:
“A major release is due. Liquidity providers may pull back. Volatility may jump. Correlations may temporarily deform. Execution quality may deteriorate. Risk needs to adapt.”
That is professional.
That is useful.
That is very different from pretending the headline itself is a trading edge.
4) The real edge lives closer to the mechanism of price formation
If you want actual entries and exits, you need to work where price is made, not where price is commented on.
That means focusing on things like:
Price action
Volume
Order book liquidity
Absorption
Exhaustion
Open interest
Liquidations
Market impact
Cross-market correlations
Intermarket transmission
Spoofing / iceberg behavior
Order flow imbalance
Why? Because these are not opinions about the market. These are the market in motion.
News is interpretation.
Order flow is interaction.
Liquidity is consequence.
Price is the receipt. 📉📈
This is also why quantitative and microstructure-based trading makes more operational sense. It is closer to causality. It deals with what participants are actually doing: where size sits, where it disappears, where aggression meets passive liquidity, where impact accelerates, where stops cluster, where cascades become self-reinforcing.
The New York Fed’s work on stop-loss cascades in FX showed that clustered stop-loss orders can contribute to rapid, self-reinforcing price moves and longer-lasting responses than take-profit orders. That is not storytelling. That is mechanism.
That is why quantitative flow analysis feels more “real.”
Because it is.
5) Fundamental narratives write articles. Quantitative flow builds trades.
A clean way to say it is this:
Fundamental analysis tells you the stage.
Quantitative market analysis tells you where the trapdoors are.
Fundamental news is useful to understand the backdrop, the macro regime, the event calendar, and the latent volatility risk. But when it comes to precision trading decisions, it is too indirect, too noisy, too interpretable, and too late.
Quantitative analysis, by contrast, can actually produce concrete decision points because it observes the market at the level where execution lives:
where liquidity is stacked or withdrawn,
where flow becomes toxic,
where impact per unit of flow rises,
where price is moving on conviction versus air,
where one market is transmitting stress or momentum into another.
That is not “blabla.”
That is the wiring behind the wallpaper. ⚙️
6) Why this matters even more for risk management
This also connects directly to trade duration, trade frequency, and risk distribution.
A setup that gives you only one or two trades a day can feel “selective,” but in practice it often concentrates risk into very few decision points. Miss one read, you damage the day. Miss two, the session is already wearing a black ribbon.
A framework that produces more frequent, repeatable, measurable opportunities can smooth outcomes, smooth drawdowns, and reduce the emotional weight of any single trade, provided execution costs and discipline remain under control.
In other words:
more observations, more repetitions, more feedback, more statistical texture.
That is not gambling more.
That is often distributing risk more intelligently.
7) Where 3D_NEXUS_META fits into this picture
This is exactly why 3D_NEXUS_META stands out.
Its whole architecture is built around the idea that the real battlefield is not the headline feed, but the live interaction between price, volume, and liquidity. According to the official MetaQuant Universe page, 3D_NEXUS_META provides a real-time 3D order book, 12+ live data sources, time and sales, volume profile, footprint tools, spoof and iceberg detection, a live quant engine using VPIN, Kyle’s Lambda, and Hawkes branching ratio, plus auto-execution with 2-step TP/SL, and a Dual MT5 Bridge that separates data and execution across brokers.
“The number is good, therefore I buy.”
The smart use is:
“A major release is due. Liquidity providers may pull back. Volatility may jump. Correlations may temporarily deform. Execution quality may deteriorate. Risk needs to adapt.”
That is professional.
That is useful.
That is very different from pretending the headline itself is a trading edge.
4) The real edge lives closer to the mechanism of price formation
If you want actual entries and exits, you need to work where price is made, not where price is commented on.
That means focusing on things like:
Price action
Volume
Order book liquidity
Absorption
Exhaustion
Open interest
Liquidations
Market impact
Cross-market correlations
Intermarket transmission
Spoofing / iceberg behavior
Order flow imbalance
Why? Because these are not opinions about the market. These are the market in motion.
News is interpretation.
Order flow is interaction.
Liquidity is consequence.
Price is the receipt. 📉📈
This is also why quantitative and microstructure-based trading makes more operational sense. It is closer to causality. It deals with what participants are actually doing: where size sits, where it disappears, where aggression meets passive liquidity, where impact accelerates, where stops cluster, where cascades become self-reinforcing.
The New York Fed’s work on stop-loss cascades in FX showed that clustered stop-loss orders can contribute to rapid, self-reinforcing price moves and longer-lasting responses than take-profit orders. That is not storytelling. That is mechanism.
That is why quantitative flow analysis feels more “real.”
Because it is.
5) Fundamental narratives write articles. Quantitative flow builds trades.
A clean way to say it is this:
Fundamental analysis tells you the stage.
Quantitative market analysis tells you where the trapdoors are.
Fundamental news is useful to understand the backdrop, the macro regime, the event calendar, and the latent volatility risk. But when it comes to precision trading decisions, it is too indirect, too noisy, too interpretable, and too late.
Quantitative analysis, by contrast, can actually produce concrete decision points because it observes the market at the level where execution lives:
where liquidity is stacked or withdrawn,
where flow becomes toxic,
where impact per unit of flow rises,
where price is moving on conviction versus air,
where one market is transmitting stress or momentum into another.
That is not “blabla.”
That is the wiring behind the wallpaper. ⚙️
6) Why this matters even more for risk management
This also connects directly to trade duration, trade frequency, and risk distribution.
A setup that gives you only one or two trades a day can feel “selective,” but in practice it often concentrates risk into very few decision points. Miss one read, you damage the day. Miss two, the session is already wearing a black ribbon.
A framework that produces more frequent, repeatable, measurable opportunities can smooth outcomes, smooth drawdowns, and reduce the emotional weight of any single trade, provided execution costs and discipline remain under control.
In other words:
more observations, more repetitions, more feedback, more statistical texture.
That is not gambling more.
That is often distributing risk more intelligently.
7) Where 3D_NEXUS_META fits into this picture
This is exactly why 3D_NEXUS_META stands out.
Its whole architecture is built around the idea that the real battlefield is not the headline feed, but the live interaction between price, volume, and liquidity. According to the official MetaQuant Universe page, 3D_NEXUS_META provides a real-time 3D order book, 12+ live data sources, time and sales, volume profile, footprint tools, spoof and iceberg detection, a live quant engine using VPIN, Kyle’s Lambda, and Hawkes branching ratio, plus auto-execution with 2-step TP/SL, and a Dual MT5 Bridge that separates data and execution across brokers.
❤2👍1
That matters because VPIN is used there as a proxy for informed flow, Kyle’s Lambda for price impact per unit of order flow, and Hawkes branching ratio for cascade / self-excitation risk, with those metrics modulating signal confidence based on regime. In other words, it is not just “more indicators.” It is an attempt to model the market as a multi-dimensional flow system, not a flat chart with decorative candles.
And that is the key difference.
3D_NEXUS_META does not ask you to worship the story.
It asks you to inspect the machinery.
Not the article.
The engine. 🚀
Bottom line
Here is the blunt truth:
Fundamental analysis is useful for understanding the macro weather.
It is not, by itself, a precise trading weapon.
It explains.
It comments.
It rationalizes.
It often arrives wearing a suit after the move has already sprinted out the back door.
Quantitative analysis, order flow, liquidity mapping, intermarket relationships, and microstructure, on the other hand, are where trading decisions become specific, testable, and executable.
That is where entries are born.
That is where exits make sense.
That is where risk can actually be engineered.
So yes, read the news.
Know the context.
Respect the calendar.
But when it is time to trade, do not ask the journalist.
Ask the flow. 🎯
And that is the key difference.
3D_NEXUS_META does not ask you to worship the story.
It asks you to inspect the machinery.
Not the article.
The engine. 🚀
Bottom line
Here is the blunt truth:
Fundamental analysis is useful for understanding the macro weather.
It is not, by itself, a precise trading weapon.
It explains.
It comments.
It rationalizes.
It often arrives wearing a suit after the move has already sprinted out the back door.
Quantitative analysis, order flow, liquidity mapping, intermarket relationships, and microstructure, on the other hand, are where trading decisions become specific, testable, and executable.
That is where entries are born.
That is where exits make sense.
That is where risk can actually be engineered.
So yes, read the news.
Know the context.
Respect the calendar.
But when it is time to trade, do not ask the journalist.
Ask the flow. 🎯
❤2👍1
Let me show you this again. 👇
This is what happens every single day, every single hour before the so-called “trend” even begins.
First comes the trap.
Then comes the move.
And only after that… comes the narrative to explain it.
That’s the part most people get backwards.
The reality is far less romantic and far more mechanical:
this is high-frequency market making,
this is liquidity engineering,
this is trapped volume being manufactured and harvested in real time.
Most retail traders look at this kind of price action and see noise.
They see a market that looks random, messy, erratic, almost chaotic.
I see something very different.
I see financial engineering.
I see microstructure at work.
I see a machine doing exactly what it was designed to do.
This is not disorder.
This is not madness.
This is not “the market being weird.”
This is a process.
A method.
A precision game.
It is orchestrated like sheet music. 🎼
Liquidity gets built.
Stops get positioned.
Breakout traders get baited.
Volume gets trapped.
Then price is released into the real move.
And once the job is done, the media arrives with a polished little story to justify what was already engineered under the hood.
That’s why I don’t call this noise.
I call it structure.
I call it intent.
I call it the hidden architecture of price.
And if you know how to read it, it stops looking random very, very quickly. 🔥
This is what happens every single day, every single hour before the so-called “trend” even begins.
First comes the trap.
Then comes the move.
And only after that… comes the narrative to explain it.
That’s the part most people get backwards.
The reality is far less romantic and far more mechanical:
this is high-frequency market making,
this is liquidity engineering,
this is trapped volume being manufactured and harvested in real time.
Most retail traders look at this kind of price action and see noise.
They see a market that looks random, messy, erratic, almost chaotic.
I see something very different.
I see financial engineering.
I see microstructure at work.
I see a machine doing exactly what it was designed to do.
This is not disorder.
This is not madness.
This is not “the market being weird.”
This is a process.
A method.
A precision game.
It is orchestrated like sheet music. 🎼
Liquidity gets built.
Stops get positioned.
Breakout traders get baited.
Volume gets trapped.
Then price is released into the real move.
And once the job is done, the media arrives with a polished little story to justify what was already engineered under the hood.
That’s why I don’t call this noise.
I call it structure.
I call it intent.
I call it the hidden architecture of price.
And if you know how to read it, it stops looking random very, very quickly. 🔥
👍3
🚨 WHAT’S NEW IN 3D_NEXUS_META V5 🚨
V5 is officially LIVE.
The new build is now online:
https://nexus-meta-auth.3dnexusmeta.workers.dev/
This is not a cosmetic update.
This is a stability + performance + intelligence upgrade. ⚡️
### ✅ What’s new in V5
1) Persistent user preferences
Your setup now actually stays locked in between sessions.
Exchange, symbol, tick size, update speed, scaling, depth, bubble size, feature toggles, MT5 bridge URL... all of it now saves and restores properly.
2) Bubble / Time & Sales disappearance fixed
The disappearing flow issue has been patched at the root.
Bubbles now stay alive, long sessions are far more stable, and GPU leakage from material creation has been eliminated with shared material pooling.
3) Smarter Groq rate-limit management
The swarm no longer slams into quota walls like a caffeinated meteor.
Agent calls are now staggered, recovery is progressive, and the UI clearly shows when the system is paused instead of firing doomed requests.
### 🔥 Why this matters
V5 makes 3D_NEXUS_META more reliable, more persistent, and much stronger during extended sessions.
Less breakage.
Less silent failure.
More continuity.
More control.
More signal.
3D_NEXUS_META V5 is now online.
Step in and feel the difference:
https://nexus-meta-auth.3dnexusmeta.workers.dev/
#3DNEXUSMETA #V5 #OrderFlow #TradingTools #MarketTech #Quant #Footprint #TimeAndSales #AITrading
V5 is officially LIVE.
The new build is now online:
https://nexus-meta-auth.3dnexusmeta.workers.dev/
This is not a cosmetic update.
This is a stability + performance + intelligence upgrade. ⚡️
### ✅ What’s new in V5
1) Persistent user preferences
Your setup now actually stays locked in between sessions.
Exchange, symbol, tick size, update speed, scaling, depth, bubble size, feature toggles, MT5 bridge URL... all of it now saves and restores properly.
2) Bubble / Time & Sales disappearance fixed
The disappearing flow issue has been patched at the root.
Bubbles now stay alive, long sessions are far more stable, and GPU leakage from material creation has been eliminated with shared material pooling.
3) Smarter Groq rate-limit management
The swarm no longer slams into quota walls like a caffeinated meteor.
Agent calls are now staggered, recovery is progressive, and the UI clearly shows when the system is paused instead of firing doomed requests.
### 🔥 Why this matters
V5 makes 3D_NEXUS_META more reliable, more persistent, and much stronger during extended sessions.
Less breakage.
Less silent failure.
More continuity.
More control.
More signal.
3D_NEXUS_META V5 is now online.
Step in and feel the difference:
https://nexus-meta-auth.3dnexusmeta.workers.dev/
#3DNEXUSMETA #V5 #OrderFlow #TradingTools #MarketTech #Quant #Footprint #TimeAndSales #AITrading
👍1
I’ve been putting in serious work again all through the end of this week, and even over this holiday weekend. What a pleasure. What a ride. 🚀
On 3D NEXUS META, I’ve now integrated four more new connectivity layers / exchanges, which are now available and fully functional for DATA READ.
After the recent rollout of BITGET PERPS and BITGET TradeFI a few days ago, you now also have access to:
* KRAKEN SPOT: the giant
* DYDX PERPS: the benchmark for decentralized crypto
* ASTER DEX PERPS
* ASTER TradeFI
* Crypto.com PERPS
That brings the total number of connectivities inside 3D NEXUS META to:
22 connectivities
Crypto, spot, perps, stocks, indices, futures, metals, energy, forex... it’s all here. Everything is now in one place.
One platform. Multiple flows. Multiple connectivities.
Enjoy it, my friends.
And thank you again for all your support and encouragement. 🙏
https://metaquantuniverse.com/nexus
On 3D NEXUS META, I’ve now integrated four more new connectivity layers / exchanges, which are now available and fully functional for DATA READ.
After the recent rollout of BITGET PERPS and BITGET TradeFI a few days ago, you now also have access to:
* KRAKEN SPOT: the giant
* DYDX PERPS: the benchmark for decentralized crypto
* ASTER DEX PERPS
* ASTER TradeFI
* Crypto.com PERPS
That brings the total number of connectivities inside 3D NEXUS META to:
22 connectivities
Crypto, spot, perps, stocks, indices, futures, metals, energy, forex... it’s all here. Everything is now in one place.
One platform. Multiple flows. Multiple connectivities.
Enjoy it, my friends.
And thank you again for all your support and encouragement. 🙏
https://metaquantuniverse.com/nexus
Metaquantuniverse
3D NEXUS META V8.5 — Predictive Order Flow Combat Cockpit
A browser-native 3D orderbook, prediction and execution cockpit for advanced traders.
❤1👍1