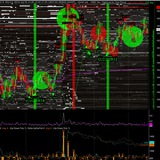
WHO’S BUYING THOSE MASSIVE OFFERS? 😏☠️
Look at the book: giant offer walls sitting overhead like “infinite supply”.
If you’re chasing buys into that, ask yourself one thing:
Are you trading… or are you the exit liquidity?
Because this is how it works:
They display size to freeze you.
They pin price under the ceiling.
They harvest your market orders while you feel “safe”.
And when it’s done… you realize you were just cannon fodder for the house.
The tape doesn’t care about your hope.
It cares about who controls the inventory.
Enjoy. Learn. Don’t be the liquidity. 🧭🔥
#GOLD #orderflow #marketmaking #microstructure #HFT #meta_quant
Look at the book: giant offer walls sitting overhead like “infinite supply”.
If you’re chasing buys into that, ask yourself one thing:
Are you trading… or are you the exit liquidity?
Because this is how it works:
They display size to freeze you.
They pin price under the ceiling.
They harvest your market orders while you feel “safe”.
And when it’s done… you realize you were just cannon fodder for the house.
The tape doesn’t care about your hope.
It cares about who controls the inventory.
Enjoy. Learn. Don’t be the liquidity. 🧭🔥
#GOLD #orderflow #marketmaking #microstructure #HFT #meta_quant
META_quant 4D replay (chronological): the whole sequence, tape by tape
Legend (what you’re looking at in META_quant 4D):
Cyan blocks = bids (passive demand)
Magenta blocks = offers (passive supply)
Big vertical slabs/pillars = displayed liquidity walls (size + placement)
The “life” of a wall = the clue: does it sit and get hit, or flash and vanish?
Volume vs price impact: heavy prints with no movement = absorption. Small volume with big movement = liquidity vacuum.
1) $4635: “Massive bid reloaded”
At $4635.45, the book shows thick cyan support repeatedly sitting under price.
This is market making 101:
Sell pressure comes in, but price does not cascade.
Why? Because the bid keeps reloading (passive buyers replenishing the queue).
Result: high traded volume, low downside movement = absorption on the bid.
Translation: the downside is being bought without advertising it on the chart. The tape is being stabilized.
2) $4639: “Bid filled / inventory rotation”
At $4639.22, price grinds up into a denser zone.
The bid that supported earlier starts to look partially consumed / rotated.
Market makers typically absorb, then recycle inventory higher.
You get a “controlled lift”: price rises, but it still feels “heavy” because supply is already being prepared overhead.
Volume-price impact read: still efficient, not explosive. The move is engineered, not emotional.
3) $4643: “Climb continues, book thickens”
At $4643.09, you can see both sides building:
Bids remain present, but offers start stacking more aggressively.
This is often the transition from “supporting the tape” to “preparing the ceiling”.
Key tell: the market is climbing, but the offer-side structure is getting more intimidating.
4) $4645: “Absorption at the offer”
At $4645.08, the picture becomes clearer: magenta overhead thickens.
Buy flow hits the offer, but price struggles to extend.
That is offer absorption: aggressive buyers are being fed into passive sellers.
Volume-price impact read: buys print, but uplift is weak. That’s the signature of absorption.
This is where retail brains say “breakout soon”.
This is where market makers say “thanks for the liquidity”.
5) $4647: “Hard cap, distribution starts”
At $4647.13 / $4647.19 (“ça bloque” + sell signal), the ceiling becomes violent:
A massive offer wall sits right above price.
Buyers keep trying, but they’re getting stuffed.
You even get sell signal timing while price is pinned under that supply.
This is the classic distribution zone:
The tape looks “strong” (still high),
But the orderflow is screaming “buyers are being used”.
This is where the trap gets built.
6) $4641: “Trapdoor moment (liquidity vacuum)”
Then comes the flip to $4641.20.
What changed?
Either the bid stops reloading, gets pulled, or gets overwhelmed.
Once that support behavior disappears, price doesn’t “walk down”.
It falls through gaps.
Volume-price impact read: you can get a sharp drop with less visible effort because the book is suddenly thin.
That’s not “more selling”. That’s less support.
7) $4630 then $4619: “Offer spoof-style pressure + follow-through”
At $4630.58 and later $4619.70, you get the uglier part:
Huge offers appear overhead (tall magenta pillars).
Many of these walls look short-lived, appearing and disappearing fast.
That’s spoof-like / layering behavior: not there to get filled, there to lean the tape lower and intimidate bids.
Mechanically:
Flash supply above price → buyers hesitate → price leans down
Cancel when threatened → re-post higher/lower → repeat
The impact is real, the liquidity is questionable.
End result: downside continuation fueled by psychology + structure, not just raw aggression.
The full story in one line
Bids reload and absorb to lift price… then offers stack and absorb the buys… then support steps away… then the market drops through a vacuum while spoof-style offer pressure keeps the tape pinned.
What META_quant 4D makes obvious (the “edge”)
Absorption is visible: lots of interaction, little movement.
Legend (what you’re looking at in META_quant 4D):
Cyan blocks = bids (passive demand)
Magenta blocks = offers (passive supply)
Big vertical slabs/pillars = displayed liquidity walls (size + placement)
The “life” of a wall = the clue: does it sit and get hit, or flash and vanish?
Volume vs price impact: heavy prints with no movement = absorption. Small volume with big movement = liquidity vacuum.
1) $4635: “Massive bid reloaded”
At $4635.45, the book shows thick cyan support repeatedly sitting under price.
This is market making 101:
Sell pressure comes in, but price does not cascade.
Why? Because the bid keeps reloading (passive buyers replenishing the queue).
Result: high traded volume, low downside movement = absorption on the bid.
Translation: the downside is being bought without advertising it on the chart. The tape is being stabilized.
2) $4639: “Bid filled / inventory rotation”
At $4639.22, price grinds up into a denser zone.
The bid that supported earlier starts to look partially consumed / rotated.
Market makers typically absorb, then recycle inventory higher.
You get a “controlled lift”: price rises, but it still feels “heavy” because supply is already being prepared overhead.
Volume-price impact read: still efficient, not explosive. The move is engineered, not emotional.
3) $4643: “Climb continues, book thickens”
At $4643.09, you can see both sides building:
Bids remain present, but offers start stacking more aggressively.
This is often the transition from “supporting the tape” to “preparing the ceiling”.
Key tell: the market is climbing, but the offer-side structure is getting more intimidating.
4) $4645: “Absorption at the offer”
At $4645.08, the picture becomes clearer: magenta overhead thickens.
Buy flow hits the offer, but price struggles to extend.
That is offer absorption: aggressive buyers are being fed into passive sellers.
Volume-price impact read: buys print, but uplift is weak. That’s the signature of absorption.
This is where retail brains say “breakout soon”.
This is where market makers say “thanks for the liquidity”.
5) $4647: “Hard cap, distribution starts”
At $4647.13 / $4647.19 (“ça bloque” + sell signal), the ceiling becomes violent:
A massive offer wall sits right above price.
Buyers keep trying, but they’re getting stuffed.
You even get sell signal timing while price is pinned under that supply.
This is the classic distribution zone:
The tape looks “strong” (still high),
But the orderflow is screaming “buyers are being used”.
This is where the trap gets built.
6) $4641: “Trapdoor moment (liquidity vacuum)”
Then comes the flip to $4641.20.
What changed?
Either the bid stops reloading, gets pulled, or gets overwhelmed.
Once that support behavior disappears, price doesn’t “walk down”.
It falls through gaps.
Volume-price impact read: you can get a sharp drop with less visible effort because the book is suddenly thin.
That’s not “more selling”. That’s less support.
7) $4630 then $4619: “Offer spoof-style pressure + follow-through”
At $4630.58 and later $4619.70, you get the uglier part:
Huge offers appear overhead (tall magenta pillars).
Many of these walls look short-lived, appearing and disappearing fast.
That’s spoof-like / layering behavior: not there to get filled, there to lean the tape lower and intimidate bids.
Mechanically:
Flash supply above price → buyers hesitate → price leans down
Cancel when threatened → re-post higher/lower → repeat
The impact is real, the liquidity is questionable.
End result: downside continuation fueled by psychology + structure, not just raw aggression.
The full story in one line
Bids reload and absorb to lift price… then offers stack and absorb the buys… then support steps away… then the market drops through a vacuum while spoof-style offer pressure keeps the tape pinned.
What META_quant 4D makes obvious (the “edge”)
Absorption is visible: lots of interaction, little movement.
👍1
Distribution is visible: price holds up while buyers get fed into supply.
The real danger is not selling. It’s when bids stop replenishing.
Spoof-style walls are about lifetime, not size. Big size + short lifetime = suspicion.
Courage. 🧭
Follow the compass, not the candles.
#GOLD #orderflow #marketmaking #microstructure #HFT #meta_quant
The real danger is not selling. It’s when bids stop replenishing.
Spoof-style walls are about lifetime, not size. Big size + short lifetime = suspicion.
Courage. 🧭
Follow the compass, not the candles.
#GOLD #orderflow #marketmaking #microstructure #HFT #meta_quant
👍1
How to spot a REAL support (META_quant 4D)
Simple. Brutal. Scalp-ready. 🧭
A “support” is not a line on a chart.
A real support is a place where sell flow gets executed and price refuses to die.
Here’s the checklist, exactly like your screenshots.
1) Massive bid appears
You see a big cyan bid wall under price.
Not enough. Size alone is meaningless. Spoofers can print skyscrapers too.
What you want: size + persistence.
2) It gets hit. It gets filled.
Price trades into it and you see real volume sold into the bid.
Key read:
Aggressive sells are coming in.
The bid is not running away.
Prints happen at/near the bid.
If it doesn’t get hit, it’s just “marketing”.
3) Price impact is weak
This is the killshot signal:
✅ A lot of volume executed
❌ Not much downside movement
That’s absorption.
Sellers are unloading, but price barely moves. That means someone big is taking inventory.
Real support = heavy volume, low downside progress.
4) Sellers get trapped
You’ll notice:
repeated sell bursts
no continuation
the market stalls instead of cascading
That’s trapped selling: they hit, they hit again… and price won’t break.
When sellers are “right” but price doesn’t move, they become fuel.
5) HFT buy signals fire near the floor
In your flow: you get HFT buy triggers right as the bid holds.
This matters because it often shows:
microstructure regime shift
short-term exhaustion on the sell side
liquidity providers flipping from “absorb” to “push”
It’s not magic. It’s timing on the transition from absorption to release.
6) New big bid reloads AND gets filled again
This is the difference between “support” and “one-time defense”:
bid gets hit
bid refills / reappears
bid gets hit again
still no breakdown
That’s true liquidity.
Not a wall. A machine.
7) Rebound: the release
Once the sell flow is absorbed and the bid keeps replenishing, the market does one of two things:
It pops because offers thin out (liquidity vacuum upward)
It grinds up because trapped sellers cover and buyers regain confidence
Either way, the “support” did its job:
it converted sell aggression into someone else’s long inventory.
The Scalping Recipe (brutal version)
If you want a real support scalp, demand these 3 conditions:
✅ Displayed bid + persistence
✅ It gets filled (real executed volume)
✅ Low price impact (no breakdown)
Add confirmations:
HFT buy triggers
bid reloads after being hit
failed breakdown attempts
Then you have a bottom that matters.
Red Flags (fake support)
🚫 Massive bid that cancels as price approaches
🚫 Big size, zero prints (never traded)
🚫 Price slices through it on first touch (no absorption)
🚫 No reload, no defense, just a one-frame screenshot wall
That’s not support. That’s bait.
In one sentence:
A true support is where real sell volume gets executed, bids reload, and price refuses to go lower, then the tape rebounds.
Simple. Efficient. Nasty for scalping. 👊
Simple. Brutal. Scalp-ready. 🧭
A “support” is not a line on a chart.
A real support is a place where sell flow gets executed and price refuses to die.
Here’s the checklist, exactly like your screenshots.
1) Massive bid appears
You see a big cyan bid wall under price.
Not enough. Size alone is meaningless. Spoofers can print skyscrapers too.
What you want: size + persistence.
2) It gets hit. It gets filled.
Price trades into it and you see real volume sold into the bid.
Key read:
Aggressive sells are coming in.
The bid is not running away.
Prints happen at/near the bid.
If it doesn’t get hit, it’s just “marketing”.
3) Price impact is weak
This is the killshot signal:
✅ A lot of volume executed
❌ Not much downside movement
That’s absorption.
Sellers are unloading, but price barely moves. That means someone big is taking inventory.
Real support = heavy volume, low downside progress.
4) Sellers get trapped
You’ll notice:
repeated sell bursts
no continuation
the market stalls instead of cascading
That’s trapped selling: they hit, they hit again… and price won’t break.
When sellers are “right” but price doesn’t move, they become fuel.
5) HFT buy signals fire near the floor
In your flow: you get HFT buy triggers right as the bid holds.
This matters because it often shows:
microstructure regime shift
short-term exhaustion on the sell side
liquidity providers flipping from “absorb” to “push”
It’s not magic. It’s timing on the transition from absorption to release.
6) New big bid reloads AND gets filled again
This is the difference between “support” and “one-time defense”:
bid gets hit
bid refills / reappears
bid gets hit again
still no breakdown
That’s true liquidity.
Not a wall. A machine.
7) Rebound: the release
Once the sell flow is absorbed and the bid keeps replenishing, the market does one of two things:
It pops because offers thin out (liquidity vacuum upward)
It grinds up because trapped sellers cover and buyers regain confidence
Either way, the “support” did its job:
it converted sell aggression into someone else’s long inventory.
The Scalping Recipe (brutal version)
If you want a real support scalp, demand these 3 conditions:
✅ Displayed bid + persistence
✅ It gets filled (real executed volume)
✅ Low price impact (no breakdown)
Add confirmations:
HFT buy triggers
bid reloads after being hit
failed breakdown attempts
Then you have a bottom that matters.
Red Flags (fake support)
🚫 Massive bid that cancels as price approaches
🚫 Big size, zero prints (never traded)
🚫 Price slices through it on first touch (no absorption)
🚫 No reload, no defense, just a one-frame screenshot wall
That’s not support. That’s bait.
In one sentence:
A true support is where real sell volume gets executed, bids reload, and price refuses to go lower, then the tape rebounds.
Simple. Efficient. Nasty for scalping. 👊
🔥1