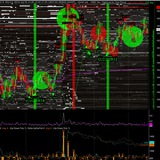
A lot of people asked what really happened on GOLD around $5,500–$5,600.
So I’m sending these real-time screenshots to show it clearly: pure market microstructure.
In the orderflow/4D view you can literally watch supply vs demand in HD:
A massive OFFER wall stacked around $5516–$5517
Size reloading / pulling / reappearing (classic HFT + market making behavior)
Absorption at the offer, then stop-sweeps and a liquidity vacuum
Result: price gets rejected and cascades fast (5511 → 5507 → 5497 → even 5486)
This is why “price action” alone is blind.
Orderflow shows the entire battle, from every angle, in every dimension.
Today, with HFT driving the tape, it was… pure bread-and-butter. 🟡⚡️
#GOLD #XAUUSD #OrderFlow #MarketMaking #HFT #META_quant #4D
So I’m sending these real-time screenshots to show it clearly: pure market microstructure.
In the orderflow/4D view you can literally watch supply vs demand in HD:
A massive OFFER wall stacked around $5516–$5517
Size reloading / pulling / reappearing (classic HFT + market making behavior)
Absorption at the offer, then stop-sweeps and a liquidity vacuum
Result: price gets rejected and cascades fast (5511 → 5507 → 5497 → even 5486)
This is why “price action” alone is blind.
Orderflow shows the entire battle, from every angle, in every dimension.
Today, with HFT driving the tape, it was… pure bread-and-butter. 🟡⚡️
#GOLD #XAUUSD #OrderFlow #MarketMaking #HFT #META_quant #4D
🎥 New video: GOLD / XAUUSDT (yes, tradable even on weekends)
▶️ https://youtu.be/zAOuCPpPf2M
Forget “predictions”. This is microstructure. 👁
In this session I’m trading GOLD (XAUUSDT) with an institutional-grade orderflow stack:
✅ Full Market Depth Level 3 (real DOM)
✅ Tick-by-tick volume data (not candle fantasy)
✅ 0.01 tick size for surgical execution 🎯
Result: clean scalping + market making logic, aiming for dozens of ticks per move, with a high occurrence rate.
🧠 What you’ll learn (the real edge)
1) Why weekends are still tradable
Weekend conditions can be more “delicate”, but that’s exactly why the DOM matters:
thinner participation
liquidity becomes more fragile
stacking/pulling becomes more obvious
reactions around key levels get cleaner (when you know what to look for)
➡️ You’re not hunting massive swings. You’re farming repetitive micro-moves with structure.
📌 The data (institutional, not retail indicators)
✅ Level 3 Full Market Depth (DOM)
You’re tracking liquidity behavior across the book:
stacking (liquidity building)
pulling (liquidity vanishing)
refresh / reloading behavior (iceberg-like patterns)
book shifting (liquidity relocates before price follows)
✅ Tick-by-tick volume (true tape logic)
We watch the fight in real time:
aggression (market orders)
absorption (limits soaking the hits)
bid/ask imbalance + delta behavior
➡️ This is how you identify who’s in control before the move prints.
✅ 0.01 tick size
This is where execution becomes lethal:
tighter entries
cleaner SL placement
smoother scale-in / scale-out management
➡️ Perfect for systematic scalps without needing huge volatility.
⚙️ Trading logic: scalping + market making mindset
Core concept: orderflow anticipation via the order book.
🎯 A typical “institutional read” sequence
Price approaches a zone
DOM shows stacking / defense at a level
Aggression hits but fails to advance (absorption)
Liquidity shifts and price snaps (pullback → continuation)
➡️ Entry + management using scale-in / scale-out to control risk and maximize the micro-edge.
This is pure market making:
✅ measured volatility
✅ liquidity reaction-based entries
✅ repeatable microstructure patterns
✅ consistent tick harvesting, not hero trades
🛰 Tool powering it: META_quant 4D
META_quant 4D is a unique 3D/4D visualization engine for:
Level 3 order book dynamics
market making / HFT-style liquidity movement
real-time orderflow “film”, not a single snapshot
➡️ You don’t just see price. You see liquidity intent.
🌐 https://metaquantuniverse.com
⚡️ Just watch. Just wake up. 2026 is NOW.
If you’re ready to trade like the institutional side, this is the doorway. 🏦👁
▶️ VIDEO: https://youtu.be/zAOuCPpPf2M
▶️ https://youtu.be/zAOuCPpPf2M
Forget “predictions”. This is microstructure. 👁
In this session I’m trading GOLD (XAUUSDT) with an institutional-grade orderflow stack:
✅ Full Market Depth Level 3 (real DOM)
✅ Tick-by-tick volume data (not candle fantasy)
✅ 0.01 tick size for surgical execution 🎯
Result: clean scalping + market making logic, aiming for dozens of ticks per move, with a high occurrence rate.
🧠 What you’ll learn (the real edge)
1) Why weekends are still tradable
Weekend conditions can be more “delicate”, but that’s exactly why the DOM matters:
thinner participation
liquidity becomes more fragile
stacking/pulling becomes more obvious
reactions around key levels get cleaner (when you know what to look for)
➡️ You’re not hunting massive swings. You’re farming repetitive micro-moves with structure.
📌 The data (institutional, not retail indicators)
✅ Level 3 Full Market Depth (DOM)
You’re tracking liquidity behavior across the book:
stacking (liquidity building)
pulling (liquidity vanishing)
refresh / reloading behavior (iceberg-like patterns)
book shifting (liquidity relocates before price follows)
✅ Tick-by-tick volume (true tape logic)
We watch the fight in real time:
aggression (market orders)
absorption (limits soaking the hits)
bid/ask imbalance + delta behavior
➡️ This is how you identify who’s in control before the move prints.
✅ 0.01 tick size
This is where execution becomes lethal:
tighter entries
cleaner SL placement
smoother scale-in / scale-out management
➡️ Perfect for systematic scalps without needing huge volatility.
⚙️ Trading logic: scalping + market making mindset
Core concept: orderflow anticipation via the order book.
🎯 A typical “institutional read” sequence
Price approaches a zone
DOM shows stacking / defense at a level
Aggression hits but fails to advance (absorption)
Liquidity shifts and price snaps (pullback → continuation)
➡️ Entry + management using scale-in / scale-out to control risk and maximize the micro-edge.
This is pure market making:
✅ measured volatility
✅ liquidity reaction-based entries
✅ repeatable microstructure patterns
✅ consistent tick harvesting, not hero trades
🛰 Tool powering it: META_quant 4D
META_quant 4D is a unique 3D/4D visualization engine for:
Level 3 order book dynamics
market making / HFT-style liquidity movement
real-time orderflow “film”, not a single snapshot
➡️ You don’t just see price. You see liquidity intent.
🌐 https://metaquantuniverse.com
⚡️ Just watch. Just wake up. 2026 is NOW.
If you’re ready to trade like the institutional side, this is the doorway. 🏦👁
▶️ VIDEO: https://youtu.be/zAOuCPpPf2M
🟡 NEW GOLD VIDEO (XAUUSDT) | PURE ORDERFLOW, INSTITUTIONAL STYLE 🏦👁
This is not “I think it will go up.”
This is watching liquidity move in real time… and understanding why.
In this video I break down a full, brutal, textbook sequence on GOLD, step-by-step: 🎥🔥
✅ Elbow drop sell-off
✅ Huge sell volume SOLD FILLED (aggression absorbed)
✅ Big limit orders getting smashed… one, two, three 💥💥💥
✅ Then the twist: BID reload (refresh, defend, accumulate) 🧱
✅ HFT buy attack (pressure flips instantly) ⚡️
✅ Final act: SHORT SQUEEZE (shorts become fuel) 🚨📈
The whole story is one thing:
🟢 Bullish market making accumulation while the crowd panics.
Yes… it’s art. And it’s measurable.
🎯 Why this matters (even if you’re a physical metals investor)
If you’re into physical GOLD, you already know the narrative: store of value, hedge, long-term.
Perfect.
But understanding how paper gold moves intraday (and who’s actually moving it) gives you a real edge:
➡️ You separate noise vs. accumulation
➡️ You spot liquidity traps before they snap
➡️ You stop guessing and start reading
Cynical truth?
Most people “analyze” GOLD. Institutions read the book. 😏
🔥 Watch if you want to understand:
📌 Absorption vs real selling
📌 Bid reload / defense mechanics
📌 HFT burst signatures
📌 How squeezes build (and why they’re inevitable)
This is not “I think it will go up.”
This is watching liquidity move in real time… and understanding why.
In this video I break down a full, brutal, textbook sequence on GOLD, step-by-step: 🎥🔥
✅ Elbow drop sell-off
✅ Huge sell volume SOLD FILLED (aggression absorbed)
✅ Big limit orders getting smashed… one, two, three 💥💥💥
✅ Then the twist: BID reload (refresh, defend, accumulate) 🧱
✅ HFT buy attack (pressure flips instantly) ⚡️
✅ Final act: SHORT SQUEEZE (shorts become fuel) 🚨📈
The whole story is one thing:
🟢 Bullish market making accumulation while the crowd panics.
Yes… it’s art. And it’s measurable.
🎯 Why this matters (even if you’re a physical metals investor)
If you’re into physical GOLD, you already know the narrative: store of value, hedge, long-term.
Perfect.
But understanding how paper gold moves intraday (and who’s actually moving it) gives you a real edge:
➡️ You separate noise vs. accumulation
➡️ You spot liquidity traps before they snap
➡️ You stop guessing and start reading
Cynical truth?
Most people “analyze” GOLD. Institutions read the book. 😏
🔥 Watch if you want to understand:
📌 Absorption vs real selling
📌 Bid reload / defense mechanics
📌 HFT burst signatures
📌 How squeezes build (and why they’re inevitable)
You don’t get what’s happening with #GOLD market making?
Here’s a blatant absorption print. 🧱🔻
Buy flow comes in hot… and the market makers just eat it.
No lift. No follow-through. Just inventory taken and price held in a cage.
This is absorption.
The kind that turns “dip buyers” into exit liquidity.
Enjoy. 😈
#GOLD #marketmaking #orderflow #microstructure #HFT #meta_quant
Here’s a blatant absorption print. 🧱🔻
Buy flow comes in hot… and the market makers just eat it.
No lift. No follow-through. Just inventory taken and price held in a cage.
This is absorption.
The kind that turns “dip buyers” into exit liquidity.
Enjoy. 😈
#GOLD #marketmaking #orderflow #microstructure #HFT #meta_quant
SPOOFING ON THE OFFER, live in the order book. ☠️📉
See those huge displayed sell walls stacked on the ask/offer?
They look “ultra liquid”… but they’re not real liquidity.
What’s happening:
Massive offers appear (oversized, loud, intimidating).
They sit there just long enough to scare buyers and cap price.
The moment price comes close… they vanish (cancelled).
Goal: push price down by faking supply, not by getting filled.
That’s the tell: big size, tiny lifetime.
It’s a psychological ceiling, a pressure plate for the tape.
If you’re reading the book, don’t worship the wall.
Watch cancels, refresh rate, and whether it actually trades.
Courage. 🧭🔥
#GOLD #orderflow #marketmaking #microstructure #HFT #spoofing #meta_quant
See those huge displayed sell walls stacked on the ask/offer?
They look “ultra liquid”… but they’re not real liquidity.
What’s happening:
Massive offers appear (oversized, loud, intimidating).
They sit there just long enough to scare buyers and cap price.
The moment price comes close… they vanish (cancelled).
Goal: push price down by faking supply, not by getting filled.
That’s the tell: big size, tiny lifetime.
It’s a psychological ceiling, a pressure plate for the tape.
If you’re reading the book, don’t worship the wall.
Watch cancels, refresh rate, and whether it actually trades.
Courage. 🧭🔥
#GOLD #orderflow #marketmaking #microstructure #HFT #spoofing #meta_quant
HERE WE GO AGAIN. ☠️
Spoofing on the offer.
Huge sell walls pop up like “real supply”… then ghost the second they’re about to get hit.
Real price impact. Fake liquidity.
It’s not resistance. It’s theater.
They flash size to lean the tape down, trigger hesitation, force weak hands…
then cancel before execution. Because they were never here to trade.
Enjoy it. Learn it.
Don’t be the liquidity they farm. 🧭🔥
#GOLD #orderflow #marketmaking #microstructure #HFT #spoofing #meta_quant
Spoofing on the offer.
Huge sell walls pop up like “real supply”… then ghost the second they’re about to get hit.
Real price impact. Fake liquidity.
It’s not resistance. It’s theater.
They flash size to lean the tape down, trigger hesitation, force weak hands…
then cancel before execution. Because they were never here to trade.
Enjoy it. Learn it.
Don’t be the liquidity they farm. 🧭🔥
#GOLD #orderflow #marketmaking #microstructure #HFT #spoofing #meta_quant
WHO’S BUYING THOSE MASSIVE OFFERS? 😏☠️
Look at the book: giant offer walls sitting overhead like “infinite supply”.
If you’re chasing buys into that, ask yourself one thing:
Are you trading… or are you the exit liquidity?
Because this is how it works:
They display size to freeze you.
They pin price under the ceiling.
They harvest your market orders while you feel “safe”.
And when it’s done… you realize you were just cannon fodder for the house.
The tape doesn’t care about your hope.
It cares about who controls the inventory.
Enjoy. Learn. Don’t be the liquidity. 🧭🔥
#GOLD #orderflow #marketmaking #microstructure #HFT #meta_quant
Look at the book: giant offer walls sitting overhead like “infinite supply”.
If you’re chasing buys into that, ask yourself one thing:
Are you trading… or are you the exit liquidity?
Because this is how it works:
They display size to freeze you.
They pin price under the ceiling.
They harvest your market orders while you feel “safe”.
And when it’s done… you realize you were just cannon fodder for the house.
The tape doesn’t care about your hope.
It cares about who controls the inventory.
Enjoy. Learn. Don’t be the liquidity. 🧭🔥
#GOLD #orderflow #marketmaking #microstructure #HFT #meta_quant
META_quant 4D replay (chronological): the whole sequence, tape by tape
Legend (what you’re looking at in META_quant 4D):
Cyan blocks = bids (passive demand)
Magenta blocks = offers (passive supply)
Big vertical slabs/pillars = displayed liquidity walls (size + placement)
The “life” of a wall = the clue: does it sit and get hit, or flash and vanish?
Volume vs price impact: heavy prints with no movement = absorption. Small volume with big movement = liquidity vacuum.
1) $4635: “Massive bid reloaded”
At $4635.45, the book shows thick cyan support repeatedly sitting under price.
This is market making 101:
Sell pressure comes in, but price does not cascade.
Why? Because the bid keeps reloading (passive buyers replenishing the queue).
Result: high traded volume, low downside movement = absorption on the bid.
Translation: the downside is being bought without advertising it on the chart. The tape is being stabilized.
2) $4639: “Bid filled / inventory rotation”
At $4639.22, price grinds up into a denser zone.
The bid that supported earlier starts to look partially consumed / rotated.
Market makers typically absorb, then recycle inventory higher.
You get a “controlled lift”: price rises, but it still feels “heavy” because supply is already being prepared overhead.
Volume-price impact read: still efficient, not explosive. The move is engineered, not emotional.
3) $4643: “Climb continues, book thickens”
At $4643.09, you can see both sides building:
Bids remain present, but offers start stacking more aggressively.
This is often the transition from “supporting the tape” to “preparing the ceiling”.
Key tell: the market is climbing, but the offer-side structure is getting more intimidating.
4) $4645: “Absorption at the offer”
At $4645.08, the picture becomes clearer: magenta overhead thickens.
Buy flow hits the offer, but price struggles to extend.
That is offer absorption: aggressive buyers are being fed into passive sellers.
Volume-price impact read: buys print, but uplift is weak. That’s the signature of absorption.
This is where retail brains say “breakout soon”.
This is where market makers say “thanks for the liquidity”.
5) $4647: “Hard cap, distribution starts”
At $4647.13 / $4647.19 (“ça bloque” + sell signal), the ceiling becomes violent:
A massive offer wall sits right above price.
Buyers keep trying, but they’re getting stuffed.
You even get sell signal timing while price is pinned under that supply.
This is the classic distribution zone:
The tape looks “strong” (still high),
But the orderflow is screaming “buyers are being used”.
This is where the trap gets built.
6) $4641: “Trapdoor moment (liquidity vacuum)”
Then comes the flip to $4641.20.
What changed?
Either the bid stops reloading, gets pulled, or gets overwhelmed.
Once that support behavior disappears, price doesn’t “walk down”.
It falls through gaps.
Volume-price impact read: you can get a sharp drop with less visible effort because the book is suddenly thin.
That’s not “more selling”. That’s less support.
7) $4630 then $4619: “Offer spoof-style pressure + follow-through”
At $4630.58 and later $4619.70, you get the uglier part:
Huge offers appear overhead (tall magenta pillars).
Many of these walls look short-lived, appearing and disappearing fast.
That’s spoof-like / layering behavior: not there to get filled, there to lean the tape lower and intimidate bids.
Mechanically:
Flash supply above price → buyers hesitate → price leans down
Cancel when threatened → re-post higher/lower → repeat
The impact is real, the liquidity is questionable.
End result: downside continuation fueled by psychology + structure, not just raw aggression.
The full story in one line
Bids reload and absorb to lift price… then offers stack and absorb the buys… then support steps away… then the market drops through a vacuum while spoof-style offer pressure keeps the tape pinned.
What META_quant 4D makes obvious (the “edge”)
Absorption is visible: lots of interaction, little movement.
Legend (what you’re looking at in META_quant 4D):
Cyan blocks = bids (passive demand)
Magenta blocks = offers (passive supply)
Big vertical slabs/pillars = displayed liquidity walls (size + placement)
The “life” of a wall = the clue: does it sit and get hit, or flash and vanish?
Volume vs price impact: heavy prints with no movement = absorption. Small volume with big movement = liquidity vacuum.
1) $4635: “Massive bid reloaded”
At $4635.45, the book shows thick cyan support repeatedly sitting under price.
This is market making 101:
Sell pressure comes in, but price does not cascade.
Why? Because the bid keeps reloading (passive buyers replenishing the queue).
Result: high traded volume, low downside movement = absorption on the bid.
Translation: the downside is being bought without advertising it on the chart. The tape is being stabilized.
2) $4639: “Bid filled / inventory rotation”
At $4639.22, price grinds up into a denser zone.
The bid that supported earlier starts to look partially consumed / rotated.
Market makers typically absorb, then recycle inventory higher.
You get a “controlled lift”: price rises, but it still feels “heavy” because supply is already being prepared overhead.
Volume-price impact read: still efficient, not explosive. The move is engineered, not emotional.
3) $4643: “Climb continues, book thickens”
At $4643.09, you can see both sides building:
Bids remain present, but offers start stacking more aggressively.
This is often the transition from “supporting the tape” to “preparing the ceiling”.
Key tell: the market is climbing, but the offer-side structure is getting more intimidating.
4) $4645: “Absorption at the offer”
At $4645.08, the picture becomes clearer: magenta overhead thickens.
Buy flow hits the offer, but price struggles to extend.
That is offer absorption: aggressive buyers are being fed into passive sellers.
Volume-price impact read: buys print, but uplift is weak. That’s the signature of absorption.
This is where retail brains say “breakout soon”.
This is where market makers say “thanks for the liquidity”.
5) $4647: “Hard cap, distribution starts”
At $4647.13 / $4647.19 (“ça bloque” + sell signal), the ceiling becomes violent:
A massive offer wall sits right above price.
Buyers keep trying, but they’re getting stuffed.
You even get sell signal timing while price is pinned under that supply.
This is the classic distribution zone:
The tape looks “strong” (still high),
But the orderflow is screaming “buyers are being used”.
This is where the trap gets built.
6) $4641: “Trapdoor moment (liquidity vacuum)”
Then comes the flip to $4641.20.
What changed?
Either the bid stops reloading, gets pulled, or gets overwhelmed.
Once that support behavior disappears, price doesn’t “walk down”.
It falls through gaps.
Volume-price impact read: you can get a sharp drop with less visible effort because the book is suddenly thin.
That’s not “more selling”. That’s less support.
7) $4630 then $4619: “Offer spoof-style pressure + follow-through”
At $4630.58 and later $4619.70, you get the uglier part:
Huge offers appear overhead (tall magenta pillars).
Many of these walls look short-lived, appearing and disappearing fast.
That’s spoof-like / layering behavior: not there to get filled, there to lean the tape lower and intimidate bids.
Mechanically:
Flash supply above price → buyers hesitate → price leans down
Cancel when threatened → re-post higher/lower → repeat
The impact is real, the liquidity is questionable.
End result: downside continuation fueled by psychology + structure, not just raw aggression.
The full story in one line
Bids reload and absorb to lift price… then offers stack and absorb the buys… then support steps away… then the market drops through a vacuum while spoof-style offer pressure keeps the tape pinned.
What META_quant 4D makes obvious (the “edge”)
Absorption is visible: lots of interaction, little movement.
👍1