
👻 Snap Across the Map
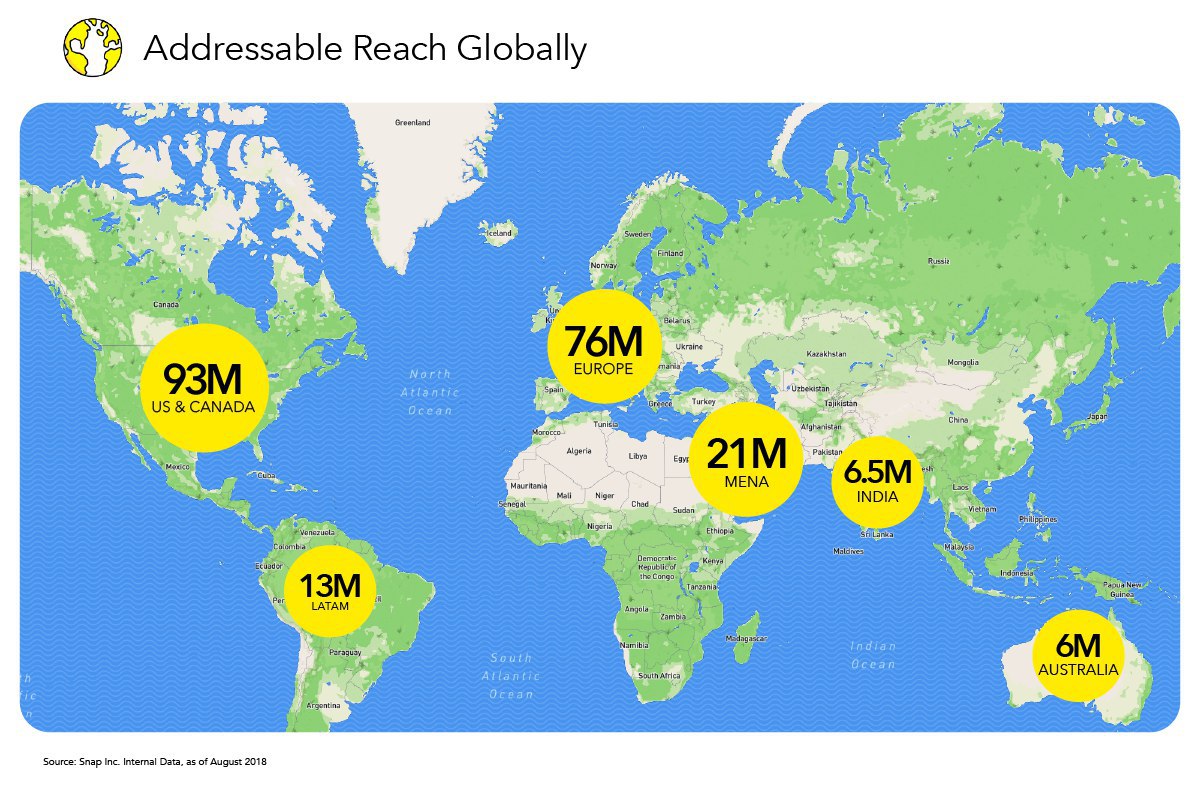
According to Snap, on average, 188 million people around the world use #Snapchat on a daily basis, and these daily active Snapchatters use the app at an average of over 20 times per day.
As of August 2018, these are the number of users Snapchat can reach in different regions/countries:
- 93 million in the 🇺🇸 & 🇨🇦
- 76 million in Europe (17.5m in 🇫🇷, 15.5m in 🇬🇧, 9.2m in 🇩🇪)
- 21 million in MENA (13.1m in 🇸🇦, 2.6m in 🇮🇶, 1.8m in 🇦🇪)
- 13 million in Latin America
- 6.5 million in 🇮🇳
- 6 million in 🇦🇺
🚀 @PerspectiveIX via Snap.
❓ Do you use Snapchat?
💻 Our Digital Toolbox
Here's a list of all the apps & services we use to run Perspective IX on various platforms. We call it iX Toolbox!
Hope you find it useful! 🙂
🚀 @PerspectiveIX
Here's a list of all the apps & services we use to run Perspective IX on various platforms. We call it iX Toolbox!
Hope you find it useful! 🙂
🚀 @PerspectiveIX
🎶 Spotify vs. Apple Music
Which Streaming Music Service do Music Lovers Love?
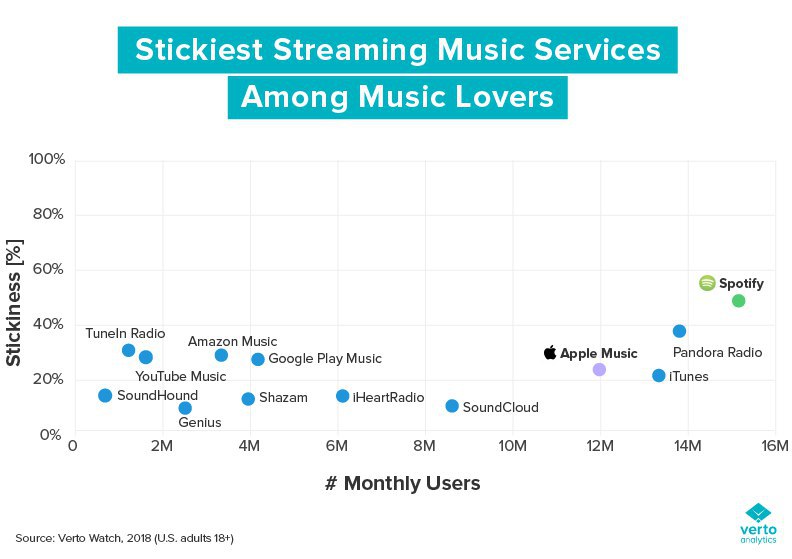
Stickiness is how Verto measures a given app or website’s audience engagement; the higher the stickiness rating (as a percentage), the more engaging (or stickier) a streaming music service is, indicating which services Music Lovers listen to on a regular (even daily) basis.
The stickiest streaming music services among Music Lovers are, unsurprisingly, also some of the most popular among the general population.
- #Spotify (49% stickiness rating)
- #Pandora Radio (38% stickiness rating)
- TuneIn Radio (31% stickiness rating)
🚀 @PerspectiveIX via VertoAnalytics.
❓ What's your favourite music streaming service?
Which Streaming Music Service do Music Lovers Love?
Stickiness is how Verto measures a given app or website’s audience engagement; the higher the stickiness rating (as a percentage), the more engaging (or stickier) a streaming music service is, indicating which services Music Lovers listen to on a regular (even daily) basis.
The stickiest streaming music services among Music Lovers are, unsurprisingly, also some of the most popular among the general population.
- #Spotify (49% stickiness rating)
- #Pandora Radio (38% stickiness rating)
- TuneIn Radio (31% stickiness rating)
🚀 @PerspectiveIX via VertoAnalytics.
❓ What's your favourite music streaming service?
This media is not supported in your browser
VIEW IN TELEGRAM
⚰️ RIP Electronics
The Gowanus E-Waste Warehouse in Brooklyn houses pretty much every single type of retro tech gadget you can think of. Basically, the ultimate #TBT!
🚀 @PerspectiveIX
The Gowanus E-Waste Warehouse in Brooklyn houses pretty much every single type of retro tech gadget you can think of. Basically, the ultimate #TBT!
🚀 @PerspectiveIX
🙄 Relationship Status with Facebook: It's Complicated!
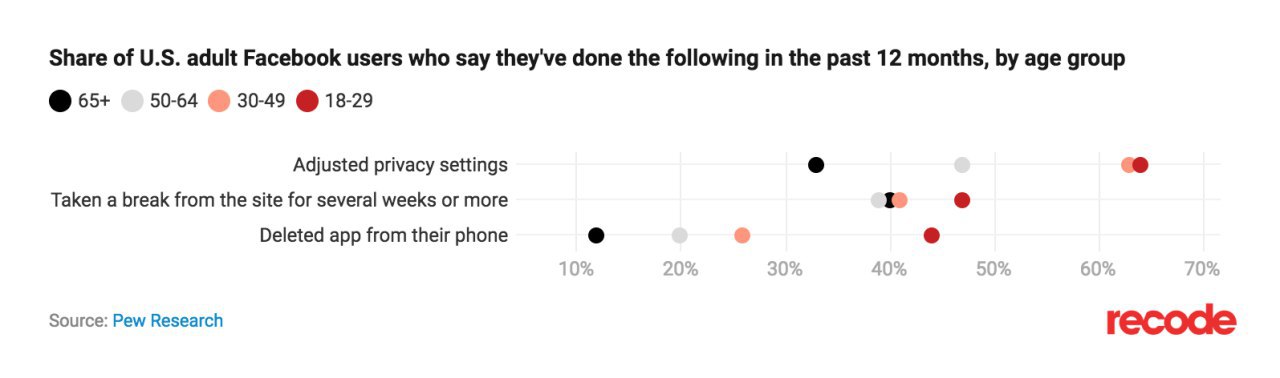
More than a quarter of #Facebook users in the US 🇺🇸 say they have deleted the app from their phones over the past year, according to a poll by the Pew Research Center.
- 26% say they have deleted the app from their phones.
- 42% say they have taken a break from checking Facebook for several weeks or more.
- 54% say they’ve adjusted their privacy settings over the past year.
The interesting fact remains that the younger users deleted the app more often the older users. They've also taken more breaks from it. Whether it's sort of a backlash to the idea that #SocialMedia is a poor use of time, or CambridgeAnalytica scandal and/or something else, distancing themselves from Facebook app seems to be a conscious decision.
🚀 @PerspectiveIX via Recode.
❓ Which group do YOU belong to?
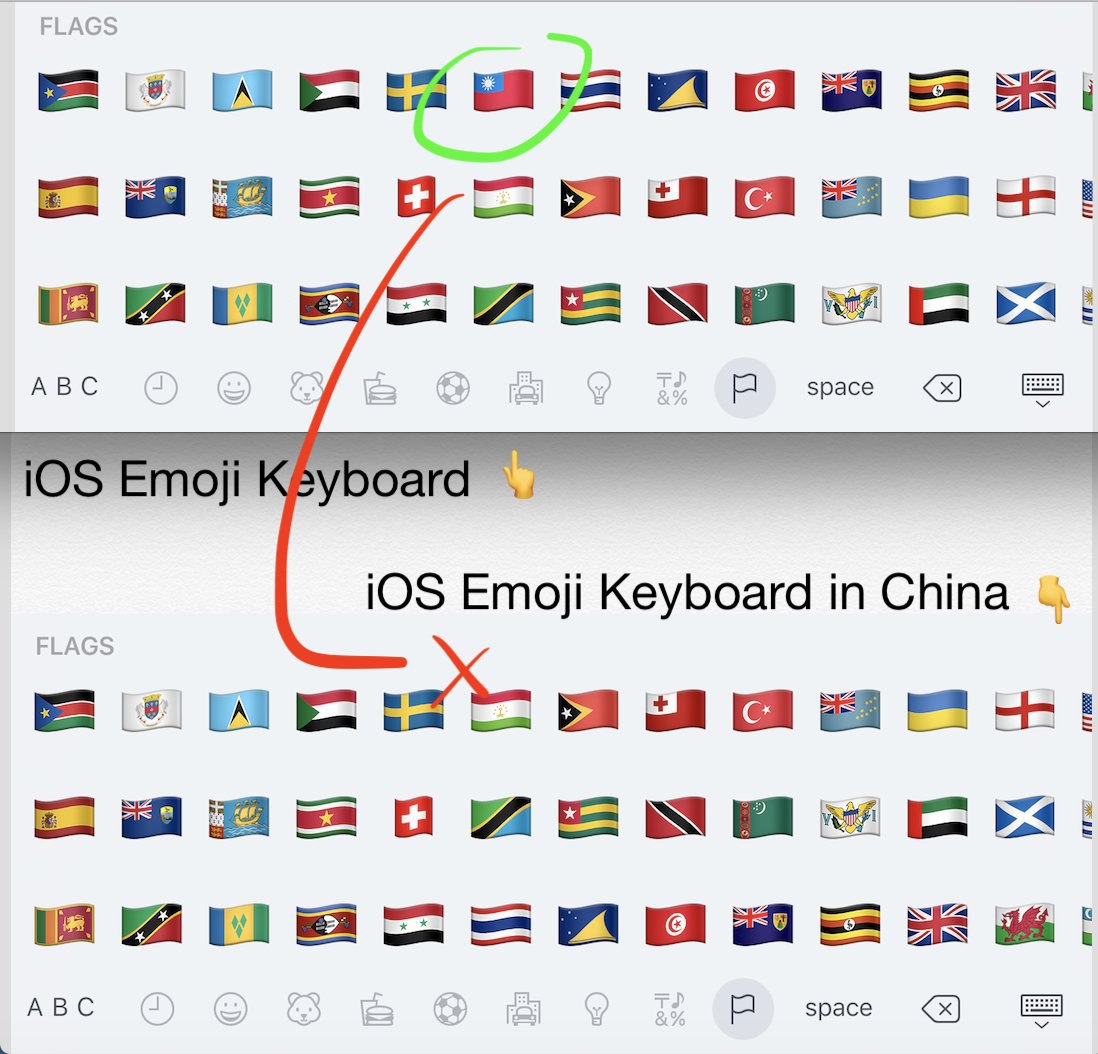
❌ The Emoji that Chinese iPhones Don't Show!
The iOS emoji keyboard doesn't show the 🇹🇼 Taiwan flag at all if the region is set to China. The character presents as a missing character (☒) when viewed on websites or in messages on a Chinese iPhone!
🚀 @PerspectiveIX via Emojipedia.
The iOS emoji keyboard doesn't show the 🇹🇼 Taiwan flag at all if the region is set to China. The character presents as a missing character (☒) when viewed on websites or in messages on a Chinese iPhone!
🚀 @PerspectiveIX via Emojipedia.
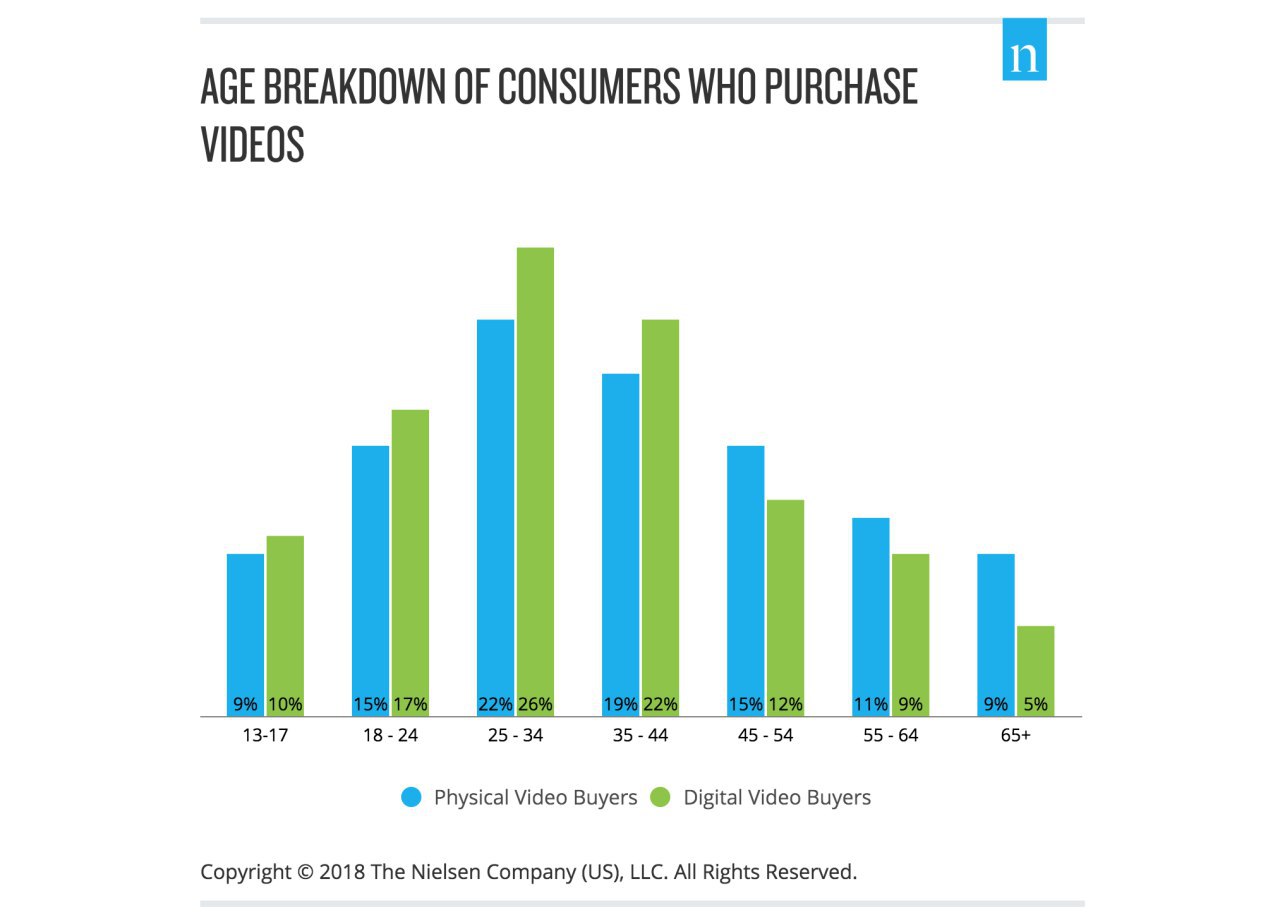
📽 Pay to Play: A Look at the Motivations Behind Spending Money on Video Content
While there is a lot to watch on TV for free, consumers won't settle if they don't find something they are really interested in. Meaning, they easily open their wallets for streaming and downloadable content, and to buy physical disks, like DVDs and Blu-Rays.
- But who's paying? And why?
According to Nielsen, 51% of people in the US ages 13+ reported buying a physical video in the past year, and 42% purchased digital videos.
📀 Motivations for Purchasing Physical Videos:
- 51% DVD/Blu-ray device ownership
- 40% Enjoy adding to collection
- 33% Doesn't require internet connection
- 27% Bonus features
⬇️ Reasons for Purchasing Digital Long-form Videos:
- 49% More convenient
- 42% Ability to watch across different devices
- 40% Video quality is better
🚀 @PerspectiveIX via Nielsen.
❓ Which one do you prefer?
This media is not supported in your browser
VIEW IN TELEGRAM
🤔 When David Choe painted the #Facebook offices in 2005, he could:
💰 get $60k or
📈 get paid in FB stock
Now, his shares are worth $200+ MILLION😱
🚀 @PerspectiveIX
❓ Which one would you have taken?
💰 get $60k or
📈 get paid in FB stock
Now, his shares are worth $200+ MILLION😱
🚀 @PerspectiveIX
❓ Which one would you have taken?
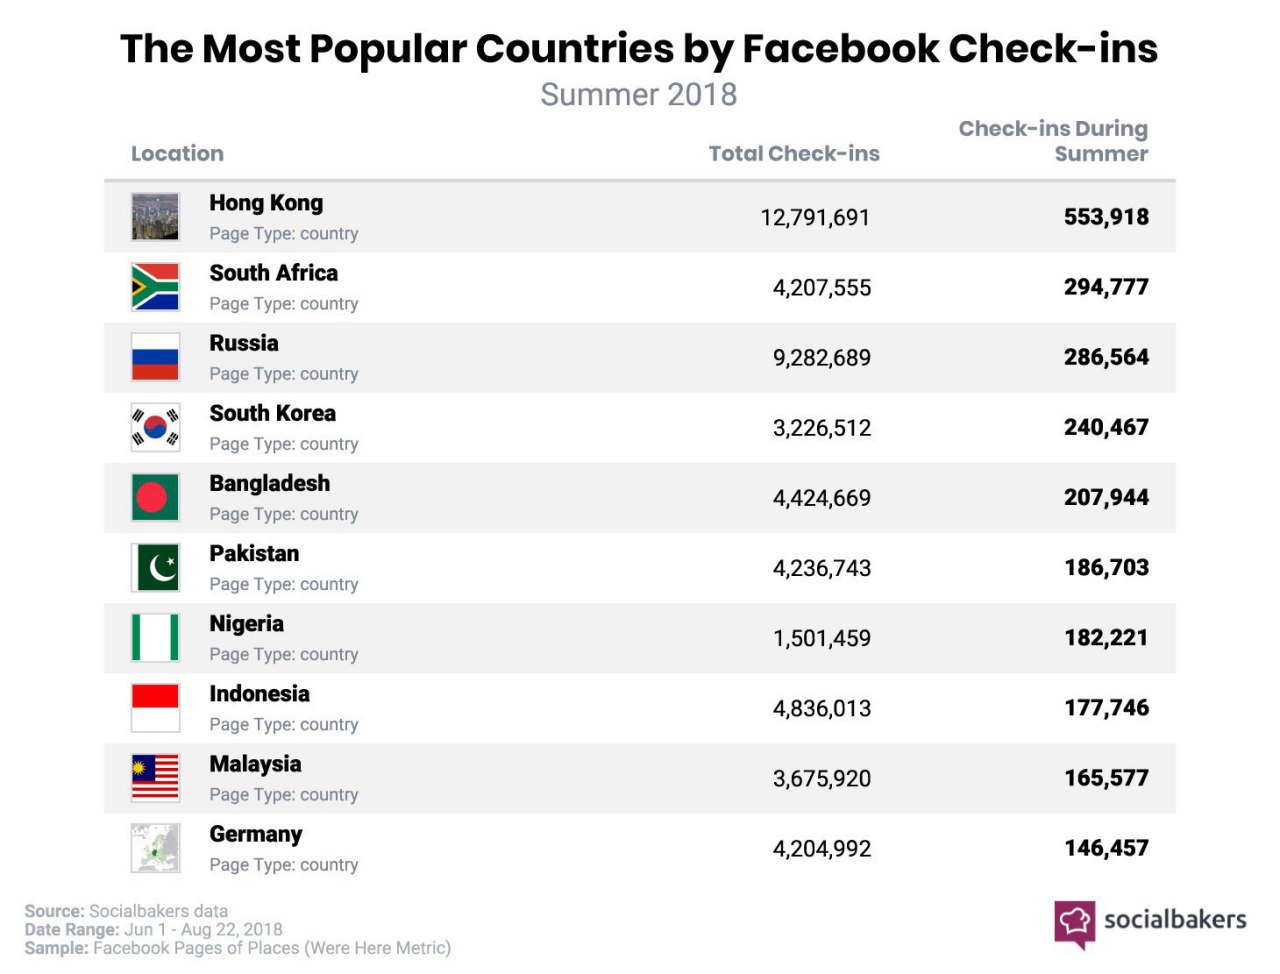
☀️ We know where you've been this summer!
The most checked-in countries on #Facebook:
🇭🇰 Hong Kong
🇿🇦 South Africa
🇷🇺 Russia
#SocialMedia
🚀 @PerspectiveIX via Socialbakers.
The most checked-in countries on #Facebook:
🇭🇰 Hong Kong
🇿🇦 South Africa
🇷🇺 Russia
#SocialMedia
🚀 @PerspectiveIX via Socialbakers.
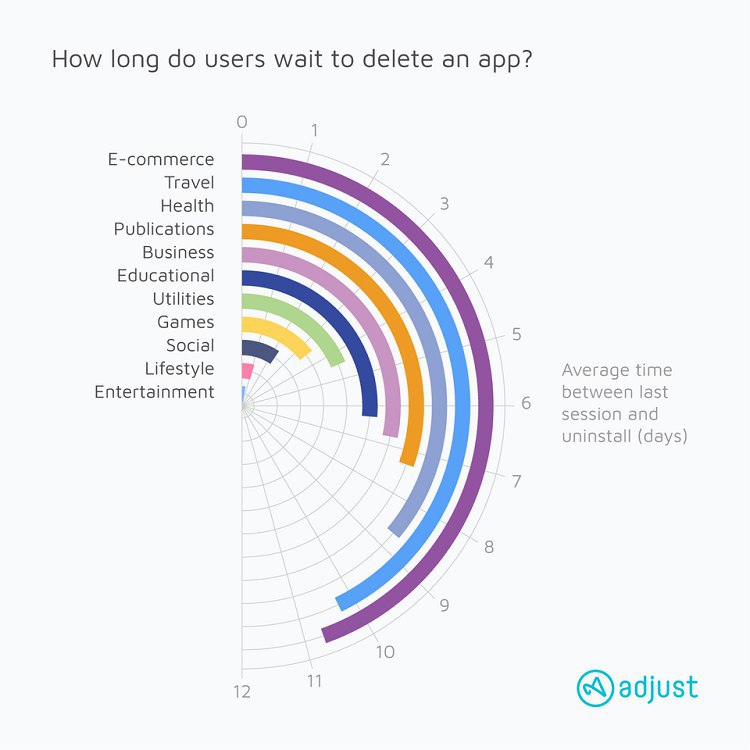
📲 You Only Have Six Days to Save Your App
From an analysis of over eight billion installs, across acquisition types, platforms, and verticals, Adjust found that marketers have less than six days (after the last app open) to re-engage users before they uninstall.
The study also found that the rate of uninstall varies across verticals, ranging from less than three hours to more than 15 days after the initial installation.
Despite the rate at which users uninstall apps, this does not mean all is lost. The study also found that 34% of users who uninstall an app are willing to re-download it again further down the line.
🚀 @PerspectiveIX via Econsultancy.
Media is too big
VIEW IN TELEGRAM
📱 The History of Cell Phones
The first cell phone was created in 1973 & released in September 1983. It took 10 years before the first cell phone was sold for $3,995 ($10,000 today).
🚀 @PerspectiveIX
The first cell phone was created in 1973 & released in September 1983. It took 10 years before the first cell phone was sold for $3,995 ($10,000 today).
🚀 @PerspectiveIX
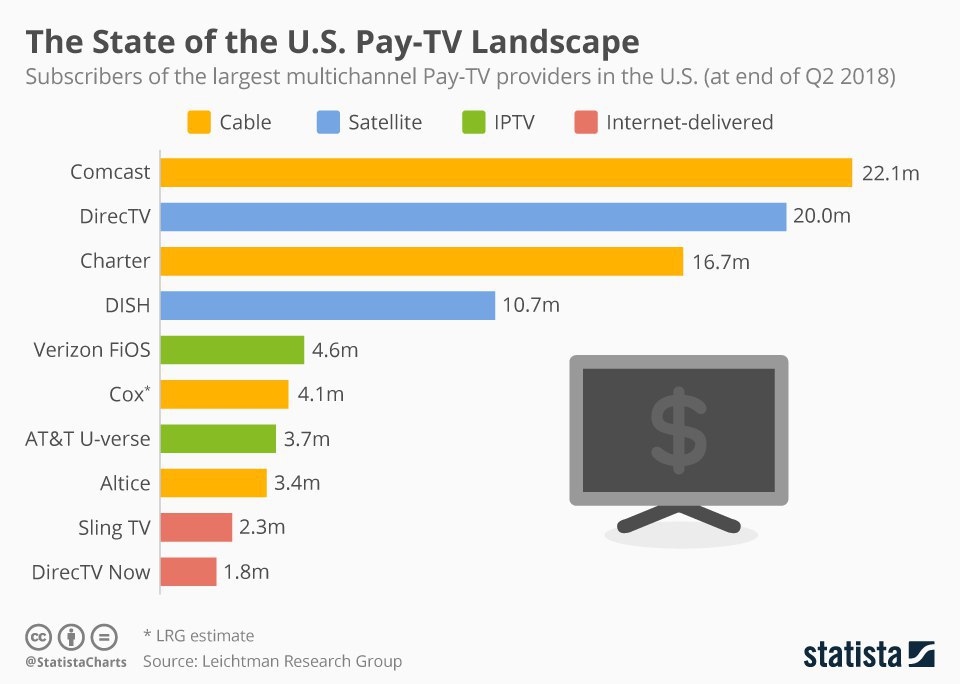
📺 The Largest Pay-TV providers in the US at the End of Q2 2018
According to data compiled by the Leichtman Research Group, the largest pay-TV providers (or subscription-based #TV services) in the US 🇺🇸, representing approximately 95% of all subscribers, had 91.3 million subscribers at the end of Q2 2018, down 400k since the end of the Q1. Meanwhile #Netflix, arguably the biggest threat to the entire industry, ended the Q2 with 57.4 million domestic subscribers.
🚀 @PerspectiveIX via Statista.
This media is not supported in your browser
VIEW IN TELEGRAM
😍 Converging Magnets
It's so much fun to watch how each piece moves from start to finish.
🚀 @PerspectiveIX
❓ How many magnets are there in the video?
It's so much fun to watch how each piece moves from start to finish.
🚀 @PerspectiveIX
❓ How many magnets are there in the video?
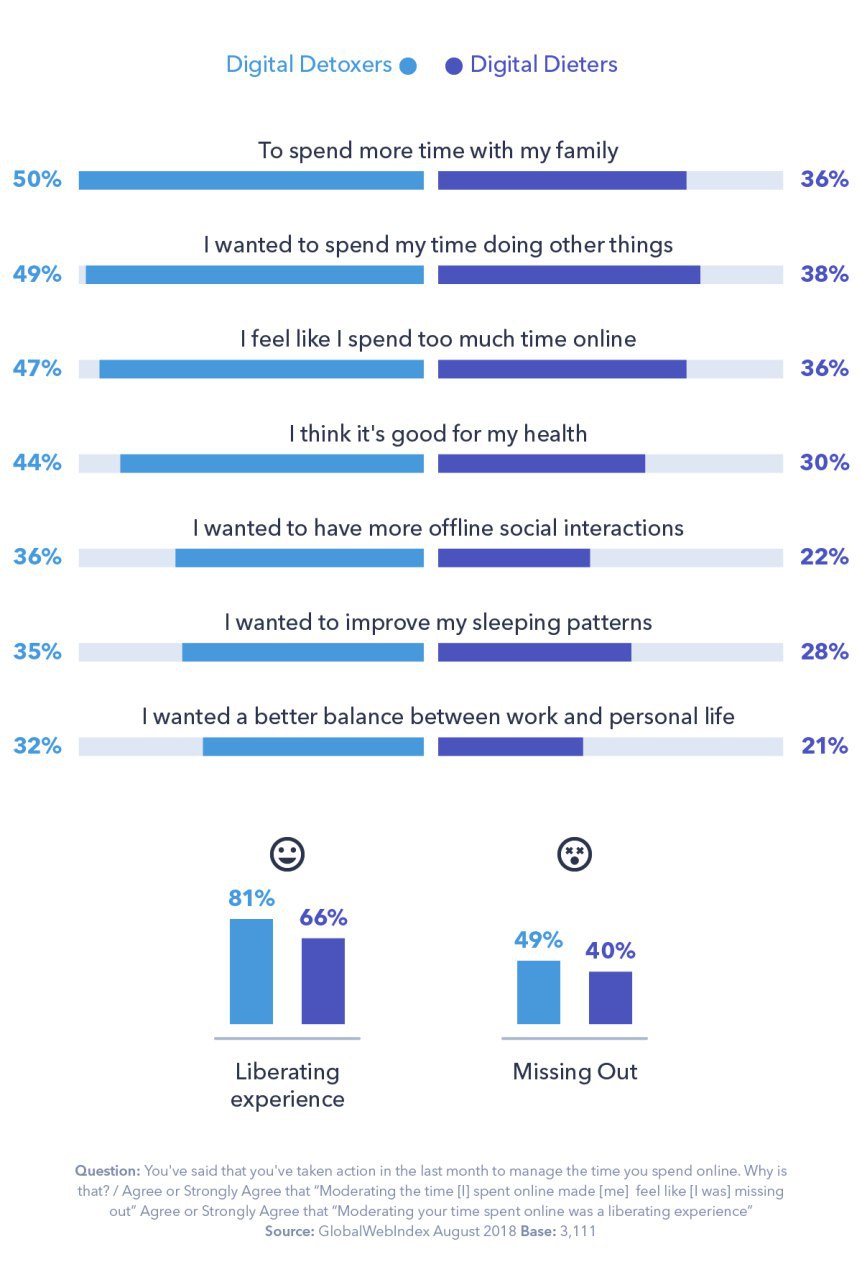
🏖 Digital Detox & Diet
In a special study, GWI surveyed 4,438 internet users aged 16-64 in 🇺🇸 & 🇬🇧 and categorised them into three categories:
1. Digital Detoxers (19%): been on a full digital detox, either while travelling or for any other extended time;
2. Digital Dieters (51%): taken steps to cut down their time spent online, such as restricting usage around bedtime;
3. Digitally Comfortable (30%): haven’t felt the need to cut down/out their online activities.
Digital detoxers and people who take more moderate means to limit their usage have the same priorities:
To spend more time with their families, take part in offline activities, and focus on their health.
#SocialMedia
🚀 @PerspectiveIX via GWI.
❓ Which category are you in?
💪 25 Years of Diet & Exercise!
🚀 @PerspectiveIX
💌 Pulse Weekly. It's not for everybody. It's for you.
🚀 @PerspectiveIX
💌 Pulse Weekly. It's not for everybody. It's for you.
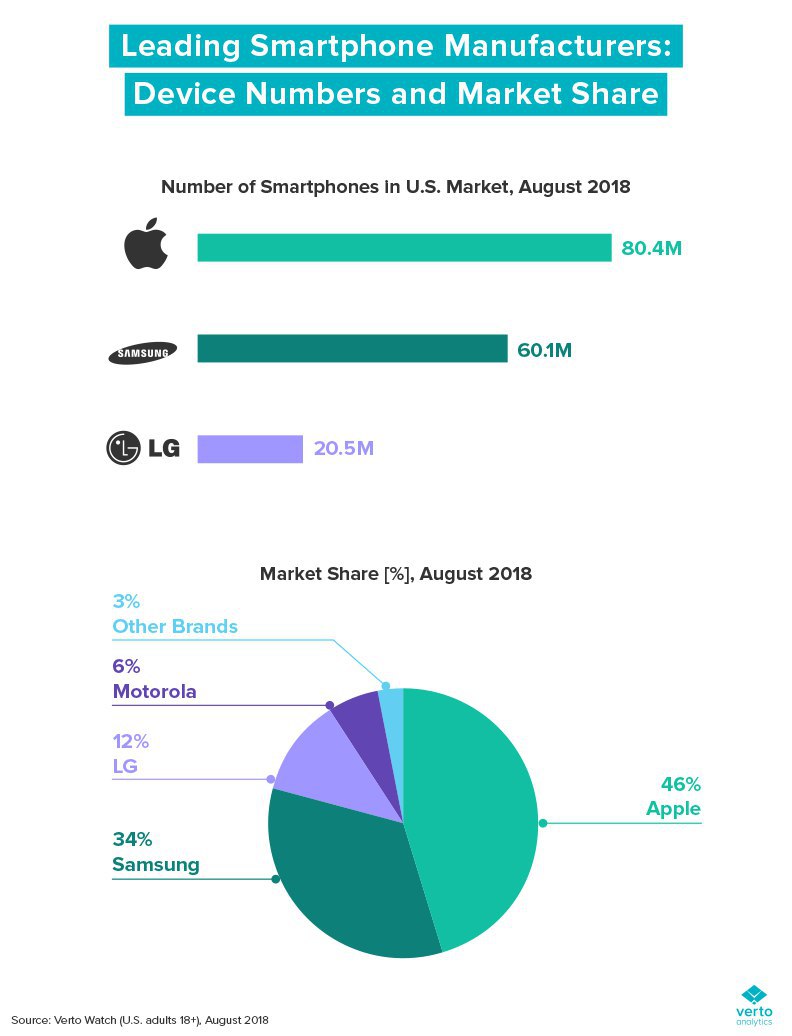
📱 Smartphone Market Share
Seven months ago, on the verge of Samsung’s Galaxy S9 reveal at MWC, the Korean electronics giant still trailed Apple’s lead in the U.S. #smartphone market (among adults, ages 18+), owning 33% of the smartphone market compared to Apple’s 45% share.
Today, although Apple and Samsung are still the undisputed leaders in the smartphone market, the overall number of phones that each manufacturer currently has on the market has dropped.
Currently on the U.S. smartphone market:
- #Apple has 80.4 million (46%)
- #Samsung has 60.1 million (34%)
- #LG has 20.5 million (12%)
🚀 @PerspectiveIX via VertoAnalytics.
❓ Which smartphone brand do you mainly use?
This media is not supported in your browser
VIEW IN TELEGRAM
Nu iPhone!
I N N O V A T I O N
Straight from #Apple Event last night! 😂
🚀 @PerspectiveIX via Reddit/u/Ughhhho
I N N O V A T I O N
Straight from #Apple Event last night! 😂
🚀 @PerspectiveIX via Reddit/u/Ughhhho
💔 Sorry Apple & IKEA, Chinese shoppers don't love you anymore!
Move over #Apple, #Nike, #IKEA and #BMW! Chinese phone maker #Huawei, online shopping website #Taobao, and food delivery giant #MeituanDianping have replaced you as some of China’s favourite brands.
According to the consultancy firm, Prophet, Chinese brands now take up 30 of the 50 slots, up from only 18 in 2016.
🚀 @PerspectiveIX via Bloomberg.
❓ Are you from China? Do you live in China?
Watch: Series 3 vs Series 4
Another piece of art from #Apple's latest event! 😂
🚀 @PerspectiveIX via Reddit/u/SpaceKonk
Another piece of art from #Apple's latest event! 😂
🚀 @PerspectiveIX via Reddit/u/SpaceKonk
🎧 Mid-Year 2018 Streaming Market Shares
- The number of #Music streaming subscribers grew by 16% in the first half of 2018 to reach 229.5 million, up from 198.6 million at the end of 2017.
- Year-on-Year the global subscriber base increased by 38%, adding 62.8 million subscribers.
- 60.8 million net new subscribers were added between H1 2016 & H1 2017.
This indicates that subscriber growth remains on the faster-growth midpoint of the S-curve.
🚀 @PerspectiveIX via MusicIndustryBlog.