Road Crossings
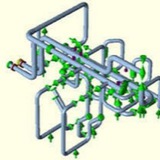
The pipeline model is a crossing of a 36″ potable water transport pipeline with a road. The road is 8 m wide with a roadside of 1 m on each side of the road and ditches alongside the road. The crossing is designed perpendicular to the road-axis and connected with two large radius bends R = 10*D and a angle of 60 degrees.
The pipeline model is a crossing of a 36″ potable water transport pipeline with a road. The road is 8 m wide with a roadside of 1 m on each side of the road and ditches alongside the road. The crossing is designed perpendicular to the road-axis and connected with two large radius bends R = 10*D and a angle of 60 degrees.
Pipe data
Pipe material API 5L X52 steel
Yield stress 52.000 psi = 358 N/mm2
Outer diameter 914.4 mm (36″)Wall thickness 9.52 mm
Corrosion allowance 2 mm
Minimum manufacturing tolerance 5%
Maximum operating pressure 1.0 MPa
Transported matterpotable water
Deadweight of filled pipe structure 1.854 kN/m
Pipe material API 5L X52 steel
Yield stress 52.000 psi = 358 N/mm2
Outer diameter 914.4 mm (36″)Wall thickness 9.52 mm
Corrosion allowance 2 mm
Minimum manufacturing tolerance 5%
Maximum operating pressure 1.0 MPa
Transported matterpotable water
Deadweight of filled pipe structure 1.854 kN/m
Pipeline geometry and side elevation are shown in the figures below.
Soil data
Soil is assumed to consist of a silty sand with a sub-layer of non-consolidated clay. Road construction will be done after the pipeline was laid, resulting in expected soil settlements of the road-earth body with a maximum of 200 mm at the road-axis location. (consolidation of sub-layer of clay due to increased vertical soil pressure)
Soil is assumed to consist of a silty sand with a sub-layer of non-consolidated clay. Road construction will be done after the pipeline was laid, resulting in expected soil settlements of the road-earth body with a maximum of 200 mm at the road-axis location. (consolidation of sub-layer of clay due to increased vertical soil pressure)
Loading data
Pressure 1.00 N/mm2
Deadweight 1.85 N/m
Settlements 200 mm
Pressure 1.00 N/mm2
Deadweight 1.85 N/m
Settlements 200 mm
1. The upper graph shows the surface level of the ground configuration with the water table. As may be seen, there is some water in the ditches.
The horizontal axis is the nodal axis projected on the longitudinal length along the pipe-axis. (various projection axes are possible)
The vertical utmost right axis (length dimension) shows the level and the zeropoint determines the position of the graph.
The horizontal axis is the nodal axis projected on the longitudinal length along the pipe-axis. (various projection axes are possible)
The vertical utmost right axis (length dimension) shows the level and the zeropoint determines the position of the graph.
2. The middle graph shows the soil settlement distribution. The horizontal axis is the same as above, the vertical axis (length dimension) is the middle axis as the scale and position of the graph differ from the first graph.
3. The lower graph shows the combined maximum stress distribution along the pipeline. Horizontal axis again as above, vertical utmost left axis (stress dimension) shows the stress scale. The red line above the graph is the allowable stress.
The overall maximum stress occurs at the middle of the roadcrossing due to pipe bending as a result of the maximum soil settlement
The overall maximum stress occurs at the middle of the roadcrossing due to pipe bending as a result of the maximum soil settlement
🆕 Keep pipe analysis records
Most people believe that a computer printout is a sufficient record of a pipe stress analysis. This a big mistake that can be avoided with little effort. Creating a record of your work is about more than keeping a hard copy or PDF of the computer-aided pipe stress analysis. It means documenting a trail of all inputs, not just the drawings used to create the piping geometry. Items that could be included are the piping and instrument diagrams, system parameters, load cases, and any corresponding external forces applied to the piping system, pipe-support locations, and type of pipe support used. Most pipe stress analysis records will fill a three-ring binder.
As most consulting engineers have internal quality assurance/quality control procedures, develop a standard list of the inputs commonly used and corresponding reference for the information. This would provide the checker of a calculation a place to sign off, indicating they concur with the input and acknowledge the source of the input. In the end, your documentation should tell a complete story.
Most people believe that a computer printout is a sufficient record of a pipe stress analysis. This a big mistake that can be avoided with little effort. Creating a record of your work is about more than keeping a hard copy or PDF of the computer-aided pipe stress analysis. It means documenting a trail of all inputs, not just the drawings used to create the piping geometry. Items that could be included are the piping and instrument diagrams, system parameters, load cases, and any corresponding external forces applied to the piping system, pipe-support locations, and type of pipe support used. Most pipe stress analysis records will fill a three-ring binder.
As most consulting engineers have internal quality assurance/quality control procedures, develop a standard list of the inputs commonly used and corresponding reference for the information. This would provide the checker of a calculation a place to sign off, indicating they concur with the input and acknowledge the source of the input. In the end, your documentation should tell a complete story.
Pipe stress analysis computer models are a series of 3-D beam elements that create a depiction of the piping geometry. Three-dimensional beam elements are the most efficient way to model the piping system, but not necessarily the most accurate; and without complex finite element models, it is nearly impossible to account for everything. However, it is known from historical empirical testing that these methods and 3-D beam computer models demonstrate enough behavior that they are a good approximation. In addition, piping codes, such as ASME B31, have safety margins that allow for approximation. That being said, there are some pitfalls with modeling piping systems that one should avoid:
The computer models are only as good as the information entered into them. It is important when developing a pipe stress analysis, as with any finite element analysis (FEA) model, to also understand the physics and boundary conditions of the model.
Elements used to model the piping system have their limitations. One-dimensional beam elements are great for straight pieces of piping, but not so good with pipe fittings (elbows, tees, reducers, etc.). Therefore, ASME has developed stress-intensification factors (SIFs) for piping fittings through empirical testing. They allow for greater approximation without using complex FEA models with shells, plates, and brick elements.
It is important to make sure these limitations are considered when developing a pipe stress analysis. Most pipe stress analyses do not perform like a high-powered FEA software package.
The computer models are only as good as the information entered into them. It is important when developing a pipe stress analysis, as with any finite element analysis (FEA) model, to also understand the physics and boundary conditions of the model.
Elements used to model the piping system have their limitations. One-dimensional beam elements are great for straight pieces of piping, but not so good with pipe fittings (elbows, tees, reducers, etc.). Therefore, ASME has developed stress-intensification factors (SIFs) for piping fittings through empirical testing. They allow for greater approximation without using complex FEA models with shells, plates, and brick elements.
It is important to make sure these limitations are considered when developing a pipe stress analysis. Most pipe stress analyses do not perform like a high-powered FEA software package.
⬇️⬇️ Three-dimensional beam element
The 3-D beam element behaviors are dominated by bending moments. As mentioned above, it is efficient for most analyses and sufficient for system analysis. However, there are downsides to using a 3-D beam element:
1. No localized effects will be seen on the pipe wall.No second-order effects.
2. No large rotation.
3. No accounting for a large shear load.Wall deflection occurs before bending failure. Short, fat cantilever versus long and skinny.
4. No shell/wall effects can be seen
The 3-D beam element behaviors are dominated by bending moments. As mentioned above, it is efficient for most analyses and sufficient for system analysis. However, there are downsides to using a 3-D beam element:
1. No localized effects will be seen on the pipe wall.No second-order effects.
2. No large rotation.
3. No accounting for a large shear load.Wall deflection occurs before bending failure. Short, fat cantilever versus long and skinny.
4. No shell/wall effects can be seen
🛠 Manufacturers Standardization Society (MSS) SP-58:
Pipe Hangers and Supports—Materials, Design, Manufacture, Selection, Application, and Installation recommends support spans to be based on deflection criteria of approximately 0.125 in. or less between supports. The deflection criteria assume a simply supported beam. However, a supported piping system is a continuously supported beam that reduces reaction and moments at each support, further reducing the deflection between supports. This negates the bending moments between supports and reduces the bending moment term of sustained stress.
Pipe Hangers and Supports—Materials, Design, Manufacture, Selection, Application, and Installation recommends support spans to be based on deflection criteria of approximately 0.125 in. or less between supports. The deflection criteria assume a simply supported beam. However, a supported piping system is a continuously supported beam that reduces reaction and moments at each support, further reducing the deflection between supports. This negates the bending moments between supports and reduces the bending moment term of sustained stress.
⬇️ Standard span guidelines
Below are some general thoughts on standard pipe spans to consider:
1. Fluid has a greater impact as the pipe size becomes larger. Water weight is more than pipe weight for 12 in. nominal pipe size (NPS) for standard wall thickness (STD), or greater.
2. When concentrated loads, such as flanges, valves, and piping specialties, are present between pipe supports, the recommended span should be reduced to account for them.
3. A pipe support should be placed within one-third the recommended span of a rotating equipment connection to minimize vertical load and moments at connection. In most cases, this support should be a variable spring to help with adjustment and reduce translation vibration.
4. When piping changes horizontal direction, the recommended span between pipe supports shall be reduced by 25%.
Below are some general thoughts on standard pipe spans to consider:
1. Fluid has a greater impact as the pipe size becomes larger. Water weight is more than pipe weight for 12 in. nominal pipe size (NPS) for standard wall thickness (STD), or greater.
2. When concentrated loads, such as flanges, valves, and piping specialties, are present between pipe supports, the recommended span should be reduced to account for them.
3. A pipe support should be placed within one-third the recommended span of a rotating equipment connection to minimize vertical load and moments at connection. In most cases, this support should be a variable spring to help with adjustment and reduce translation vibration.
4. When piping changes horizontal direction, the recommended span between pipe supports shall be reduced by 25%.
⬇️⬇️Displacement stresses
In most cases, if displacement or expansion stresses are perceived to be a concern (e.g., elevated temperatures), then a computerized pipe stress analysis is required. If a computerized analysis is performed, displacement stresses should be kept at 80% to 90% of what the code allows.
Typically, this recommendation is met by ensuring the equipment connection loads are within published allowable code stresses through adding flexibility to the piping system. Flexible piping systems typically have low displacement stresses because the piping can grow freely.
In most cases, if displacement or expansion stresses are perceived to be a concern (e.g., elevated temperatures), then a computerized pipe stress analysis is required. If a computerized analysis is performed, displacement stresses should be kept at 80% to 90% of what the code allows.
Typically, this recommendation is met by ensuring the equipment connection loads are within published allowable code stresses through adding flexibility to the piping system. Flexible piping systems typically have low displacement stresses because the piping can grow freely.
⬇️⬇️ Jacketed Pipe
Jacketed piping can be idealized as two piping systems running along coincident lines in space. The two piping systems are of two different sizes, so the smaller runs inside of the larger. The internal pipe contains the piped fluid, while the outer pipe (the jacket) is used for protection or to carry a heated fluid to warm that in the inner pipe.
Jacketed piping can be idealized as two piping systems running along coincident lines in space. The two piping systems are of two different sizes, so the smaller runs inside of the larger. The internal pipe contains the piped fluid, while the outer pipe (the jacket) is used for protection or to carry a heated fluid to warm that in the inner pipe.