This media is not supported in your browser
VIEW IN TELEGRAM
Video from Akbar Daneshvar
This media is not supported in your browser
VIEW IN TELEGRAM
Video from Akbar Daneshvar
Forwarded from Piping Stress Analysis (PSA Group)
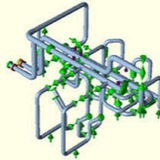
Advanced Piping Products, 3D VibraTek Hold Down Clamp Animation ⬇️⬇️⬇️
Forwarded from Piping Stress Analysis (PSA Group)
Forwarded from Piping Stress Analysis (PSA Group)
Failure Criteria:⬇️
While preparing fatigue curves, the strains obtained in the tests are multiplied by one-half of the elastic modulus to obtain pseudo stress amplitude. This pseudo stress is directly compared with the stresses calculated on the assumption of elastic behavior of piping. During piping stress analysis, a stress called the alternating stress (Salt) is used which is defined as one-half of the calculated peak stress. Fatigue failure can be prevented by ensuring that the number of load cycles (N) associated with a specific alternating stress is less than the number allowed in the S–N curve or endurance curve. But in practical service conditions a piping system is subjected to alternating stresses of different magnitudes. These changes in magnitudes make the direct use of the fatigue curves inapplicable since the curves are based on constant-stress amplitude.
Fatigue tests of metallic materials and structures have provided the following main clues to the basic nature of fatigue:
* Fatigue failure, or cracking under repeated stress much lower than the ultimate tensile strength, is shown in most metals and alloys that exhibit some ductility in static tests. The magnitude of the applied alternating stress range is the controlling fatigue life parameter.
* Failure depends upon the number of repetitions of a given range of stress rather than the total time under load. The speed of loading is a factor of secondary importance, except at elevated temperatures.
* Some metals, including ferrous alloys, have a safe range of stress. Below this stress, called the “endurance limit or fatigue limit”, failure does not occur irrespective of the number of stress cycles.
* Notches, grooves, or other discontinuities of section greatly decrease the stress amplitude that can be sustained for a given number of cycles.
* The range of stress necessary to produce failure in a fixed number of cycles usually decrease as the mean tension stress of the loading cycle is increased.
* Examination of fatigue fracture shows evidence of microscopic deformation, ever in the apparently brittle region of origin and propagates of the crack. The plastic deformation that accompanies a spreading fatigue crack is usually limited in extent to regions very near the crack.
Therefore, to make fatigue curves applicable for piping, some alternate approach is necessary.
One hypothesis asserts that the damage fraction of any stress level S, is linearly proportional to the Ratio of the number of cycles of operation at the stress level to the total number of cycles that would produce failure at that stress level. This means that failure is predicted to occur if U≥1.0 where U= Usage factor = ∑(ni/Ni) for all stress levels Where, ni= number of cycles operating at stress level i , Ni= number of cycles to failure at stress level i as per material fatigue curve.
While preparing fatigue curves, the strains obtained in the tests are multiplied by one-half of the elastic modulus to obtain pseudo stress amplitude. This pseudo stress is directly compared with the stresses calculated on the assumption of elastic behavior of piping. During piping stress analysis, a stress called the alternating stress (Salt) is used which is defined as one-half of the calculated peak stress. Fatigue failure can be prevented by ensuring that the number of load cycles (N) associated with a specific alternating stress is less than the number allowed in the S–N curve or endurance curve. But in practical service conditions a piping system is subjected to alternating stresses of different magnitudes. These changes in magnitudes make the direct use of the fatigue curves inapplicable since the curves are based on constant-stress amplitude.
Fatigue tests of metallic materials and structures have provided the following main clues to the basic nature of fatigue:
* Fatigue failure, or cracking under repeated stress much lower than the ultimate tensile strength, is shown in most metals and alloys that exhibit some ductility in static tests. The magnitude of the applied alternating stress range is the controlling fatigue life parameter.
* Failure depends upon the number of repetitions of a given range of stress rather than the total time under load. The speed of loading is a factor of secondary importance, except at elevated temperatures.
* Some metals, including ferrous alloys, have a safe range of stress. Below this stress, called the “endurance limit or fatigue limit”, failure does not occur irrespective of the number of stress cycles.
* Notches, grooves, or other discontinuities of section greatly decrease the stress amplitude that can be sustained for a given number of cycles.
* The range of stress necessary to produce failure in a fixed number of cycles usually decrease as the mean tension stress of the loading cycle is increased.
* Examination of fatigue fracture shows evidence of microscopic deformation, ever in the apparently brittle region of origin and propagates of the crack. The plastic deformation that accompanies a spreading fatigue crack is usually limited in extent to regions very near the crack.
Therefore, to make fatigue curves applicable for piping, some alternate approach is necessary.
One hypothesis asserts that the damage fraction of any stress level S, is linearly proportional to the Ratio of the number of cycles of operation at the stress level to the total number of cycles that would produce failure at that stress level. This means that failure is predicted to occur if U≥1.0 where U= Usage factor = ∑(ni/Ni) for all stress levels Where, ni= number of cycles operating at stress level i , Ni= number of cycles to failure at stress level i as per material fatigue curve.
After stress analysis of a piping system is complete, a report package is created. It helps in documenting stress analysis done on that particular piping system. It should be submitted to client for preservation throughout lifetime of the plant. ⬇️
It Includes following components.
1.Basic input data and calculated conditions
2.Layout isometric and supports configuration including gaps/limit stops
3.Calculated member forces and stresses for different load cases
4.Forces, moments and displacement reports
5.Spring Hangers design parameters
6.Additional requirements (reinforcement pad etc.)
7.Flange leakage checks if applicable.
8.WRC 107/WRC 297 checks.
9.Allowable Stress Range.
10.Expansion Bellow parameters
11.Design calculations for adequacy of supporting elements
12.Loads at interface B/L with ISBL/OSBL if any.
13.Analysis of segments till nearest anchor at battery limit
14.Basis of allowable forces and moments & wherever applicable vendor given allowable
15.loads/moments.
16.Allowable equipment load check
17.Codal Check.
1.Basic input data and calculated conditions
2.Layout isometric and supports configuration including gaps/limit stops
3.Calculated member forces and stresses for different load cases
4.Forces, moments and displacement reports
5.Spring Hangers design parameters
6.Additional requirements (reinforcement pad etc.)
7.Flange leakage checks if applicable.
8.WRC 107/WRC 297 checks.
9.Allowable Stress Range.
10.Expansion Bellow parameters
11.Design calculations for adequacy of supporting elements
12.Loads at interface B/L with ISBL/OSBL if any.
13.Analysis of segments till nearest anchor at battery limit
14.Basis of allowable forces and moments & wherever applicable vendor given allowable
15.loads/moments.
16.Allowable equipment load check
17.Codal Check.
CAESAR II stress analysis reports.
Displacements Report
In this report, translations and rotations for each degree of freedom are reported at each node in the model.
Restraints Report
In this report, forces and moments on each restraint in the model are reported. There is a separate report generated for each load case selected.
Restraint Summary
This report is similar to the restraint report, this option provides force and moment data for all valid selected load cases together on one report.
Global Element Forces
Forces and moments on the piping are reported for each node in the model.
Local Element Forces
These forces and moments have been transferring into the CAESAR II local coordinate system.
Stresses
SIFs and Code Stresses are reported for each node in the model. The code stresses are compared to the Allowable stress at each node as a percentage. Note that stresses are not computed at nodes on rigid elements.
Sorted Stress
Bending, Torsion, and Code Stress each are sorted from highest to lowest value with corresponding node numbers.
Code Compliance Report
Stress checks for multiple load cases may be included in a single report using the Code Compliance report, available from the Static Output processor. For this report, the user selects all load cases of interest, and then highlights Code Compliance under the Report Options. The resultant report shows the stress calculation for all load cases together, on an element-by-element basis.
Cumulative Usage Report
The Cumulative Usage report is available only when there are one or more fatigue-type load cases present. One Cumulative Usage report is generated, regardless of the number of load cases selected, showing the combined impact of simulating selected fatigue loadings.
Load Case Report
The Load Case Report documents the Basic Names (as built in the Load Case Builder),
User-Defined Names, Combination Methods, Load Cycles, and Load Case Options (Output Status, Output Type, Snubber Status, Hanger Stiffness Status, and Friction Multiplier) of the static load cases. This report is available from the General computed Results column of the static Output Processor.
Hanger Table with Text
This report provides basic information regarding spring hangers either selected by
CAESAR II or the user. Information provided includes the node number, the number of springs required, the hanger table figure number and size, the hot load, the theoretical installed load, which is what the hangers are set to in the field prior to pulling the pins, the actual installed load, which is the load on the hanger when the pipe is empty, the spring rate from the catalog, and the horizontal movement determined from the CAESAR II output.
Displacements Report
In this report, translations and rotations for each degree of freedom are reported at each node in the model.
Restraints Report
In this report, forces and moments on each restraint in the model are reported. There is a separate report generated for each load case selected.
Restraint Summary
This report is similar to the restraint report, this option provides force and moment data for all valid selected load cases together on one report.
Global Element Forces
Forces and moments on the piping are reported for each node in the model.
Local Element Forces
These forces and moments have been transferring into the CAESAR II local coordinate system.
Stresses
SIFs and Code Stresses are reported for each node in the model. The code stresses are compared to the Allowable stress at each node as a percentage. Note that stresses are not computed at nodes on rigid elements.
Sorted Stress
Bending, Torsion, and Code Stress each are sorted from highest to lowest value with corresponding node numbers.
Code Compliance Report
Stress checks for multiple load cases may be included in a single report using the Code Compliance report, available from the Static Output processor. For this report, the user selects all load cases of interest, and then highlights Code Compliance under the Report Options. The resultant report shows the stress calculation for all load cases together, on an element-by-element basis.
Cumulative Usage Report
The Cumulative Usage report is available only when there are one or more fatigue-type load cases present. One Cumulative Usage report is generated, regardless of the number of load cases selected, showing the combined impact of simulating selected fatigue loadings.
Load Case Report
The Load Case Report documents the Basic Names (as built in the Load Case Builder),
User-Defined Names, Combination Methods, Load Cycles, and Load Case Options (Output Status, Output Type, Snubber Status, Hanger Stiffness Status, and Friction Multiplier) of the static load cases. This report is available from the General computed Results column of the static Output Processor.
Hanger Table with Text
This report provides basic information regarding spring hangers either selected by
CAESAR II or the user. Information provided includes the node number, the number of springs required, the hanger table figure number and size, the hot load, the theoretical installed load, which is what the hangers are set to in the field prior to pulling the pins, the actual installed load, which is the load on the hanger when the pipe is empty, the spring rate from the catalog, and the horizontal movement determined from the CAESAR II output.
Input Echo:
The input echo allows the user to select which portions of the input are to be reported in this output format. All basic element data (geometry), operating conditions, material properties, and boundary conditions are available in this report option.
Miscellaneous Data:
This report displays the Allowable Stress Summary, Bend Data, Nozzle Flexibility Data, Pipe Report, Thermal Expansion Coefficients used during analysis, Bill of Materials, the Center of Gravity Report, and Wind and Wave input data.
Warnings Report:
All warnings reported during the error checking process are summarized here.
The input echo allows the user to select which portions of the input are to be reported in this output format. All basic element data (geometry), operating conditions, material properties, and boundary conditions are available in this report option.
Miscellaneous Data:
This report displays the Allowable Stress Summary, Bend Data, Nozzle Flexibility Data, Pipe Report, Thermal Expansion Coefficients used during analysis, Bill of Materials, the Center of Gravity Report, and Wind and Wave input data.
Warnings Report:
All warnings reported during the error checking process are summarized here.
Supporting of piping on Pipe Racks and Pipe Ways involves providing rest, guides, limit stops and anchors in a piping header.
Guides ⬇️
Guides on a pipe header shall be arranged as shown in following diagram.
Guides on a pipe header shall be arranged as shown in following diagram.
Notes : ⬇️⬇️
1. “L1” is the minimum length necessary to permit the piping maximum thermal expansion of 120 mm.
2. “B” is the dimension of loop as per stress analysis.
3. Pipe racks and pipe ways usually have spans of 6 to 8 Meters.
So for pipes 6″ and smaller, guides are required on each main beam.
For pipes more than 6″ NPS, guides on alternate beams can be provided.
1. “L1” is the minimum length necessary to permit the piping maximum thermal expansion of 120 mm.
2. “B” is the dimension of loop as per stress analysis.
3. Pipe racks and pipe ways usually have spans of 6 to 8 Meters.
So for pipes 6″ and smaller, guides are required on each main beam.
For pipes more than 6″ NPS, guides on alternate beams can be provided.
Rest Supports ⬇️⬇️
Maximum distance between supports shall not be higher than allowed particular material of construction at particular operating conditions. Refer company standards for the same.
1. Maximum allowable spans for metallic piping.
2. Maximum allowable spans for Cupro-Nickel Piping.
3. Maximum allowable spans for Plastic Piping.
Maximum distance between supports shall not be higher than allowed particular material of construction at particular operating conditions. Refer company standards for the same.
1. Maximum allowable spans for metallic piping.
2. Maximum allowable spans for Cupro-Nickel Piping.
3. Maximum allowable spans for Plastic Piping.
Sloped Piping ⬇️⬇️
For all pipes which require a slope towards a definite direction, the max allowable span should be such that max deflection of pipe is less than the level difference between two adjacent support points, in order to avoid pockets.
For all pipes which require a slope towards a definite direction, the max allowable span should be such that max deflection of pipe is less than the level difference between two adjacent support points, in order to avoid pockets.