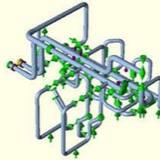
Pipe Support Design Series Type-1 Using Solidwork |Vibration Control Pipe Support ⬇️⬇️
This media is not supported in your browser
VIEW IN TELEGRAM
Video from Akbar Daneshvar
This media is not supported in your browser
VIEW IN TELEGRAM
Video from Akbar Daneshvar
Forwarded from Piping Stress Analysis (PSA Group)
Advanced Piping Products, 3D VibraTek Hold Down Clamp Animation ⬇️⬇️⬇️
Forwarded from Piping Stress Analysis (PSA Group)
Forwarded from Piping Stress Analysis (PSA Group)
Failure Criteria:⬇️
While preparing fatigue curves, the strains obtained in the tests are multiplied by one-half of the elastic modulus to obtain pseudo stress amplitude. This pseudo stress is directly compared with the stresses calculated on the assumption of elastic behavior of piping. During piping stress analysis, a stress called the alternating stress (Salt) is used which is defined as one-half of the calculated peak stress. Fatigue failure can be prevented by ensuring that the number of load cycles (N) associated with a specific alternating stress is less than the number allowed in the S–N curve or endurance curve. But in practical service conditions a piping system is subjected to alternating stresses of different magnitudes. These changes in magnitudes make the direct use of the fatigue curves inapplicable since the curves are based on constant-stress amplitude.
Fatigue tests of metallic materials and structures have provided the following main clues to the basic nature of fatigue:
* Fatigue failure, or cracking under repeated stress much lower than the ultimate tensile strength, is shown in most metals and alloys that exhibit some ductility in static tests. The magnitude of the applied alternating stress range is the controlling fatigue life parameter.
* Failure depends upon the number of repetitions of a given range of stress rather than the total time under load. The speed of loading is a factor of secondary importance, except at elevated temperatures.
* Some metals, including ferrous alloys, have a safe range of stress. Below this stress, called the “endurance limit or fatigue limit”, failure does not occur irrespective of the number of stress cycles.
* Notches, grooves, or other discontinuities of section greatly decrease the stress amplitude that can be sustained for a given number of cycles.
* The range of stress necessary to produce failure in a fixed number of cycles usually decrease as the mean tension stress of the loading cycle is increased.
* Examination of fatigue fracture shows evidence of microscopic deformation, ever in the apparently brittle region of origin and propagates of the crack. The plastic deformation that accompanies a spreading fatigue crack is usually limited in extent to regions very near the crack.
Therefore, to make fatigue curves applicable for piping, some alternate approach is necessary.
One hypothesis asserts that the damage fraction of any stress level S, is linearly proportional to the Ratio of the number of cycles of operation at the stress level to the total number of cycles that would produce failure at that stress level. This means that failure is predicted to occur if U≥1.0 where U= Usage factor = ∑(ni/Ni) for all stress levels Where, ni= number of cycles operating at stress level i , Ni= number of cycles to failure at stress level i as per material fatigue curve.
While preparing fatigue curves, the strains obtained in the tests are multiplied by one-half of the elastic modulus to obtain pseudo stress amplitude. This pseudo stress is directly compared with the stresses calculated on the assumption of elastic behavior of piping. During piping stress analysis, a stress called the alternating stress (Salt) is used which is defined as one-half of the calculated peak stress. Fatigue failure can be prevented by ensuring that the number of load cycles (N) associated with a specific alternating stress is less than the number allowed in the S–N curve or endurance curve. But in practical service conditions a piping system is subjected to alternating stresses of different magnitudes. These changes in magnitudes make the direct use of the fatigue curves inapplicable since the curves are based on constant-stress amplitude.
Fatigue tests of metallic materials and structures have provided the following main clues to the basic nature of fatigue:
* Fatigue failure, or cracking under repeated stress much lower than the ultimate tensile strength, is shown in most metals and alloys that exhibit some ductility in static tests. The magnitude of the applied alternating stress range is the controlling fatigue life parameter.
* Failure depends upon the number of repetitions of a given range of stress rather than the total time under load. The speed of loading is a factor of secondary importance, except at elevated temperatures.
* Some metals, including ferrous alloys, have a safe range of stress. Below this stress, called the “endurance limit or fatigue limit”, failure does not occur irrespective of the number of stress cycles.
* Notches, grooves, or other discontinuities of section greatly decrease the stress amplitude that can be sustained for a given number of cycles.
* The range of stress necessary to produce failure in a fixed number of cycles usually decrease as the mean tension stress of the loading cycle is increased.
* Examination of fatigue fracture shows evidence of microscopic deformation, ever in the apparently brittle region of origin and propagates of the crack. The plastic deformation that accompanies a spreading fatigue crack is usually limited in extent to regions very near the crack.
Therefore, to make fatigue curves applicable for piping, some alternate approach is necessary.
One hypothesis asserts that the damage fraction of any stress level S, is linearly proportional to the Ratio of the number of cycles of operation at the stress level to the total number of cycles that would produce failure at that stress level. This means that failure is predicted to occur if U≥1.0 where U= Usage factor = ∑(ni/Ni) for all stress levels Where, ni= number of cycles operating at stress level i , Ni= number of cycles to failure at stress level i as per material fatigue curve.