Forwarded from Piping Stress Analysis (PSA Group)
Sample Results
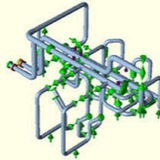
Consider a sample piping system consisting of four parallel air-coolers. Each air-cooler has four inlet nozzles that are connected to the process unit through a 20” diameter, ¼” thick, ASTM A672 B60 pipe header. The final section of the feed pipe consists of an extremely flexible pipe arrangement in order to reduce piping loads on the equipment nozzles. The fluid is a hydrocarbon gas at 450 °C.
The PCS model consisted of 142053 linear quadrilateral elements of type S4R, geometrically non-linear and the material model was linear elastic. The evaluation of the four load steps took less than 6 minutes on a standard desktop computer (i7-4790 @ 3.6 Ghz), running Abaqus Standard on a single processor.
Figure 15 present PCS stress results for the load step WNC+P1+T1, which consists of loadings from piping weight with no contents (WNC), pipe pressure (P1), and pipe temperature (T1). These results were compared to the ASME B31.3, calculated using Coade Caesar II 5.1, a standard pipe flexibility analysis software.
The stresses computed with Caesar II converted into cycles through Markl’s methodology were compared to cycles calculated according to ASME master S-N curve. The master S-N curve approach resulted on a fatigue life 20% higher than Markl’s. Differences of up to 120% on nozzles reaction forces were found between the two approaches. These differences may be attributed to inaccuracies of ASME B31.3 flexibility factors that are of great importance on compact regions with several pipe fittings, such as the nozzle region of this model.
The Caesar II calculation, indicates that the piping system needs to be redesigned due to overstress, while calculation through PCS and ASME VIII div. 2 part 5 clears the system for safe operation.
Consider a sample piping system consisting of four parallel air-coolers. Each air-cooler has four inlet nozzles that are connected to the process unit through a 20” diameter, ¼” thick, ASTM A672 B60 pipe header. The final section of the feed pipe consists of an extremely flexible pipe arrangement in order to reduce piping loads on the equipment nozzles. The fluid is a hydrocarbon gas at 450 °C.
The PCS model consisted of 142053 linear quadrilateral elements of type S4R, geometrically non-linear and the material model was linear elastic. The evaluation of the four load steps took less than 6 minutes on a standard desktop computer (i7-4790 @ 3.6 Ghz), running Abaqus Standard on a single processor.
Figure 15 present PCS stress results for the load step WNC+P1+T1, which consists of loadings from piping weight with no contents (WNC), pipe pressure (P1), and pipe temperature (T1). These results were compared to the ASME B31.3, calculated using Coade Caesar II 5.1, a standard pipe flexibility analysis software.
The stresses computed with Caesar II converted into cycles through Markl’s methodology were compared to cycles calculated according to ASME master S-N curve. The master S-N curve approach resulted on a fatigue life 20% higher than Markl’s. Differences of up to 120% on nozzles reaction forces were found between the two approaches. These differences may be attributed to inaccuracies of ASME B31.3 flexibility factors that are of great importance on compact regions with several pipe fittings, such as the nozzle region of this model.
The Caesar II calculation, indicates that the piping system needs to be redesigned due to overstress, while calculation through PCS and ASME VIII div. 2 part 5 clears the system for safe operation.
CAESAR II : Using FEA Results with CAESAR II designs(Part I) ⬇️⬇️⬇️⬇️
CAESAR II : Using FEA Results with CAESAR II designs(Part II) ⬇️⬇️⬇️⬇️⬇️
CAESAR II : Using FEA Results with CAESAR II designs(Part III)⬇️⬇️⬇️⬇️⬇️⬇️
CAESAR II & PV Elite : Accuracy with FEA Tools (Part I)⬇️
CAESAR II & PV Elite : Accuracy with FEA Tools (Part II) ⬇️⬇️
Piping Stress Analysis (PSA Group)
SPS-01-02.pdf
Special pipe support Design ana Analysis