1-Top Connection plate
2-Bottom connection plate
3-Serial Number plate
4-Position Indicator
5-Housing
6-Fluid
7-Piston
2-Bottom connection plate
3-Serial Number plate
4-Position Indicator
5-Housing
6-Fluid
7-Piston
System Description ⬇️
The system consists of 12-inch control valve piping which is observed to be vibrating at site. Also this line is running at different
flow rate condition. [5] The line serves between Potassium carbonate solutions to the rich solution flash tank. Points at which
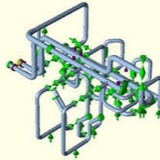
Amplitude of Vibration is noted in the System were noted as A, B, C, D, E, F, G, H, & I as shown in below Figure.
The system consists of 12-inch control valve piping which is observed to be vibrating at site. Also this line is running at different
flow rate condition. [5] The line serves between Potassium carbonate solutions to the rich solution flash tank. Points at which
Amplitude of Vibration is noted in the System were noted as A, B, C, D, E, F, G, H, & I as shown in below Figure.
Approach towards Solution⬇️
Following approach has been applied to find most probable solution to Vibration problem in 12- inch control valve.
- A Qualitative Analysis has been carried out to identify the potential Excitation Mechanism that may exist. (LOW to HIGH).
- A Quantitative Analysis of an LOF score for each identified excitation mechanism from Qualitative Analysis and Periodic flow frequency calculation.
- Based on LOF score (0-1) Recommendation & corrective Actions have been recommended.
- Dynamic stress Analysis of the system using CAESAR-II to simulate analysis model with site observations.
- To propose corrective actions using results.
Following approach has been applied to find most probable solution to Vibration problem in 12- inch control valve.
- A Qualitative Analysis has been carried out to identify the potential Excitation Mechanism that may exist. (LOW to HIGH).
- A Quantitative Analysis of an LOF score for each identified excitation mechanism from Qualitative Analysis and Periodic flow frequency calculation.
- Based on LOF score (0-1) Recommendation & corrective Actions have been recommended.
- Dynamic stress Analysis of the system using CAESAR-II to simulate analysis model with site observations.
- To propose corrective actions using results.
Step 1: Determine ρv^2
For single phase flow ρv^2 = (actual density) x (actual velocity)
Kinetic Energy =1169×4.2782
Kinetic Energy =21934.201 kg/m-s^2
For single phase flow ρv^2 = (actual density) x (actual velocity)
Kinetic Energy =1169×4.2782
Kinetic Energy =21934.201 kg/m-s^2
Step 2: Determine Fluid Viscosity Factor
As the fluid in this example is gas the fluid viscosity factor (FVF) must be calculated; this requires the gas dynamic viscosity (μgas).
Fluid Viscosity Factor (FVF) = √μ / √1×10⁻³ (2)
Fluid Viscosity Factor (FVF) = √0.25 / √1×10⁻³
Fluid Viscosity Factor (FVF) = 15.82
As the fluid in this example is gas the fluid viscosity factor (FVF) must be calculated; this requires the gas dynamic viscosity (μgas).
Fluid Viscosity Factor (FVF) = √μ / √1×10⁻³ (2)
Fluid Viscosity Factor (FVF) = √0.25 / √1×10⁻³
Fluid Viscosity Factor (FVF) = 15.82
Step 3: Determine Support Arrangement
The pipe support arrangement must now be determined. This requires the maximum span lengths between supports to be identified and compared with the criteria.
In all cases the support classification is “Stiff” (14 -16Hz).
The pipe support arrangement must now be determined. This requires the maximum span lengths between supports to be identified and compared with the criteria.
In all cases the support classification is “Stiff” (14 -16Hz).
Step 4: Determine Flow Induced Vibration Factor Fv
Flow Induced Vibration Factor (Fv) = 𝛼(𝐷𝑒𝑥𝑡/𝑇)^𝛽
Flow Induced Vibration Factor (Fv) = 686540(323.8 / 10.35)^−0.80
Flow Induced Vibration Factor (Fv) = 44183
Flow Induced Vibration Factor (Fv) = 𝛼(𝐷𝑒𝑥𝑡/𝑇)^𝛽
Flow Induced Vibration Factor (Fv) = 686540(323.8 / 10.35)^−0.80
Flow Induced Vibration Factor (Fv) = 44183
Step 5: Calculation of Likelihood of Failure (LOF)
Finally, the LOF for each line is calculated using:
Likelihood of Failure (LOF) = (𝜌𝑉^2 / Fv)×FVF
Likelihood of Failure (LOF) = (21394.20/ 44183)×15.82
Likelihood of Failure (LOF) = 7.661
As the value of Likelihood of Failure (LOF) for both the PSV is greater than 1, some corrective Actions should be taken to reduce the value of LOF below 1.
Finally, the LOF for each line is calculated using:
Likelihood of Failure (LOF) = (𝜌𝑉^2 / Fv)×FVF
Likelihood of Failure (LOF) = (21394.20/ 44183)×15.82
Likelihood of Failure (LOF) = 7.661
As the value of Likelihood of Failure (LOF) for both the PSV is greater than 1, some corrective Actions should be taken to reduce the value of LOF below 1.
The static model is generated to check the overall behavior of the pipe and supports. It has been informed that no supports at site are ‘lifting off’. Hence it can be concluded that all the rest supports are active. This is due to the fact that the supports are resting on platform connected to Flash Tank. The problem is then needs to be solved mainly for vibration purpose considering linear boundary conditions. The original model is shown following Figure.
Based on vibration analysis report the harmonic analysis has been performed to simulate site conditions. The Vibration Survey Report has been used to simulate the model. The result obtained at 265kg/sec flow rate nearest to the control valve (Point D as per vibration measurement report) as shown in Fig. 3 (a) has been considered as bench mark results for comparison near to the control valve LV6301. The Vertical displacement of 215.4 microns found to be the largest amplitude [5].
Following table provides the comparison between actual data and calculated values.
Following table provides the comparison between actual data and calculated values.
Since the most probable source of vibration is the Flow Induced Turbulence in the control valve, the permanent solution may call for flow change and piping layout changes. However, at present the scope is to make minimum changes in the existing piping and that too without taking shut down. Hence, the scope is limited to avoid vibration transferring to the structure. The Detailed harmonic analysis suggested providing a viscoelastic damper to isolate the vibrations transferred to the structure. However, the before implementing this big change it is recommended to explore the option of Isolating pads.