Pipe will exhibit a series of natural frequencies which depends on the distribution of mass and stiffness throughout the system, and the distribution are influenced pipe diameter, material properties, wall thickness, location of lumped masses (such as valves), pipe supports and also fluid density. Each natural frequency will have unique deflection shape associated with it, which is called mode shapes, which has the locations of zero motion (node) and maximum motion (Antinodes). The response of the pipe work to an applied excitation is dependent upon the relationship between the frequency of excitation and the system’s natural frequencies. Vibration generated in the pipe work may lead to high cycle fatigue of components (such as Small bore connections) or the failure at welds in the main line itself.
Flow-induced vibration, or vortex shedding, is due to high flow velocities and High mass flow rates such as in a piping dead leg of a centrifugal compressor system. with certain flow conditions, piping systems will develop high levels of noise and vibration that can damage the pipes and related systems such as tube bundles, side cavities, and bluff or tapered bodies in flow streams. Pipe damage compromises plant safety, forces shutdowns, increases maintenance, and reduces efficiency and capacity.
1-Top Connection plate
2-Bottom connection plate
3-Serial Number plate
4-Position Indicator
5-Housing
6-Fluid
7-Piston
2-Bottom connection plate
3-Serial Number plate
4-Position Indicator
5-Housing
6-Fluid
7-Piston
System Description ⬇️
The system consists of 12-inch control valve piping which is observed to be vibrating at site. Also this line is running at different
flow rate condition. [5] The line serves between Potassium carbonate solutions to the rich solution flash tank. Points at which
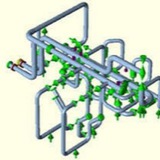
Amplitude of Vibration is noted in the System were noted as A, B, C, D, E, F, G, H, & I as shown in below Figure.
The system consists of 12-inch control valve piping which is observed to be vibrating at site. Also this line is running at different
flow rate condition. [5] The line serves between Potassium carbonate solutions to the rich solution flash tank. Points at which
Amplitude of Vibration is noted in the System were noted as A, B, C, D, E, F, G, H, & I as shown in below Figure.
Approach towards Solution⬇️
Following approach has been applied to find most probable solution to Vibration problem in 12- inch control valve.
- A Qualitative Analysis has been carried out to identify the potential Excitation Mechanism that may exist. (LOW to HIGH).
- A Quantitative Analysis of an LOF score for each identified excitation mechanism from Qualitative Analysis and Periodic flow frequency calculation.
- Based on LOF score (0-1) Recommendation & corrective Actions have been recommended.
- Dynamic stress Analysis of the system using CAESAR-II to simulate analysis model with site observations.
- To propose corrective actions using results.
Following approach has been applied to find most probable solution to Vibration problem in 12- inch control valve.
- A Qualitative Analysis has been carried out to identify the potential Excitation Mechanism that may exist. (LOW to HIGH).
- A Quantitative Analysis of an LOF score for each identified excitation mechanism from Qualitative Analysis and Periodic flow frequency calculation.
- Based on LOF score (0-1) Recommendation & corrective Actions have been recommended.
- Dynamic stress Analysis of the system using CAESAR-II to simulate analysis model with site observations.
- To propose corrective actions using results.
Step 1: Determine ρv^2
For single phase flow ρv^2 = (actual density) x (actual velocity)
Kinetic Energy =1169×4.2782
Kinetic Energy =21934.201 kg/m-s^2
For single phase flow ρv^2 = (actual density) x (actual velocity)
Kinetic Energy =1169×4.2782
Kinetic Energy =21934.201 kg/m-s^2
Step 2: Determine Fluid Viscosity Factor
As the fluid in this example is gas the fluid viscosity factor (FVF) must be calculated; this requires the gas dynamic viscosity (μgas).
Fluid Viscosity Factor (FVF) = √μ / √1×10⁻³ (2)
Fluid Viscosity Factor (FVF) = √0.25 / √1×10⁻³
Fluid Viscosity Factor (FVF) = 15.82
As the fluid in this example is gas the fluid viscosity factor (FVF) must be calculated; this requires the gas dynamic viscosity (μgas).
Fluid Viscosity Factor (FVF) = √μ / √1×10⁻³ (2)
Fluid Viscosity Factor (FVF) = √0.25 / √1×10⁻³
Fluid Viscosity Factor (FVF) = 15.82
Step 3: Determine Support Arrangement
The pipe support arrangement must now be determined. This requires the maximum span lengths between supports to be identified and compared with the criteria.
In all cases the support classification is “Stiff” (14 -16Hz).
The pipe support arrangement must now be determined. This requires the maximum span lengths between supports to be identified and compared with the criteria.
In all cases the support classification is “Stiff” (14 -16Hz).
Step 4: Determine Flow Induced Vibration Factor Fv
Flow Induced Vibration Factor (Fv) = 𝛼(𝐷𝑒𝑥𝑡/𝑇)^𝛽
Flow Induced Vibration Factor (Fv) = 686540(323.8 / 10.35)^−0.80
Flow Induced Vibration Factor (Fv) = 44183
Flow Induced Vibration Factor (Fv) = 𝛼(𝐷𝑒𝑥𝑡/𝑇)^𝛽
Flow Induced Vibration Factor (Fv) = 686540(323.8 / 10.35)^−0.80
Flow Induced Vibration Factor (Fv) = 44183
Step 5: Calculation of Likelihood of Failure (LOF)
Finally, the LOF for each line is calculated using:
Likelihood of Failure (LOF) = (𝜌𝑉^2 / Fv)×FVF
Likelihood of Failure (LOF) = (21394.20/ 44183)×15.82
Likelihood of Failure (LOF) = 7.661
As the value of Likelihood of Failure (LOF) for both the PSV is greater than 1, some corrective Actions should be taken to reduce the value of LOF below 1.
Finally, the LOF for each line is calculated using:
Likelihood of Failure (LOF) = (𝜌𝑉^2 / Fv)×FVF
Likelihood of Failure (LOF) = (21394.20/ 44183)×15.82
Likelihood of Failure (LOF) = 7.661
As the value of Likelihood of Failure (LOF) for both the PSV is greater than 1, some corrective Actions should be taken to reduce the value of LOF below 1.
The static model is generated to check the overall behavior of the pipe and supports. It has been informed that no supports at site are ‘lifting off’. Hence it can be concluded that all the rest supports are active. This is due to the fact that the supports are resting on platform connected to Flash Tank. The problem is then needs to be solved mainly for vibration purpose considering linear boundary conditions. The original model is shown following Figure.