
On November 1, 2021 admission campaign for the Master’s program "Applied Statistics with Network Analysis" (MASNA, https://www.hse.ru/en/ma/sna/) for foreign applicants started. And we already receive the first applications!
The first wave of applications is already underway and will last until December 20. If you manage to pass all the entry stages from filing to the interview and sign the agreement before March 1, you will get a 15% discount.
Why should you apply now?
• More time to get your visa, collect your documents, and prepare to move.
• The opportunity to meet current students and alumni.
• You will be able to communicate with our professors, and decide in advance on the direction of your master’s thesis.
• You will be able to work on real projects in our Lab (https://anr.hse.ru/en/) and Analytic Workshop (https://anr.hse.ru/en/consult/workshop ).
The admission process takes quite a lot of time, which means that you may not get a discount on your tuition fees if you apply later. Hurry up!
What is MASNA?
We are MASNA - Master's program Applied Statistics with Network Analysis. MASNA is the best and unique in Russia Master's program in Applied Statistics with Network Analysis methods.
MASNA is...
- applied statistics - statistical analysis of data on real cases and specific applied research questions;
- a comprehensive approach to data analysis - from the formulation of the research question to the interpretation of research results;
- data analysis in different fields ranging from the humanities to mathematics;
- network analysis - one of the most popular areas of modern statistics.
Do you want to work in business? - MASNA allows you to choose the track "Business analytics" and learn the necessary tools to use in the corporation!
Do you feel that science is your calling? Then, for you, the track "Computational social sciences," where MASNA offers to adopt Russian and foreign scholars' experience and knowledge in the field of scientific research!
How to quickly find a needle in a haystack: special characters and search operators Google and Yandex. Part 1.
It seems that it will not be difficult in the digital age to find information, but what to do when there is so much? How to make search most effective?
Search operators and special symbols are commands for a search engine, which specify the search query itself.
Top 3 Google operators:
Operator: site: - searches for a query on the specified resource.
Example: environment site:https://rosstat.gov.ru/.
Special Symbol: "" - finds pages with an exact word or phrase.
Example: “RZD annual report” 2018
Operator: filetype: - searches for a file of the specified format upon request.
Example: Imagination sociology filetype:pdf
About these and other special symbols and search operators:
Google: https://support.google.com/websearch/answer/2466433?hl=ru
How to quickly find a needle in a haystack: special characters and search operators Google and Yandex. Part 2.
And what special symbols increase the efficiency of search in Yandex?
Top 3 Yandex operators:
Special Symbol: ! - finds pages with an exact word or phrase
Example: !slabs
Special Symbol: + - searches for pages where words from the query are combined in one sentence.
Example: +artefact + interview + sociological
Special Symbol: *
Example: "* therefore existing" - the documents containing this quote, including the missing word, will be found
About these and other special symbols and search operators:
Yandex: https://yandex.ru/support/search/query-language/qlanguage.html
What do we teach at MASNA?
There are a lot of programs on statistics, and MASNA is one. What are they taught at MASNA that our graduates work for cool international companies or are successful in research? - We will tell you!
- Applied statistics. How do you learn to analyze data if not on real-life cases and real people?
- Theory and methods. How can you skillfully master data analysis if you do not know how to justify models theoretically?
- Research program. How do you build research from problem to result?
- Toolkit. Can you call yourself an analyst if you do not know different software for different analysis methods?
- Data analysis. Do you know how to work with unstructured data and multidimensional models? What are Bayesian methods and non-parametric data analysis?
- Network analysis. Why do network analysts predict something that simple analysts cannot expect?
MASNA teaches you only what works.
Why need something else when you have MASNA?
On November 23, a master class on presentations was held as part of the Analytical Workshop seminars. Today we will share with you some secrets that could improve your presentation:
1) Our listeners have learned how to choose informative presentation templates that grab the audience's attention and don't distract from the information provided by the speaker. For example, free templates can be found at slidesalad and canva.
2) You can find interesting and matching fonts on the sites: infogra and google type. Important remarks - fonts should be sans serif and relate to the report's purpose (do not choose designer fonts - they can not be readable).
3) And this point was especially liked by our listeners. If you want to put a picture on the background that does not stand out too much, add a black rectangle, increase its transparency, and stretch it across the slide. Now you can use almost any color of text on a slide!
Come to our seminars and learn a lot about data analysis, graphing, and presentations.
One day left until the FIRST open doors day in the new academic year!
The online English-taught master’s program “Master of Data and Network Analytics” (DNA, https://www.hse.ru/en/ma/dataanalytics/) on the Coursera platform and the full-time English-taught master’s program “Master of Applied Statistics with Network Analysis” (MASNA, https://www.hse.ru/en/ma/sna/) invite you to their first open doors day in this academic year.
The event will take place in Zoom, on December 15, at 7 pm.
If you see yourself in field data analytics, consulting, or computational social sciences (PhD), then the Open Doors Day of the master’s Programs will be useful to you.
We will be glad to see you and answer all your questions! Don't forget to register: https://www.hse.ru/ma/sna/news/419852988.html
Why is MASNA right for you?
MASNA (https://www.hse.ru/en/ma/sna/) is an English-language Master's program in “Applied Statistics with Network Analysis.”
Applied statistics are advanced methods for processing, analyzing, and visualizing collected information for both description and prediction. Everything now consists of information, which is increasing rapidly. The only question is, are there enough people who know how to handle this information competently increasing? MASNA is a program that teaches you just that.
• Modern network analysis tools. Sometimes the patterns lie in the relationships.
• Quests from different business industry areas who know from experience what tools are useful and teach them using real data.
• Our professors have decades of practice under their belt. They share with students what tools are best for what task, not theoretical knowledge from textbooks. MASNA is a practical approach to solving research problems.
It's simple - if you want to work with data, MASNA is for you!
Business seminar with Anastasia Svetlichnaya - Business Intelligence (BI) in Excel
What functions can be useful in Excel when you have an enormous data set in front of you?
For example, everyone knows the function =VLOOKUP, but do you know the improved version - =XLOOKUP, which uses not one array, unlike its predecessor, but several? This allows you to account for multiple conditions at once!
And add-ons in Excel allow you to do wonders with large arrays of data. BI schema in three cool tips for the advanced analyst:
- Power Query is a technology for finding, connecting, combining, and refining data from various sources.
- Power Pivot is a data modeling tool that makes it possible to build complex models, perform calculations, and build relationships.
- Power View is a data visualization technology that allows you to present your analysis results in an interactive format.
Stay tuned for more news! Get on the same page with Excel! Let's Excel!
MASNA graduates never cease to amaze us with their talents!
Ekaterina Melianova and Artem Volgin became winners of two international competitions on data analysis at once!
Two very different international analytical competitions, the CDP: Unlocking Climate Solutions Kaggle Competition and The COVID-19 Symptom Data Challenge, in which professors and students in Ph.D. programs from Georgia Tech, Iowa University, Virginia Polytechnic University, University of Washington, MIT, and many others competed. Katya and Artem took 2nd place and received $25,000 in prize money - showing themselves to be the best even in fields with which they are barely familiar.
We heartily congratulate Katya and Artem for their series of remarkable victories! And we are sure that this is just the beginning of their professional future.
Another year of successes and victories is behind us!
We want to summarize the results of the passing year, which for the Master's program "Applied Statistics with Network Analysis" (MASNA) was full of new beginnings and academic achievements.
This year,
- we graduated our third cohort of specialists in applied statistics and network analytics, who are now successfully studying at postgraduate schools in Russia, Oxford, etc.
- our students and graduates have won prizes in various international analytical competitions
- we opened new tracks - Ph.D. track and business analytics
- our students and graduates presented their research at international conferences
- we opened a new master's program, "Master of Data and Network Analytics" (MDNA)
- we started running telegram feeds (https://t.me/HSE_analytic_ru, https://t.me/HSE_analytic_eng ), in which we share the most interesting scientific and business lifehacks.
MASNA wishes everyone a Happy New Year!
This media is not supported in your browser
VIEW IN TELEGRAM
In a world filled with increasingly complex technological, sociological, environmental, political, and economic systems, it becomes challenging to keep in mind the existing relationships between subsystems and their elements. In this case, an interactive simulation tool can be handy.
LOOPY is an excellent free tool for visualizing complex models. With it, you can quickly build a dynamic model just by drawing with your computer mouse. LOOPY will be useful for illustrating explanatory models in seminar classes and independent work on the material, visualization of SEM hypotheses, etc.
Try it yourself!
Last week the Applied Statistics with Network Analysis master's programme launched a new course in machine learning - "Statistical Learning Theory" - taught by Nada Lavrač and Ljupco Todorovski. They are world experts in their field.
Nada Lavrač has a Ph.D. in engineering and is a professor at Nova Gorica University, University of Ljubljana, and the Josef Stefan Institute in Slovenia.
Ljupcho Todorovski is a Ph.D. in Computer Science, a lecturer at the University of Ljubljana, Slovenia.
Machine learning is one of the most popular areas of data analysis today. In the course, students will delve into the theory of the most popular algorithms and methods of machine learning, allowing them to adjust the complexity of the model and choose the optimal one on a particular set of data.
English-taught Master's programs "Applied Statistics with Network Analysis" (MASNA) and “Master of Data and Network Analytics” (MDNA) invite you to their joint open doors day webinar. The event will take place on February 1, 2021, at 19:00 Moscow Time (GMT +3).
The Open Doors Day will be held by Valentina Kuskova, PhD, the academic supervisor of the programs. You will learn what we teach in the program, why data analysis is becoming popular, and in what areas it can be applied. The program's success rate is our alumni; we will tell you about their victories, admission to the world's leading universities, and their work in international companies.
Come and ask questions. We are waiting for you!
Registration link: https://www.hse.ru/en/ma/sna/news/435684852.html
Our graduates in science
The article "Cross-efficiency of International Sanctions: Application of Data Envelopment Analysis and Network Methodology" was written by a team of authors from the International Laboratory for Applied Network Research. Among co-authors – the graduates of the Master’s Programme "Applied Statistics with Network Analysis" – Polina Lushnikova and Gregory Khvatsky.
The skills acquired in the programme allowed the study of sanctions efficiency using two nontrivial methods of data analysis. The article offers a new methodology for assessing international sanctions' effectiveness using Data Envelopment Analysis (DEA), which is used to create a matrix for further network analysis. DEA is a very cool non-parametric method used to compare similar units. The most important advantage of this method is that it can simultaneously process multiple independent and dependent variables, even if they are not i.i.d. distributed and measured in ordinal scale.
Read the article
CTRL+C, CTRL+V, but what else can Word do? A few examples of hotkeys for Windows that will save you time and nerves:
CTRL+SHIFT+V – this key combination allows you to paste the copied text, formatting it to match your document's style.
CTRL+Y – Repeats the previous action on the selected text, making the text bold or highlighting in color.
SHIFT+F3 toggles text between uppercase, lowercase, and capital letters.
CTRL+N Creates a new document, and CTRL+S saves your file right away.
More about keyboard shortcuts here 💻
Online word cloud
There's no need to reinvent the wheel if you already have one on the Internet. So you can create a word cloud online 🚀. This site also lets you choose the text color, background, and shape of the cloud. For a small project or at the initial stage of analysis - this is the best and fastest data visualization option.
There's no need to reinvent the wheel if you already have one on the Internet. So you can create a word cloud online 🚀. This site also lets you choose the text color, background, and shape of the cloud. For a small project or at the initial stage of analysis - this is the best and fastest data visualization option.
Master Class with Loreal Russia CMI Manager Anastasia Rogatyuk
Master's Programme "Applied Statistics with Network Analysis" (MASNA) invites everyone to join the master class on Consumer Market Insights (CMI) together with Anastasia Rogatyuk, Research Manager at Loreal Russia, during the business seminar. During the master class, you will learn what CMI is and in which areas CMI can be applied. Besides, Anastasia will tell you about searching for business insights for effective decision-making.
The practical part of the seminar will help those who want to learn how to identify business problems and solve them by working with data correctly.
Language: English
Date: February 15, 2021
Time: 18:30 Moscow time
Address: Online via Zoom (link will be sent to your email after registration)
Price: 2 000 rubles (HSE stuff members and students can get a discount)
Webinar
"What is wrong with SWOT-Analysis?" MASNA & MDNA
MDNA and MASNA invite you to their joint webinar “What is wrong with SWOT-analysis?”. The event will take place on February 22, 2021, at 19:00 Moscow Time (GMT +3). The webinar will be held by Valentina Kuskova, Ph.D., the academic supervisor of the programmes. Come and ask questions. We are waiting for you!
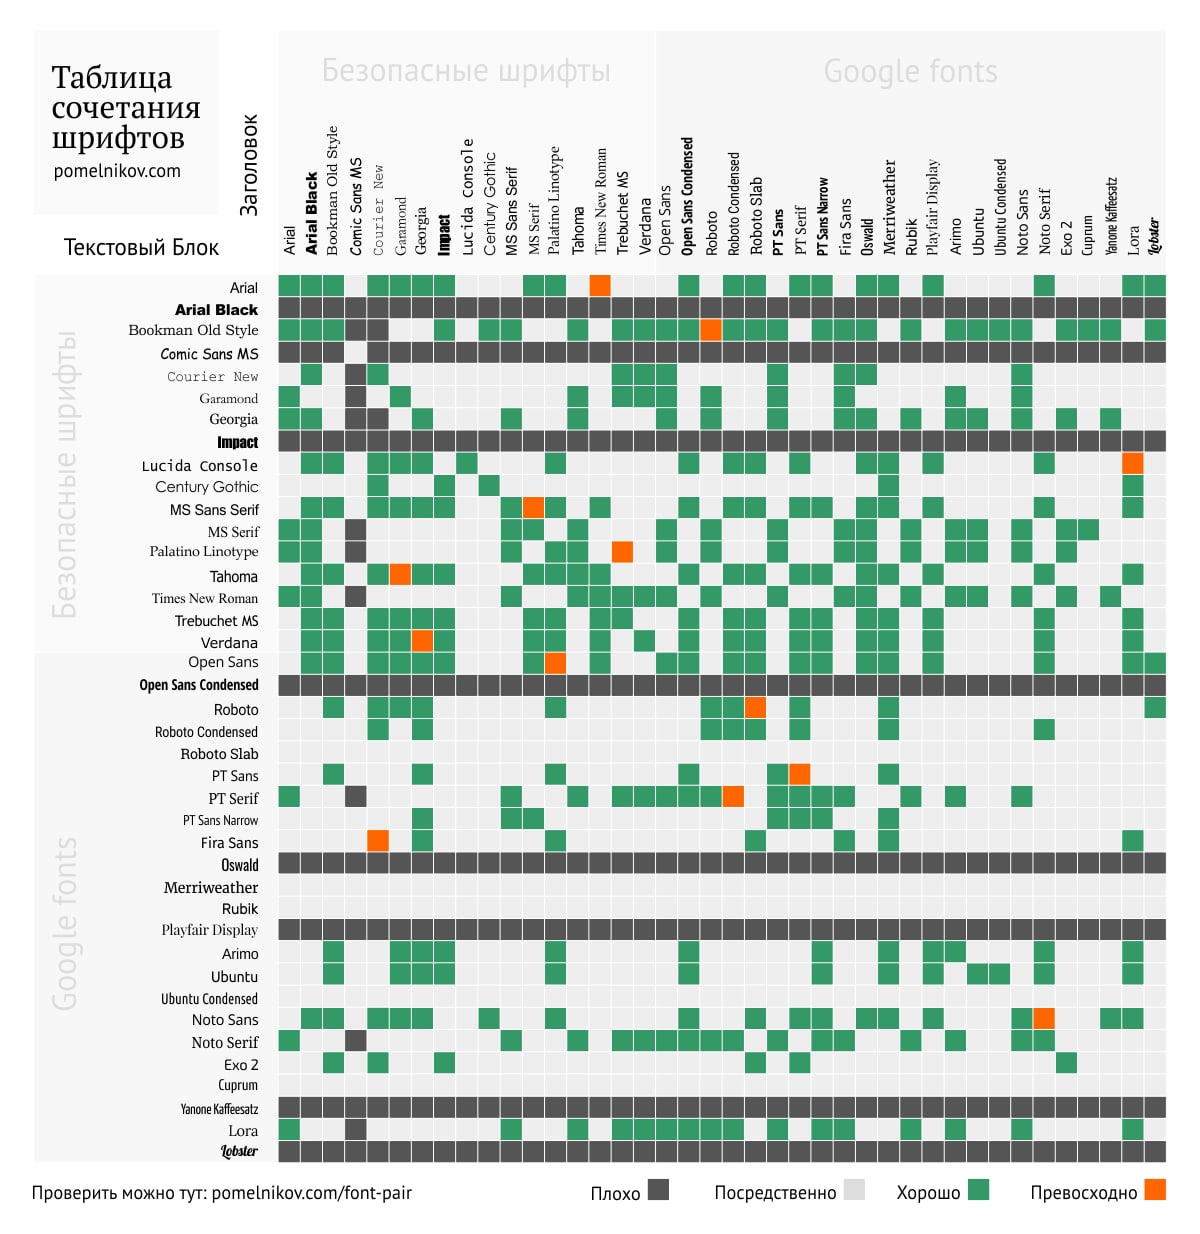
Fonts for Presentation
A few tricks to help make the text on your slides your assistant, and your presentation understandable to your audience.
1. Place only the text you need; brevity is the soul of wit!
2. Part of the text can be replaced by icons.
3. Choose a sans serif font.
4. Don't make it too small (not less than 18-20 sizes)
5. And a super bonus - we're attaching a table with a combination of fonts, which will reduce your time and make your presentation harmonious.