
Our graduates in science
The article "Cross-efficiency of International Sanctions: Application of Data Envelopment Analysis and Network Methodology" was written by a team of authors from the International Laboratory for Applied Network Research. Among co-authors – the graduates of the Master’s Programme "Applied Statistics with Network Analysis" – Polina Lushnikova and Gregory Khvatsky.
The skills acquired in the programme allowed the study of sanctions efficiency using two nontrivial methods of data analysis. The article offers a new methodology for assessing international sanctions' effectiveness using Data Envelopment Analysis (DEA), which is used to create a matrix for further network analysis. DEA is a very cool non-parametric method used to compare similar units. The most important advantage of this method is that it can simultaneously process multiple independent and dependent variables, even if they are not i.i.d. distributed and measured in ordinal scale.
Read the article
CTRL+C, CTRL+V, but what else can Word do? A few examples of hotkeys for Windows that will save you time and nerves:
CTRL+SHIFT+V – this key combination allows you to paste the copied text, formatting it to match your document's style.
CTRL+Y – Repeats the previous action on the selected text, making the text bold or highlighting in color.
SHIFT+F3 toggles text between uppercase, lowercase, and capital letters.
CTRL+N Creates a new document, and CTRL+S saves your file right away.
More about keyboard shortcuts here 💻
Online word cloud
There's no need to reinvent the wheel if you already have one on the Internet. So you can create a word cloud online 🚀. This site also lets you choose the text color, background, and shape of the cloud. For a small project or at the initial stage of analysis - this is the best and fastest data visualization option.
There's no need to reinvent the wheel if you already have one on the Internet. So you can create a word cloud online 🚀. This site also lets you choose the text color, background, and shape of the cloud. For a small project or at the initial stage of analysis - this is the best and fastest data visualization option.
Master Class with Loreal Russia CMI Manager Anastasia Rogatyuk
Master's Programme "Applied Statistics with Network Analysis" (MASNA) invites everyone to join the master class on Consumer Market Insights (CMI) together with Anastasia Rogatyuk, Research Manager at Loreal Russia, during the business seminar. During the master class, you will learn what CMI is and in which areas CMI can be applied. Besides, Anastasia will tell you about searching for business insights for effective decision-making.
The practical part of the seminar will help those who want to learn how to identify business problems and solve them by working with data correctly.
Language: English
Date: February 15, 2021
Time: 18:30 Moscow time
Address: Online via Zoom (link will be sent to your email after registration)
Price: 2 000 rubles (HSE stuff members and students can get a discount)
Webinar
"What is wrong with SWOT-Analysis?" MASNA & MDNA
MDNA and MASNA invite you to their joint webinar “What is wrong with SWOT-analysis?”. The event will take place on February 22, 2021, at 19:00 Moscow Time (GMT +3). The webinar will be held by Valentina Kuskova, Ph.D., the academic supervisor of the programmes. Come and ask questions. We are waiting for you!
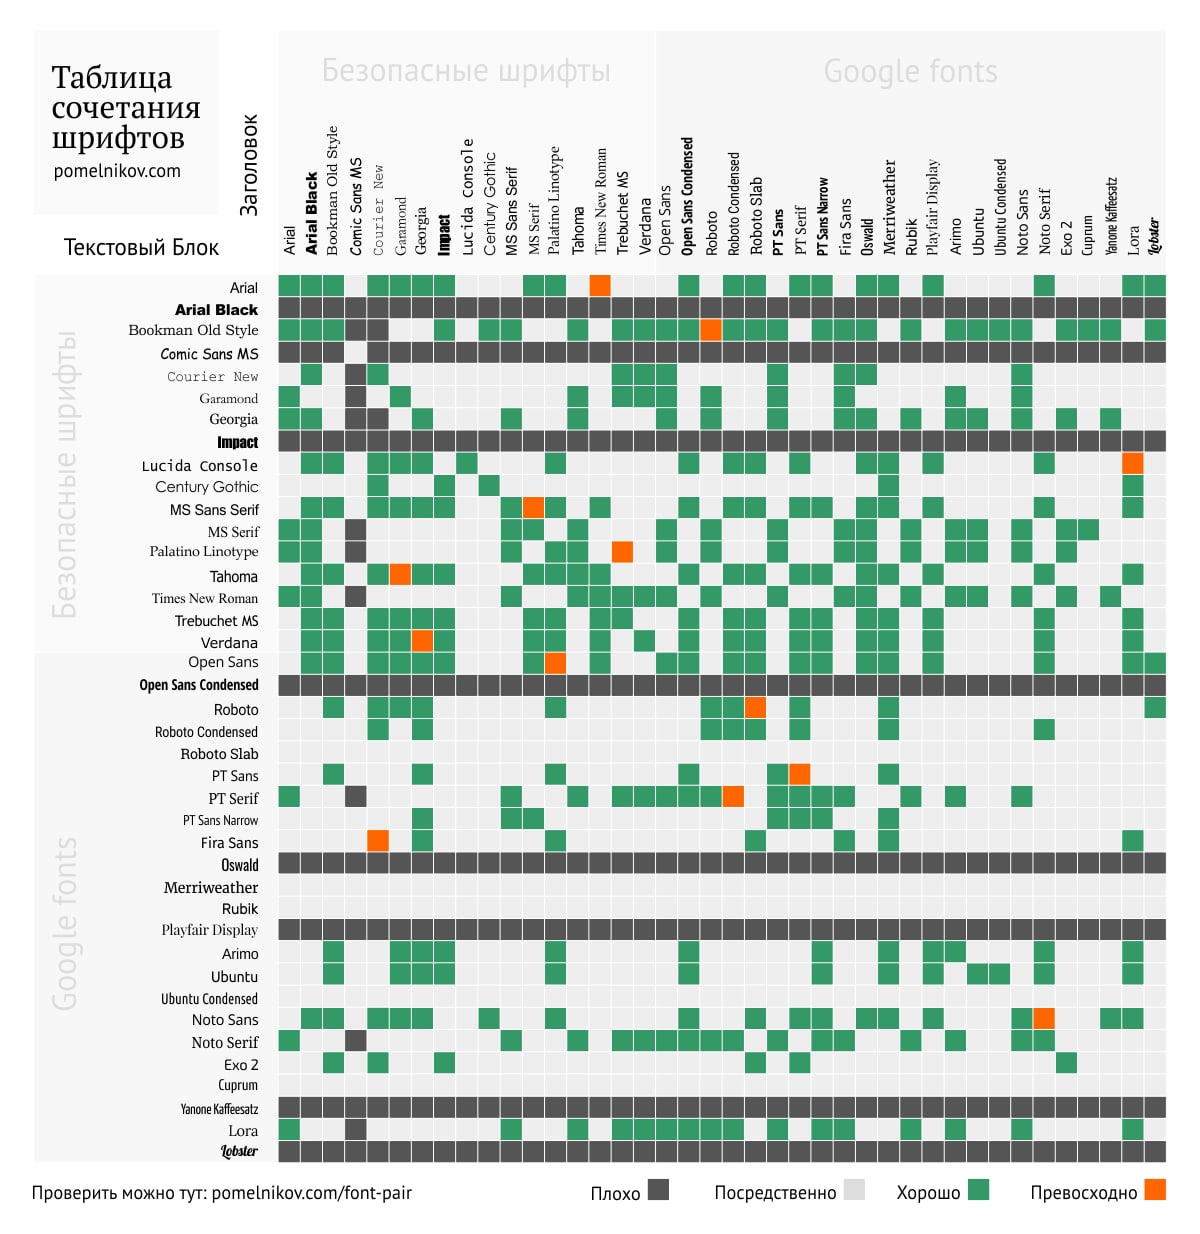
Fonts for Presentation
A few tricks to help make the text on your slides your assistant, and your presentation understandable to your audience.
1. Place only the text you need; brevity is the soul of wit!
2. Part of the text can be replaced by icons.
3. Choose a sans serif font.
4. Don't make it too small (not less than 18-20 sizes)
5. And a super bonus - we're attaching a table with a combination of fonts, which will reduce your time and make your presentation harmonious.
Webinar "A bit of science: what is network analysis?"
Now that online social networks are popular, networks are easy to explain to almost anyone. But not everyone knows that networks can be studied using special tools - network-analytic methods. Moreover, there is a branch of science – network science – that combines theory and methods to explain and predict complex processes in all areas of life, business, and academia. Network science is becoming more and more in demand in business, where only very few people understand the advantages of its methods, yet the results that network science can deliver are in high demand.
Despite high demand of network analysts, there are very few programs in the world that systematically teach network analysis. Filling this void, in the Master of Data and Network Analytics (MDNA) and Applied Statistics with Network Analysis (MASNA) degree programmes at HSE University network analysis plays the central role in the curriculum.
HSE University ranks 1st in Russia in Business & Management Studies and 2nd in Russia in Statistics & Operational Research.
Join us on March 9, 2021, at 19:00 Moscow Time (GMT +3). The online webinar will be held by Valentina Kuskova, PhD, the academic supervisor of the MASNA and MDNA degree programmes. Learn more about the networks and the programmes, and come ready to ask questions - we’ll be happy to answer.
On March 1, 2021, a master class with a guest speaker – Ilya Izmaylov (Business Transformation Director, ZYFRA Group) – will be held within the framework of the Business Seminar of Master Programme "Applied Statistics with Network Analysis" (MASNA).
The main topic of the master class is the consulting style of presentation creation. Ilya will talk about the general principles of presentation creation in consulting.
Come, and you'll learn how to go from idea to visualization.
The main topic of the master class is the consulting style of presentation creation. Ilya will talk about the general principles of presentation creation in consulting.
Come, and you'll learn how to go from idea to visualization.
Word's Secrets. Part 2
You could have a separate telegram channel about hotkeys in Word, but we decided to tell you about the most useful ones.
Ctrl+H will open a window in front of you where you can replace unnecessary characters that appear in your document when you copy. Click on "more," then "special," now you can substitute a non-breaking space with a regular one, a line break with the end of a paragraph, etc. You can copy any character from your document, paste it into the "find" field and replace it with space or the character you want.
Make your texts beautiful✨
The two master's programmes (MDNA and MASNA) are launching the “Data and Network Analytics” minor, available to 2020 students.
The minor will cover the basic concepts and methods of analytics, focusing on network data work and social network modeling and analyzing network unstructured data. The minor's main advantage is the applied nature of the training: no lectures and a focus on practical work.
The minor will cover the basic concepts and methods of analytics, focusing on network data work and social network modeling and analyzing network unstructured data. The minor's main advantage is the applied nature of the training: no lectures and a focus on practical work.
Did you know a handy, simple, and beautiful program for machine learning and data visualization?
And that's the Orange analytics system where you don't have to write code; you insert widgets that can do almost everything from simple visualization to complex models (machine learning and data mining). Orange is suitable for both beginners and advanced users because you can use Orange as a Python programming library.
And Orange has detailed video tutorials to show you how to use it. Install the program and enjoy the visualization!
HSE University Online Open Day - come and learn about us 💥
On March 14, 2021, HSE University Online Open Day will take place, where, among others, Valentina Kuskova, PhD, the academic supervisor of the online “Master of Data and Network Analytics” degree programme will share information about our specializations and study tracks, the online learning format, career paths of our alumni and students, portfolio assessment, admissions interview and much more.
Topic: “Network programs online and offline: Expanding the opportunities”
Date and time: March 14, 2021 12:30-13:10 MSK (GMT +3)
One of the requirements of employers is the ability to make pivot tables.
You can master this skill in less than an hour. You'll need Excel and a data set - select all the data, click on the "insert" tab, then " PivotTable" Now you can move the fields you want into different areas, do different calculations, sort the data, and more.
And don't forget to add a new skill to your resume!
There is an old saying that goes “There are three kinds of lies: lies, damned lies, and statistics.” But what does it actually mean? How does one lie using a tool that’s supposed to be infallible? How to find out when you are being lied to with statistics? In our age of social networks, where fake news can spread across the world like wildfire, these questions are as important as ever before. Answering these questions however, requires both knowledge and experience.
MDNA and MASNA invite you to their joint webinar “Detecting fake news with statistics”.
The event will take place on March 23, at 19:00 Moscow Time (GMT +3). The webinar will be held by Valentina Kuskova, PhD, the academic supervisor of the programs. We are waiting for you!
MDNA and MASNA invite you to their joint webinar “Detecting fake news with statistics”.
The event will take place on March 23, at 19:00 Moscow Time (GMT +3). The webinar will be held by Valentina Kuskova, PhD, the academic supervisor of the programs. We are waiting for you!
What can you do with data analysis?
In today’s world, we are both consuming and generating data all the time. But what can we do with the data we generate? What can we learn from the massive amount of unstructured data available to us? How can we gather, manage and process this kind of data? How can we present our insights to others?
Join us on April 07, 2021, at 19:00 Moscow Time (GMT +3). The webinar will be held by Anna Sokol and Gregory Khvatsky, alumni of the Master of Applied Statistics with Network Analysis degree programme and ANR Lab researchers. Learn more about data analysis and some of its interesting and unusual applications and the Master of Data and Network Analytics degree programme itself, and come ready to ask questions - we’ll be happy to answer.
Colors from the picture 🌈
Creativity begins with inspiration, so today, we decided to share with you services that can help you choose colors for your website/presentation/logo design.
To do this, you need to find any photo you like and load it into Adobe Color, the "Extract Theme" tab. You will see a palette of the photo's main colors; you can either extract the colors yourself or choose from the offered palettes, for example, "muted."
Tip✨: start with photographs of nature, everything beautiful has already been invented for us)
Spurious correlations
What do Nicolas Cage's films have in common with the number of people drowned in swimming pools🧐?
These events cannot be related, BUT the correlation between these events is 66%! This example proves that we must look not only at numbers but also must understand what is the meaning behind them and if there any. Look at other examples and see for yourself.
HSE Master of Data & Network Analytics Webinar: How to win Kaggle competitions
Data science competitions are getting more and more popular, and winning them is a sure-fire way to get noticed by the best employers on the market. However, winning such competitions is no easy feat, especially when you compete against both the world's best universities and companies like Amazon and Google.
Join us on April 21, 2021, at 19:00 Moscow Time (GMT +3). The webinar will be held by Artem Volgin and Ekaterina Melianova, alumni of the Master of Applied Statistics with Network Analysis degree programme. Ekaterina and Artem will tell the story of their road to winning several international competitions on the Kaggle platform, the world’s largest data science community. Learn how studying in our program helped them overtake hundreds of submissions from top universities in the world. We will also be happy to answer your questions about studying in the Masters of Data and Networks Analytics degree program at HSE University.
Word cloud online. Part 2
We have already described how to create a word cloud online using https://wordscloud.pythonanywhere.com. This site allows you to create beautiful pictures, however it’s limited in its use.
The Word Cloud Generator by Jason Davies is an online tool that allows you to load the desired text and adjust various parameters, down to the scale and orientation of the text.
Try and choose what is convenient for you!
What is RMarkdown, or how to make an incredibly excellent report in R
Analytical work isn't just about building models; after all, it's about interpreting and transferring the results into an analytical report. How do you make R become a valuable tool for data analysis and an instant compiler to produce a document that includes the text, the necessary code, and the results?
RMarkdown, which is a kind of add-on in RStudio, allows you to create documents in any format directly in R with the ability to change text formatting to your liking, include third-party images in the text, and use other useful features.
Your data tells a story. Tell it with R Markdown.
John Tukey, a well-known mathematician and statistician, wrote that «The greatest value of a picture is when it forces us to notice what we never expected to see.» A picture is worth a thousand words; that is why it is crucial to develop visual thinking. We are bombarded by so much information daily, printed and online, that we simply don’t have time to read it all. However, a chart or a graph can make life easier, and business reporting is not an exception.
The offline English-taught master’s programme «Applied Statistics with Network Analysis» (MASNA) and its «online mirror» «Master of Data and Network Analytics» (MDNA) on the Coursera platform invite you to their joint open doors day webinar «Visual thinking for developing business reports» with Elena Beylina, the winner of a Russian countrywide infographics competition, “Sociography-2021.” The event will take place on May 19, 2021, at 19:00 Moscow Time (GMT +3).
During the webinar, you will learn the basics of visual communications and be inspired to create your infographics, dashboards, or slide docs. If you’re interested in how our programmes' courses will help you improve your reports, come, ask questions, and enjoy!