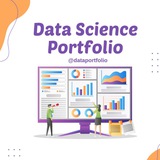
To transition from Data Analyst ➡️ Data Scientist, you will have to focus on building relevant projects! 🎯
✅ Predictive Analytics Project
→ Built a model to predict customer behaviour by analyzing past purchase patterns and used time series forecasting to predict future trends.
✅ Sentiment Analysis using NLP
→ Developed a sentiment analysis model that categorized customer feedback into positive, neutral, and negative sentiments to improve products.
✅ Personalized Recommendation Engine
→ Created a recommendation engine using collaborative and content-based filtering to give personalized suggestions based on user’s browsing history and preferences.
Tailor every project to focus on business impact and user experience, which can help you stand out to recruiters. 💪🏻
👍8❤2
Knowing the tools won't be enough to become a master of data analytics!
See if your soft skills are worthy of the rank of master:
1. 𝗖𝗼𝗺𝗺𝘂𝗻𝗶𝗰𝗮𝘁𝗶𝗼𝗻: Can you translate your findings into easily digestible insights for non-technical stakeholders?
2. 𝗣𝗿𝗼𝗯𝗹𝗲𝗺-𝗦𝗼𝗹𝘃𝗶𝗻𝗴: Is your work focused on solving actual business problems, and are you able to pick the most efficient approach to solve them?
3. 𝗦𝘁𝗮𝗸𝗲𝗵𝗼𝗹𝗱𝗲𝗿 𝗠𝗮𝗻𝗮𝗴𝗲𝗺𝗲𝗻𝘁: Are you building strong relationships with your stakeholders, understanding their needs, and providing them with regular updates?
4. 𝗖𝗼𝗻𝘁𝗶𝗻𝘂𝗼𝘂𝘀 𝗟𝗲𝗮𝗿𝗻𝗶𝗻𝗴: The data landscape is constantly changing. Are you keeping up with new tools and trends?
5. 𝗣𝗿𝗼𝗱𝘂𝗰𝘁/𝗣𝗿𝗼𝗷𝗲𝗰𝘁 𝗠𝗮𝗻𝗮𝗴𝗲𝗺𝗲𝗻𝘁: Are you aware of the life cycle of your data products? Do you have a structured approach to plan, prioritize, and track your work?
6. 𝗕𝘂𝘀𝗶𝗻𝗲𝘀𝘀 𝗔𝗰𝘂𝗺𝗲𝗻: Can you understand the language and needs of the business and put your data work into context?
7. 𝗗𝗼𝗺𝗮𝗶𝗻 𝗞𝗻𝗼𝘄𝗹𝗲𝗱𝗴𝗲: Do you know the processes, products, and challenges of your domain?
If you want to earn the rank of master in the data field, start working on your soft skills now.
👍9❤1
7 Free Datasets to create your next data analytics project 👇👇
https://medium.com/@data_analyst/free-data-sources-to-create-data-analytics-projects-2fd8fd6eadd3
https://medium.com/@data_analyst/free-data-sources-to-create-data-analytics-projects-2fd8fd6eadd3
👍6
13 Best Data Analytics Projects for Final Year Students 👇👇
https://datasimplifier.com/data-analytics-projects-for-final-year-students/
https://datasimplifier.com/data-analytics-projects-for-final-year-students/
👍4
Few ways to optimise SQL Queries 👇👇
Use Indexing: Properly indexing your database tables can significantly speed up query performance by allowing the database to quickly locate the rows needed for a query.
Optimize Joins: Minimize the number of joins and use appropriate join types (e.g., INNER JOIN, LEFT JOIN) to ensure efficient data retrieval.
Avoid SELECT * : Instead of selecting all columns using SELECT *, explicitly specify only the columns needed for the query to reduce unnecessary data transfer and processing overhead.
Use WHERE Clause Wisely: Filter rows early in the query using WHERE clause to reduce the dataset size before joining or aggregating data.
Avoid Subqueries: Whenever possible, rewrite subqueries as JOINs or use Common Table Expressions (CTEs) for better performance.
Limit the Use of DISTINCT: Minimize the use of DISTINCT as it requires sorting and duplicate removal, which can be resource-intensive for large datasets.
Optimize GROUP BY and ORDER BY: Use GROUP BY and ORDER BY clauses judiciously, and ensure that they are using indexed columns whenever possible to avoid unnecessary sorting.
Consider Partitioning: Partition large tables to distribute data across multiple nodes, which can improve query performance by reducing I/O operations.
Monitor Query Performance: Regularly monitor query performance using tools like query execution plans, database profiler, and performance monitoring tools to identify and address bottlenecks.
Hope it helps :)
👍7❤3
Here is the list of few projects (found on kaggle). They cover Basics of Python, Advanced Statistics, Supervised Learning (Regression and Classification problems) & Data SciencePlease also check the discussions and notebook submissions for different approaches and solution after you tried yourself.
1. Basic python and statistics
Pima Indians :- https://www.kaggle.com/uciml/pima-indians-diabetes-database
Cardio Goodness fit :- https://www.kaggle.com/saurav9786/cardiogoodfitness
Automobile :- https://www.kaggle.com/toramky/automobile-dataset
2. Advanced Statistics
Game of Thrones:-https://www.kaggle.com/mylesoneill/game-of-thrones
World University Ranking:-https://www.kaggle.com/mylesoneill/world-university-rankings
IMDB Movie Dataset:- https://www.kaggle.com/carolzhangdc/imdb-5000-movie-dataset
3. Supervised Learning
a) Regression Problems
How much did it rain :- https://www.kaggle.com/c/how-much-did-it-rain-ii/overview
Inventory Demand:- https://www.kaggle.com/c/grupo-bimbo-inventory-demand
Property Inspection predictiion:- https://www.kaggle.com/c/liberty-mutual-group-property-inspection-prediction
Restaurant Revenue prediction:- https://www.kaggle.com/c/restaurant-revenue-prediction/data
IMDB Box office Prediction:-https://www.kaggle.com/c/tmdb-box-office-prediction/overview
b) Classification problems
Employee Access challenge :- https://www.kaggle.com/c/amazon-employee-access-challenge/overview
Titanic :- https://www.kaggle.com/c/titanic
San Francisco crime:- https://www.kaggle.com/c/sf-crime
Customer satisfcation:-https://www.kaggle.com/c/santander-customer-satisfaction
Trip type classification:- https://www.kaggle.com/c/walmart-recruiting-trip-type-classification
Categorize cusine:- https://www.kaggle.com/c/whats-cooking
4. Some helpful Data science projects for beginners
https://www.kaggle.com/c/house-prices-advanced-regression-techniques
https://www.kaggle.com/c/digit-recognizer
https://www.kaggle.com/c/titanic
5. Intermediate Level Data science Projects
Black Friday Data : https://www.kaggle.com/sdolezel/black-friday
Human Activity Recognition Data : https://www.kaggle.com/uciml/human-activity-recognition-with-smartphones
Trip History Data : https://www.kaggle.com/pronto/cycle-share-dataset
Million Song Data : https://www.kaggle.com/c/msdchallenge
Census Income Data : https://www.kaggle.com/c/census-income/data
Movie Lens Data : https://www.kaggle.com/grouplens/movielens-20m-dataset
Twitter Classification Data : https://www.kaggle.com/c/twitter-sentiment-analysis2
ENJOY LEARNING ✅️✅️
#datascienceprojects
👍10❤3
Creating a data science portfolio is a great way to showcase your skills and experience to potential employers. Here are some steps to help you create a strong data science portfolio:
1. Choose relevant projects: Select a few data science projects that demonstrate your skills and interests. These projects can be from your previous work experience, personal projects, or online competitions.
2. Clean and organize your code: Make sure your code is well-documented, organized, and easy to understand. Use comments to explain your thought process and the steps you took in your analysis.
3. Include a variety of projects: Try to include a mix of projects that showcase different aspects of data science, such as data cleaning, exploratory data analysis, machine learning, and data visualization.
4. Create visualizations: Data visualizations can help make your portfolio more engaging and easier to understand. Use tools like Matplotlib, Seaborn, or Tableau to create visually appealing charts and graphs.
5. Write project summaries: For each project, provide a brief summary of the problem you were trying to solve, the dataset you used, the methods you applied, and the results you obtained. Include any insights or recommendations that came out of your analysis.
6. Showcase your technical skills: Highlight the programming languages, libraries, and tools you used in each project. Mention any specific techniques or algorithms you implemented.
7. Link to your code and data: Provide links to your code repositories (e.g., GitHub) and any datasets you used in your projects. This allows potential employers to review your work in more detail.
8. Keep it updated: Regularly update your portfolio with new projects and skills as you gain more experience in data science. This will show that you are actively engaged in the field and continuously improving your skills.
By following these steps, you can create a comprehensive and visually appealing data science portfolio that will impress potential employers and help you stand out in the competitive job market.
#DataPortfolio
👍8❤2
This Telegram channel is a hidden gem for anyone seeking job opportunities in data analytics
👇👇
https://t.me/jobs_SQL
I usually don’t go out of my way to recommend channels, but this one is truly worth it. Whether you're on the hunt for data analyst jobs or need interview tips, this channel has everything you need.
Hope it helps :)
👇👇
https://t.me/jobs_SQL
I usually don’t go out of my way to recommend channels, but this one is truly worth it. Whether you're on the hunt for data analyst jobs or need interview tips, this channel has everything you need.
Hope it helps :)
👍5❤2
Here are 10 project ideas to work on for Data Analytics
1. Customer Churn Prediction: Predict customer churn for subscription-based services. Skills: EDA, classification models. Tools: Python, Scikit-Learn.
2. Retail Sales Forecasting: Forecast sales using historical data. Skills: Time series analysis. Tools: Python, Statsmodels.
3. Sentiment Analysis: Analyze sentiments in product reviews or tweets. Skills: Text processing, NLP. Tools: Python, NLTK.
4. Loan Approval Prediction: Predict loan approvals based on credit risk. Skills: Classification models. Tools: Python, Scikit-Learn.
5. COVID-19 Data Analysis: Explore and visualize COVID-19 trends. Skills: EDA, visualization. Tools: Python, Tableau.
6. Traffic Accident Analysis: Discover patterns in traffic accidents. Skills: Clustering, heatmaps. Tools: Python, Folium.
7. Movie Recommendation System: Build a recommendation system using user ratings. Skills: Collaborative filtering. Tools: Python, Scikit-Learn.
8. E-commerce Analysis: Analyze top-performing products in e-commerce. Skills: EDA, association rules. Tools: Python, Apriori.
9. Stock Market Analysis: Analyze stock trends using historical data. Skills: Moving averages, sentiment analysis. Tools: Python, Matplotlib.
10. Employee Attrition Analysis: Predict employee turnover. Skills: Classification models, HR analytics. Tools: Python, Scikit-Learn.
And this is how you can work on
Here’s a compact list of free resources for working on data analytics projects:
1. Datasets
• Kaggle Datasets: Wide range of datasets and community discussions.
• UCI Machine Learning Repository: Great for educational datasets.
• Data.gov: U.S. government datasets (e.g., traffic, COVID-19).
2. Learning Platforms
• YouTube: Channels like Data School and freeCodeCamp for tutorials.
• 365DataScience: Data Science & AI Related Courses
3. Tools
• Google Colab: Free Jupyter Notebooks for Python coding.
• Tableau Public & Power BI Desktop: Free data visualization tools.
4. Project Resources
• Kaggle Notebooks & GitHub: Code examples and project walk-throughs.
• Data Analytics on Medium: Project guides and tutorials.
ENJOY LEARNING ✅️✅️
#datascienceprojects
👍14❤10🔥1
🚀Here are 5 fresh Project ideas for Data Analysts 👇
🎯 𝗔𝗶𝗿𝗯𝗻𝗯 𝗢𝗽𝗲𝗻 𝗗𝗮𝘁𝗮 🏠
https://www.kaggle.com/datasets/arianazmoudeh/airbnbopendata
💡This dataset describes the listing activity of homestays in New York City
🎯 𝗧𝗼𝗽 𝗦𝗽𝗼𝘁𝗶𝗳𝘆 𝘀𝗼𝗻𝗴𝘀 𝗳𝗿𝗼𝗺 𝟮𝟬𝟭𝟬-𝟮𝟬𝟭𝟵 🎵
https://www.kaggle.com/datasets/leonardopena/top-spotify-songs-from-20102019-by-year
🎯𝗪𝗮𝗹𝗺𝗮𝗿𝘁 𝗦𝘁𝗼𝗿𝗲 𝗦𝗮𝗹𝗲𝘀 𝗙𝗼𝗿𝗲𝗰𝗮𝘀𝘁𝗶𝗻𝗴 📈
https://www.kaggle.com/c/walmart-recruiting-store-sales-forecasting/data
💡Use historical markdown data to predict store sales
🎯 𝗡𝗲𝘁𝗳𝗹𝗶𝘅 𝗠𝗼𝘃𝗶𝗲𝘀 𝗮𝗻𝗱 𝗧𝗩 𝗦𝗵𝗼𝘄𝘀 📺
https://www.kaggle.com/datasets/shivamb/netflix-shows
💡Listings of movies and tv shows on Netflix - Regularly Updated
🎯𝗟𝗶𝗻𝗸𝗲𝗱𝗜𝗻 𝗗𝗮𝘁𝗮 𝗔𝗻𝗮𝗹𝘆𝘀𝘁 𝗷𝗼𝗯𝘀 𝗹𝗶𝘀𝘁𝗶𝗻𝗴𝘀 💼
https://www.kaggle.com/datasets/cedricaubin/linkedin-data-analyst-jobs-listings
💡More than 8400 rows of data analyst jobs from USA, Canada and Africa.
Join for more -> https://t.me/sqlspecialist
ENJOY LEARNING 👍👍
👍5🔥5❤2
Climate Change: Earth Surface Temperature Data.zip
84.7 MB
Climate Change: Earth Surface Temperature Data
Size: 600 MB
In this dataset, there are several files:
Global Land and Ocean-and-Land Temperatures (GlobalTemperatures.csv):
Global Average Land Temperature by Country (GlobalLandTemperaturesByCountry.csv)
Global Average Land Temperature by State (GlobalLandTemperaturesByState.csv)
Global Land Temperatures By Major City (GlobalLandTemperaturesByMajorCity.csv)
Global Land Temperatures By City
👍5❤1
Think Business:
* Sales analysis
* Customer behaviour
* Marketing campaigns
* Product performance
* Market trends
THE SHIFT:
"Look, I analysed movie ratings!" vs "Here's how I increased user retention"
* Sales analysis
* Customer behaviour
* Marketing campaigns
* Product performance
* Market trends
THE SHIFT:
"Look, I analysed movie ratings!" vs "Here's how I increased user retention"
👍12❤3
Technical skills = Common
Business thinking = Rare
Your portfolio should show:
* Industry understanding
* Business metrics
* Real problems solved
* Actionable insights
P.S. Skills matter. But context matters more.
Business thinking = Rare
Your portfolio should show:
* Industry understanding
* Business metrics
* Real problems solved
* Actionable insights
P.S. Skills matter. But context matters more.
🔥7❤3👍3
MUST ADD these 5 POWER Bl projects to your resume to get hired
Here are 5 mini projects that not only help you to gain experience but also it will help you to build your resume stronger
📌Customer Churn Analysis
🔗 https://www.kaggle.com/code/fabiendaniel/customer-segmentation/input
📌Credit Card Fraud
🔗 https://github.com/sahidul-shaikh/credit-card-fraud-
📌Movie Sales Analysis
🔗https://www.kaggle.com/datasets/PromptCloudHQ/imdb-data
📌Airline Sector
🔗https://www.kaggle.com/datasets/yuanyuwendymu/airline-
📌Financial Data Analysis
🔗https://www.kaggle.com/datasets/qks1%7Cver/financial-data-
✅ Free Courses with Certificate:
https://t.me/free4unow_backup
Simple guide
1. Data Utilization:
- Initiate the process by using the provided datasets for a comprehensive analysis.
2. Domain Research:
- Conduct thorough research within the domain to identify crucial metrics and KPIs for analysis.
3. Dashboard Blueprint:
- Outline the structure and aesthetics of your dashboard, drawing inspiration from existing online dashboards for enhanced design and functionality.
4. Data Handling:
- Import data meticulously, ensuring accuracy. Proceed with cleaning, modeling, and the creation of essential measures and calculations.
5. Question Formulation:
- Brainstorm a list of insightful questions your dashboard aims to answer, covering trends, comparisons, aggregations, and correlations within the data.
6. Platform Integration:
- Utilize Novypro.com as the hosting platform for your dashboard, ensuring seamless integration and accessibility.
7. LinkedIn Visibility:
- Share your dashboard on LinkedIn with a concise post providing context. Include a link to your Novypro-hosted dashboard to foster engagement and professional connections.
✅ Best channels on Telegram:
https://t.me/addlist/4q2PYC0pH_VjZDk5
Hope this helps you
👍14
How to become a DIY data analyst:
Avoid formal education such as:
• Tutorials
• Bootcamps
• Certifications
• Expensive degrees
Instead your learnings on:
• SQL
• DAX
• PowerBi
• Building projects
Practical skills > Theorical skills is the DIY way.
Avoid formal education such as:
• Tutorials
• Bootcamps
• Certifications
• Expensive degrees
Instead your learnings on:
• SQL
• DAX
• PowerBi
• Building projects
Practical skills > Theorical skills is the DIY way.
❤13👍6
🚀Here are the projects ideas for Data Analyst aspirants :👇
👉 Finance sector :
➡️Stock Market Analysis
🚀Dataset: Yahoo Finance API or Alpha Vantage API
📌Key analyses:
- Technical indicator calculation
- Risk assessment metrics
- Portfolio optimization
- Trading strategy backtesting
➡️Credit Risk Assessment
🚀Dataset: Lending Club Dataset: https://www.kaggle.com/wordsforthewise/lending-club
📌Analysis focus:
- Default prediction models
- Interest rate analysis
- Risk factor identification
- Loan approval optimization
👉 Technology sector:
➡️App Usage Analytics
🚀Dataset: Google Play Store Apps: https://www.kaggle.com/lava18/google-play-store-apps
📌Key analyses:
- User engagement metrics
- App category analysis
- Rating prediction
- Competitor analysis
➡️Website Traffic Analysis
🚀Dataset: Sample web analytics data from Google Analytics Demo Account
📌Analysis focus:
- Traffic pattern analysis
- Conversion funnel optimization
- User behavior analysis
- A/B testing results
👉 Showcase your Data Analytics skills with these projects and include in your Portfolio.
👍6❤5
📊 Data Analytics Project ideas For portfolio :
🚀 Healthcare Analytics
👉 Patient Readmission Analysis
🔗Dataset: MIMIC-III Demo Dataset (https://physionet.org/content/mimiciii-demo/1.4/)
📌Key analyses:
-Predict patient readmission risk using logistic regression
-Analyze length of stay patterns
-Create interactive dashboards showing key health metrics
👉 Healthcare Cost Analysis
🔗Dataset: Healthcare Cost and Utilization Project (HCUP) datasets: https://www.ahrq.gov/data/resources/index.html?page=0
📌Analysis focus:
-Compare procedure costs across different regions
-Analyze insurance claim patterns
-Create cost forecasting models
-Build visualizations of cost trends
🚀 Retail/E-commerce
👉 Customer Segmentation and Purchase Behavior
🔗 Dataset: Online Retail Dataset (UCI ML Repository): https://archive.ics.uci.edu/ml/datasets/Online+Retail
📌Key analyses:
-Customer lifetime value calculation
-Market basket analysis
-Seasonal sales patterns
👉 Inventory Optimization
🔗 Dataset: Walmart Store Sales Dataset (Kaggle): https://www.kaggle.com/c/walmart-recruiting-store-sales-forecasting
📌Analysis focus:
-Sales forecasting
-Stock level optimization
-Store performance comparison
#dataportfolio #projects
❤6
Having a strong portfolio is one of the best ways to stand out when applying for a Data Analyst role. But it’s important to choose the right projects that show your skills and creativity. Here’s how you can create meaningful projects:-
Don’t work on the same old ideas like simple sales dashboards or stock price analysis. These projects are very common and don’t make you stand out. Instead, try to pick unique and interesting topics that recruiters haven’t seen before.
Think about real problems faced by companies. For example, mobility companies like Uber, Ola, or Rapido face issues where some drivers ask customers to cancel rides so they can complete trips offline. This leads to revenue loss for the company. You can take this as example to create a project to analyze this problem, quantify the losses, and suggest solutions.
Use multiple tools in a single project to show your versatility. For example, you can use SQL to clean and organize data, Python to analyze it, and Power BI to create dashboards. This shows you can handle an entire process from start to finish.
Focus on projects that solve real business problems like reducing customer churn, optimizing marketing budgets, or segmenting customers into different groups. These projects show that you understand how businesses operate and how data can make an impact.
Explain how you thought through the problem when you present your project. For example, if you analyzed driver cancellations, explain how you broke the problem into smaller parts, analyzed the data, and came up with solutions. This helps others see your problem-solving approach.
Combine multiple related problems into one project to make it more impactful. For example, you could analyze driver cancellations, identify peak times for offline completions, and create a dashboard to monitor revenue loss. Combining ideas makes your project more comprehensive and impressive.
Try to find data sets that aren’t commonly used. Instead of downloading the same datasets everyone uses, explore platforms like Kaggle or open data portals, or even create your own data. This will make your projects look fresh and unique.
Always share clear and actionable results in your projects. For example, if you worked on driver cancellations, suggest ways to reduce them, like adjusting incentives or monitoring systems. Finish your project with a clear and engaging dashboard to show your findings.
By working on unique and meaningful projects, you can show your skills, creativity, and ability to solve real problems.
#dataportfolio
👍19❤7