Crypto Charters TA
https://twitter.com/opchecksig/status/945961333069172736
Sequence of events for the bear scenario matching almost perfectly what I had drawn.
14k may still hold…
https://twitter.com/opchecksig/status/946214311462146049
14k may still hold…
https://twitter.com/opchecksig/status/946214311462146049
Twitter
CHECKSIG (Zavan ₿)
Looks like the bear scenario was correct. Predicted in red, actual in orange. Sequence of events: Break of the blue line -> Test of yellow fib -> Retest of the green fib/blue trendline from bellow -> Break of the yellow fib -> Test of the red…
Crypto Charters TA
https://twitter.com/opchecksig/status/946564763215192064
Volume getting better, looks like a real breakout, going in, tight stop. First target/resistance: 15.5k
Crypto Charters TA
Looks like that bear div from the previous post was real. https://twitter.com/opchecksig/status/946132986281517057
Still watching this closely, gotta break 15.8k to invalidate.
Crypto Charters TA
https://twitter.com/opchecksig/status/943395821550276609 Not valid until a close bellow 16K. High res: https://imgur.com/zPWhP75
You can see what the orange line is on this post, from 10 days ago.
Capture d'écran 2017-12-31 16.20.11.png
48 KB
in fact the triangling is intact
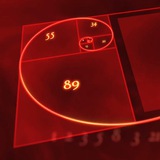
BTCUSD Daily-Fib circle intersection support @11600 (yellow), 9300-9500 running to 8150 (green), and 8750 running to 5k (blue). Can RSI resolve before any dotted lines? NB: White curved support lines