
Crypto2AF™ Signals pinned «Our Top Signals Recap: Daily: 🥇 #FOR 9.62% Weekly: 🥇 #SNX 12.98% 🥈 #FOR 9.62% 🥉 #EOS 9.16% #KMD 6.74% | #DIA 3.43% #AVA 2.96% | #WTC 2.62% #ONT 2.56% | #ENS 2.47% | #FRONT 2.02%»
📚 New Technical analysis for [ Trader Joe ]
🎯 #JOE/BTC
🔸 A Resistance Breakout and Confirmation has been detected on the $JOE / $BTC chart. The price has broken above a key resistance level and has been confirmed by a strong candle, indicating a potential bullish trend. The next resistance key levels are located at 0.00001218 | 0.00001348 | 0.00001556, and the major support zones can be found at 0.0000101 | 0.00000932 | 0.00000724. Consider entering a trade at the current price zone of 0.00001113 and targeting higher levels.
📊 Technical Metrics Index Summary:
🎯 #JOE/BTC
┊ Rank: 294
🪄 JOE Chart ➖ Tradingview Idea🔸 A Resistance Breakout and Confirmation has been detected on the $JOE / $BTC chart. The price has broken above a key resistance level and has been confirmed by a strong candle, indicating a potential bullish trend. The next resistance key levels are located at 0.00001218 | 0.00001348 | 0.00001556, and the major support zones can be found at 0.0000101 | 0.00000932 | 0.00000724. Consider entering a trade at the current price zone of 0.00001113 and targeting higher levels.
📊 Technical Metrics Index Summary:
├Mrkt Price ⌁ 0.00001113 ₿
├P.Change: 24h[🔺0.18%]

└ 1-W[-3.55%] 30D[11.40%]
└ 90D[32.30%]
├24hVol: 1.533 ₿
├Osciltrs: NEUTRAL
├MAs: STRONG_BUY
┊
🚥 Market Sentiment Index:├News: N/A
├Twitter: N/A
├Reddit: N/A
┊
┊ 🪄 Unlock Trading Signal below.└ 🎯 Follow Idea for updates.
📚 New Technical analysis for [ EOS ]
🎯 #EOS/BTC
🪄 EOS Chart ➖ Tradingview Idea
🔸 A Resistance Breakout has been identified on the $EOS / $BTC chart. The price has broken above a key resistance level, indicating a potential bullish trend. The next resistance key levels are located at 0.0000509 | 0.0000541 | 0.0000592, and the major support zones can be found at 0.0000458 | 0.0000439 | 0.0000388. Consider entering at the current price zone of 0.0000564 and targeting higher levels.
📊 Technical Metrics Index Summary:
🚥 Market Sentiment Index:
🎯 #EOS/BTC
┊ Rank: 41🪄 EOS Chart ➖ Tradingview Idea
🔸 A Resistance Breakout has been identified on the $EOS / $BTC chart. The price has broken above a key resistance level, indicating a potential bullish trend. The next resistance key levels are located at 0.0000509 | 0.0000541 | 0.0000592, and the major support zones can be found at 0.0000458 | 0.0000439 | 0.0000388. Consider entering at the current price zone of 0.0000564 and targeting higher levels.
📊 Technical Metrics Index Summary:
├Mrkt Price ⌁ 0.0000564 ₿├P.Change: 24h[🚀7.84%]
└ 1-W[12.41%] 30D[16.69%]└ 90D[36.42%]├24hVol: 156.723 ₿├Osciltrs: NEUTRAL├MAs: STRONG_BUY┊🚥 Market Sentiment Index:
├News: 0.65 - Bullish├Twitter: 0.67 - Bullish├Reddit: 0.69 - Bullish┊┊ 🪄 Unlock Trading Signal below.└ 🎯 Follow Idea for updates.
📚 New Technical analysis for [ Coti ]
🎯 #COTI/BTC
🔸 A Resistance Breakout has been identified on the $COTI / $BTC chart. The price has broken above a key resistance level, indicating a potential bullish trend. The next resistance key levels are located at 0.00000415 | 0.00000449 | 0.00000507, and the major support zones can be found at 0.00000357 | 0.00000333 | 0.00000275. Consider entering at the current price zone of 0.0000037 and targeting higher levels.
📊 Technical Metrics Index Summary:
🎯 #COTI/BTC
┊ Rank: 265
🪄 COTI Chart ➖ Tradingview Idea🔸 A Resistance Breakout has been identified on the $COTI / $BTC chart. The price has broken above a key resistance level, indicating a potential bullish trend. The next resistance key levels are located at 0.00000415 | 0.00000449 | 0.00000507, and the major support zones can be found at 0.00000357 | 0.00000333 | 0.00000275. Consider entering at the current price zone of 0.0000037 and targeting higher levels.
📊 Technical Metrics Index Summary:
├Mrkt Price ⌁ 0.0000037 ₿
├P.Change: 24h[🔺1.09%]
└ 1-W[-4.75%] 30D[-18.31%]
└ 90D[14.20%]
├24hVol: 4.836 ₿
├Osciltrs: NEUTRAL
├MAs: BUY
┊
🚥 Market Sentiment Index:├News: N/A
├Twitter: 0.82 - Very Bullish
├Reddit: N/A
┊
┊ 🪄 Unlock Trading Signal below.└ 🎯 Follow Idea for updates.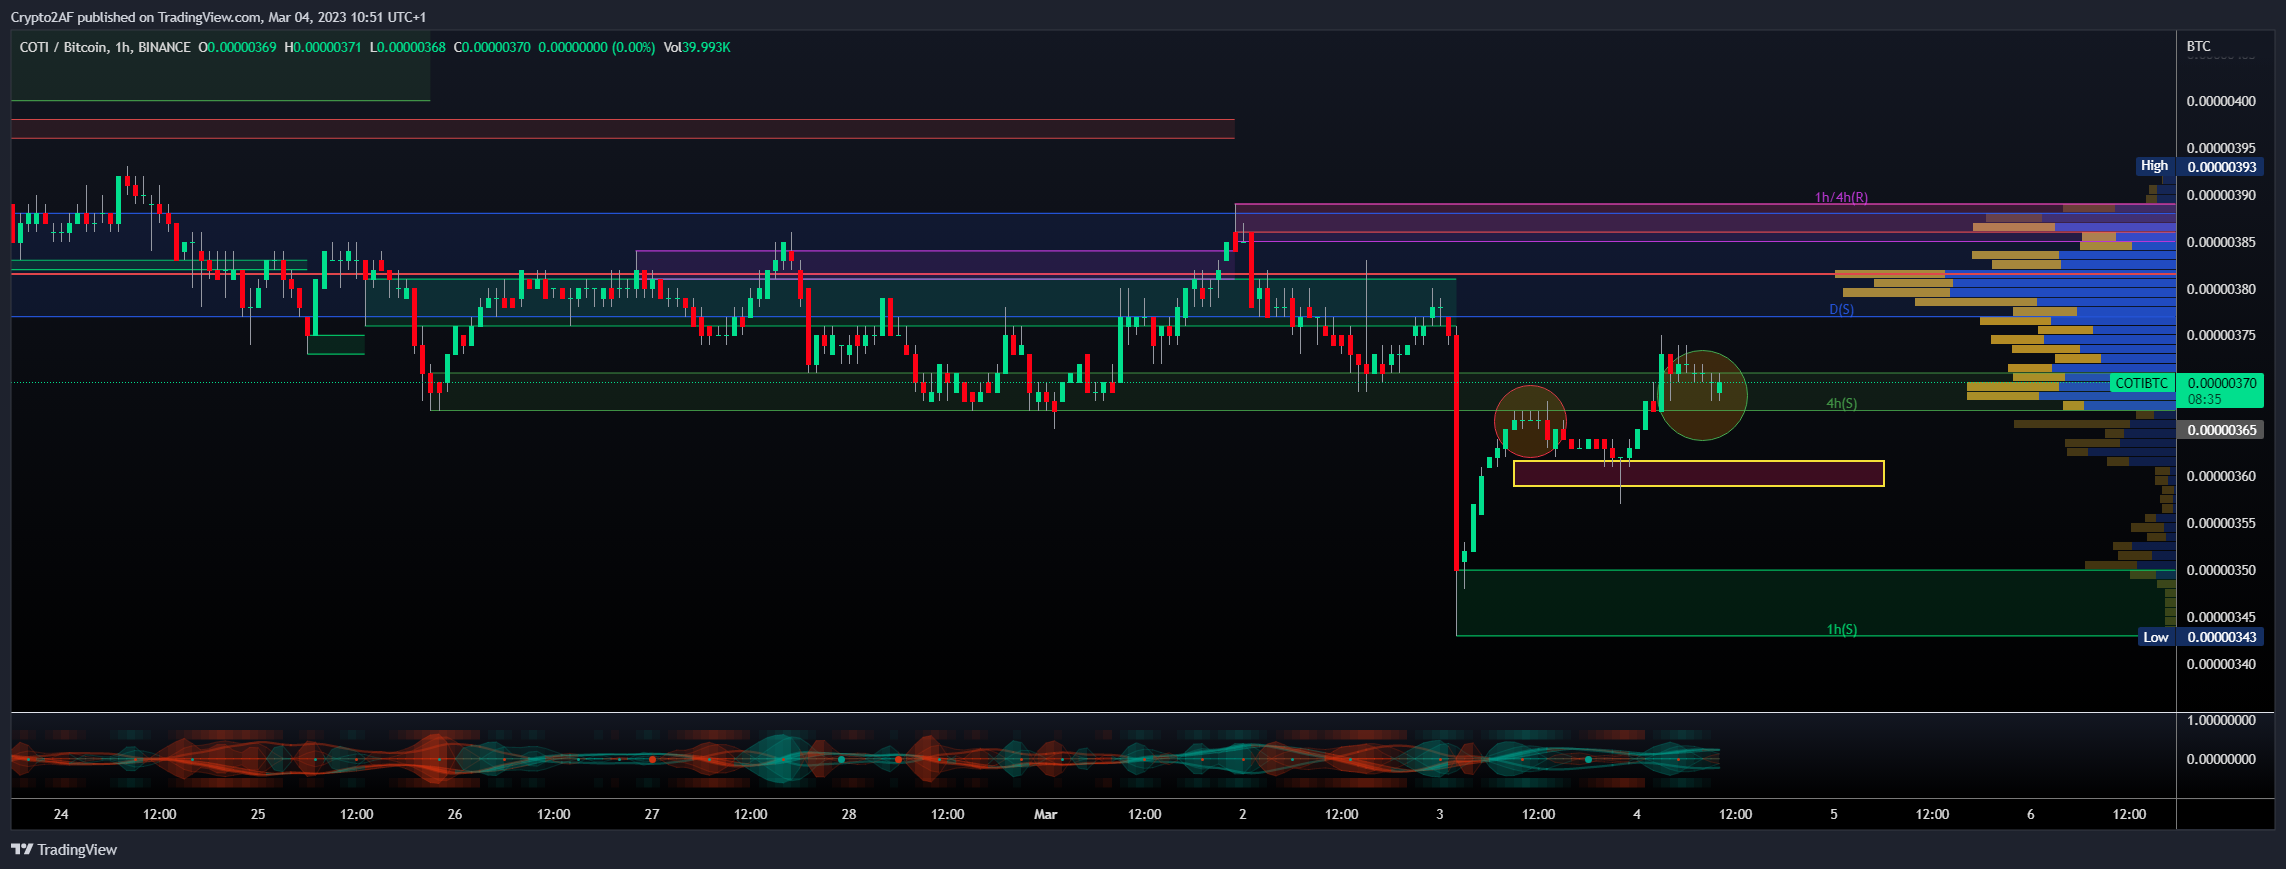
Crypto2AF™ Signals pinned «Our Top Signals Recap: Daily: 🥇 #EOS 6.38% Weekly: 🥇 #SNX 12.98% 🥈 #FOR 9.62% 🥉 #EOS 9.16% #KMD 6.74% | #DIA 3.43% #WTC 2.62% | #ONT 2.56% #ENS 2.47% | #ICX 1.83% #BADGER 1.42%»
https://telegra.ph/Fundamental-and-TA-updates-03-05
Please open Telegram to view this post
VIEW IN TELEGRAM
Telegraph
Fundamental and TA updates
🚥 Market Sentiment Index: Data sentiments analysis on crypto-related Reddit, news, and Twitter
📚 New Technical analysis for [ Monero ]
🎯 #XMR/BTC
🔸 A Resistance Breakout has been identified on the $XMR / $BTC chart. The price has broken above a key resistance level, indicating a potential bullish trend. The next resistance key levels are located at 0.006806 | 0.007185 | 0.007824, and the major support zones can be found at 0.006167 | 0.005907 | 0.005268. Consider entering at the current price zone of 0.006648 and targeting higher levels.
📊 Technical Metrics Index Summary:
🎯 #XMR/BTC
┊ Rank: 28
🪄 XMR Chart ➖ Tradingview Idea🔸 A Resistance Breakout has been identified on the $XMR / $BTC chart. The price has broken above a key resistance level, indicating a potential bullish trend. The next resistance key levels are located at 0.006806 | 0.007185 | 0.007824, and the major support zones can be found at 0.006167 | 0.005907 | 0.005268. Consider entering at the current price zone of 0.006648 and targeting higher levels.
📊 Technical Metrics Index Summary:
├Mrkt Price ⌁ 0.006648 ₿
├├ P.Change: 24h[🔺1.22%]
├├ 1-W[-1.81%] 30D[-13.50%]
├├ 90D[2.42%]
├24hVol: 121.750 ₿
├Osciltrs: BUY
├MAs: STRONG_BUY
┊
🚥 Market Sentiment Index:├News: N/A
├Twitter: 0.56 - Bullish
├Reddit: 0.77 - Very Bullish
┊Binance┊Kucoin┊Huobipro┊
┊┊🪄Unlock Trading Signal below.
┊┊🎯Follow Idea to get updates.
Have a rest!
Please open Telegram to view this post
VIEW IN TELEGRAM
👍1
📚 New Technical analysis for [ Alpaca City ]
🎯 #ALPACA/BTC
🔸 Hey traders, we've identified bullish signals on the $ALPACA / $BTC chart through the detection of both a Bollinger Band breakout and a Resistance Breakout. The Bollinger Band indicates a potential bullish trend as the price has moved outside of the upper band, while the Resistance Breakout confirms this trend by showing the price breaking above a key resistance level. Given the alignment of these signals, it may be a good idea to consider entering a long position and targeting higher levels. Our analysis indicates that the key resistance levels are at 0.00001394 | 0.00001491 | 0.00001643 and the major support zones are at 0.00001242 | 0.00001187 | 0.00001035. However, it is important to also consider other factors such as overall market conditions and other technical indicators before making a trade decision.
📊 Technical Metrics Index Summary:
🎯 #ALPACA/BTC
┊ Rank: 1408
🪄 ALPACA Chart ➖ Tradingview Idea🔸 Hey traders, we've identified bullish signals on the $ALPACA / $BTC chart through the detection of both a Bollinger Band breakout and a Resistance Breakout. The Bollinger Band indicates a potential bullish trend as the price has moved outside of the upper band, while the Resistance Breakout confirms this trend by showing the price breaking above a key resistance level. Given the alignment of these signals, it may be a good idea to consider entering a long position and targeting higher levels. Our analysis indicates that the key resistance levels are at 0.00001394 | 0.00001491 | 0.00001643 and the major support zones are at 0.00001242 | 0.00001187 | 0.00001035. However, it is important to also consider other factors such as overall market conditions and other technical indicators before making a trade decision.
📊 Technical Metrics Index Summary:
├Mrkt Price ⌁ 0.00001539 ₿
├├ P.Change: 24h[🚀16.41%]
├├ 1-W[N/A] 30D[-16.00%]
├├ 90D[-5.42%]
├24hVol: 47.071 ₿
├Osciltrs: BUY
├MAs: STRONG_BUY
┊
🚥 Market Sentiment Index:├News: N/A
├Twitter: 0.44 - Bearish
├Reddit: 0.18 - Very Bearish
┊Binance┊Kucoin┊
┊┊🪄Unlock Trading Signal below.
┊┊🎯Follow Idea to get updates.
📚 New Technical analysis for [ Wrapped Nexus Mutual ]
🎯 #WNXM/USDT
🔸 A Resistance Breakout has been identified on the $WNXM / $USDT chart. The price has broken above a key resistance level, indicating a potential bullish trend. The next resistance key levels are located at 23.18 | 25.2 | 28.37, and the major support zones can be found at 20.01 | 18.86 | 15.69. Consider entering at the current price zone of 19.17 and targeting higher levels.
📊 Technical Metrics Index Summary:
🎯 #WNXM/USDT
┊ Rank: 330
🪄 WNXM Chart ➖ Tradingview Idea🔸 A Resistance Breakout has been identified on the $WNXM / $USDT chart. The price has broken above a key resistance level, indicating a potential bullish trend. The next resistance key levels are located at 23.18 | 25.2 | 28.37, and the major support zones can be found at 20.01 | 18.86 | 15.69. Consider entering at the current price zone of 19.17 and targeting higher levels.
📊 Technical Metrics Index Summary:
├Mrkt Price ⌁ 19.17 ₮
├├ P.Change: 24h[🔻-2.19%]
├├ 1-W[-11.10%] 30D[7.66%]
├├ 90D[71.06%]
├24hVol: 774,476.703 ₮
├Osciltrs: NEUTRAL
├MAs: BUY
┊
🚥 Market Sentiment Index:├News: N/A
├Twitter: 0.31 - Bearish
├Reddit: 0.66 - Bullish
┊Binance┊Kucoin┊Bybit┊Gateio┊
┊┊🪄Unlock Trading Signal below.┊┊🎯Follow Idea to get updates.
👍1
📚 New Technical analysis for [ Tezos ]
🎯 #XTZ/BTC
🔸 A Resistance Breakout has been identified on the $XTZ / $BTC chart. The price has broken above a key resistance level, indicating a potential bullish trend. The next resistance key levels are located at 0.00005174 | 0.00005375 | 0.0000578, and the major support zones can be found at 0.00004769 | 0.00004565 | 0.0000416. Consider entering at the current price zone of 0.00004957 and targeting higher levels.
📊 Technical Metrics Index Summary:
🎯 #XTZ/BTC
┊ Rank: 49
🪄 XTZ Chart ➖ Tradingview Idea🔸 A Resistance Breakout has been identified on the $XTZ / $BTC chart. The price has broken above a key resistance level, indicating a potential bullish trend. The next resistance key levels are located at 0.00005174 | 0.00005375 | 0.0000578, and the major support zones can be found at 0.00004769 | 0.00004565 | 0.0000416. Consider entering at the current price zone of 0.00004957 and targeting higher levels.
📊 Technical Metrics Index Summary:
├Mrkt Price ⌁ 0.00004957 ₿
├├ P.Change: 24h[🔺1.70%]
├├ 1-W[-12.17%] 30D[-17.96%]
├├ 90D[0.74%]
├24hVol: 95.164 ₿
├Osciltrs: SELL
├MAs: NEUTRAL
┊
🚥 Market Sentiment Index:├News: N/A
├Twitter: 0.55 - Bullish
├Reddit: 0.82 - V. Bullish
┊Binance┊Kucoin┊Poloniex┊Gateio┊
┊┊🪄Unlock Trading Signal below.┊┊🎯Follow Idea to get updates.
📚 New Technical analysis for [ XRP ]
🎯 #XRP/BTC
🪄 XRP Chart ➖ Tradingview Idea
🔸 A Bollinger Band breakout has been identified on the $XRP / $BTC chart. The price has moved outside of the upper Bollinger Band, indicating a potential bullish trend. The next resistance key levels are located at 0.00001697 | 0.00001759 | 0.00001877, and the major support zones can be found at 0.00001579 | 0.00001523 | 0.00001405. Consider buying at the current price zone of 0.00001835 and targeting higher levels.BBand_Squeeze
📊 Technical Metrics Index Summary:
🚥 Market Sentiment Index:
🎯 #XRP/BTC
┊ Rank: 6🪄 XRP Chart ➖ Tradingview Idea
🔸 A Bollinger Band breakout has been identified on the $XRP / $BTC chart. The price has moved outside of the upper Bollinger Band, indicating a potential bullish trend. The next resistance key levels are located at 0.00001697 | 0.00001759 | 0.00001877, and the major support zones can be found at 0.00001579 | 0.00001523 | 0.00001405. Consider buying at the current price zone of 0.00001835 and targeting higher levels.BBand_Squeeze
📊 Technical Metrics Index Summary:
├Mrkt Price ⌁ 0.00001835 ₿├├ P.Change: 24h[🔺1.89%]├├ 1-W[-2.26%] 30D[-7.25%]├├ 90D[-4.60%]├24hVol: 1,065.829 ₿├Osciltrs: NEUTRAL├MAs: BUY┊🚥 Market Sentiment Index:
├News: 0.32 - Bearish├Twitter: 0.58 - Bullish├Reddit: 0.52 - Bullish┊Binance┊Kucoin┊Gateio┊Poloniex┊┊┊🪄Unlock Trading Signal below.┊┊🎯Follow Idea to get updates.
📚 New Technical analysis for [ CertiK ]
🎯 #CTK/BTC
🪄 CTK Chart ➖ Tradingview Idea
🔸 Hey traders, we've identified bullish signals on the $CTK / $BTC chart through the detection of both a Bollinger Band breakout and a Resistance Breakout. The Bollinger Band indicates a potential bullish trend as the price has moved outside of the upper band, while the Resistance Breakout confirms this trend by showing the price breaking above a key resistance level. Given the alignment of these signals, it may be a good idea to consider entering a long position and targeting higher levels. Our analysis indicates that the key resistance levels are at 0.000035 | 0.00003685 | 0.00003965 and the major support zones are at 0.0000322 | 0.00003125 | 0.00002845. However, it is important to also consider other factors such as overall market conditions and other technical indicators before making a trade decision.
📊 Technical Metrics Index Summary:
🚥 Market Sentiment Index:
🎯 #CTK/BTC
┊ Rank: None🪄 CTK Chart ➖ Tradingview Idea
🔸 Hey traders, we've identified bullish signals on the $CTK / $BTC chart through the detection of both a Bollinger Band breakout and a Resistance Breakout. The Bollinger Band indicates a potential bullish trend as the price has moved outside of the upper band, while the Resistance Breakout confirms this trend by showing the price breaking above a key resistance level. Given the alignment of these signals, it may be a good idea to consider entering a long position and targeting higher levels. Our analysis indicates that the key resistance levels are at 0.000035 | 0.00003685 | 0.00003965 and the major support zones are at 0.0000322 | 0.00003125 | 0.00002845. However, it is important to also consider other factors such as overall market conditions and other technical indicators before making a trade decision.
📊 Technical Metrics Index Summary:
├Mrkt Price ⌁ 0.00003675 ₿├├ P.Change: 24h[🚀6.46%]├├ 1-W[N/A] 30D[N/A]├├ 90D[N/A]├24hVol: 15.380 ₿├Osciltrs: BUY├MAs: STRONG_BUY┊🚥 Market Sentiment Index:
├News: N/A├Twitter: 0.87 - V. Bullish├Reddit: 0.60 - Bullish┊Binance┊┊┊🪄Unlock Trading Signal below.┊┊🎯Follow Idea to get updates.
🚨 FLASH - Les stablecoins sont en pleine tourmente alors que la faillite de la Silicon Valley Bank commence à produire des effets domino 📉
$USDC, dont 25% des réserves en cash sont détenues chez SVB, a depeg à $0,9.
$DAI, $FRAX, $USDD et $USDP ont suivi le mouvement.
$USDC, dont 25% des réserves en cash sont détenues chez SVB, a depeg à $0,9.
$DAI, $FRAX, $USDD et $USDP ont suivi le mouvement.