
📚 New Technical analysis for [ ICON ]
🎯 #ICX/BTC
🪄 ICX Chart ➖ Tradingview Idea
🔸 Hey crypto lovers, we've identified bullish signals on the $ICX / $BTC chart through the detection of both a Bollinger Band and a Resistance Breakout. The Bollinger Band indicates a potential bullish trend as the price has moved outside of the upper band, while the Resistance Breakout confirms this trend by showing the price breaking above a key resistance level. Given the alignment of these signals, it may be a good idea to consider entering a long position and targeting higher levels. Our analysis indicates that the key resistance levels are at 0.00001149 | 0.00001226 | 0.00001381 and the major support zones are at 0.00000994 | 0.00000916 | 0.00000761. However, it is important to also consider other factors such as overall market conditions and other technical indicators before making a trade decision.
📊 Technical Metrics Index Summary:
🚥 Market Sentiment Index:
🪄 Unlock Trading Signal below.
🎯 Follow Idea for updates.
🎯 #ICX/BTC
┊ Rank: 161🪄 ICX Chart ➖ Tradingview Idea
🔸 Hey crypto lovers, we've identified bullish signals on the $ICX / $BTC chart through the detection of both a Bollinger Band and a Resistance Breakout. The Bollinger Band indicates a potential bullish trend as the price has moved outside of the upper band, while the Resistance Breakout confirms this trend by showing the price breaking above a key resistance level. Given the alignment of these signals, it may be a good idea to consider entering a long position and targeting higher levels. Our analysis indicates that the key resistance levels are at 0.00001149 | 0.00001226 | 0.00001381 and the major support zones are at 0.00000994 | 0.00000916 | 0.00000761. However, it is important to also consider other factors such as overall market conditions and other technical indicators before making a trade decision.
📊 Technical Metrics Index Summary:
├Mrkt Price ⌁ 0.00001094 ₿├Change: 24h[🔺2.34%] 1W[-3.65%]┊ └ 1-M[17.77%] 3-M[52.18%]├24hVol: 7.451 ₿├Osciltrs: NEUTRAL├MAs: STRONG_BUY┊🚥 Market Sentiment Index:
├News: N/A├Twitter: 0.54 - Bullish├Reddit: 0.55 - Bullish┊🪄 Unlock Trading Signal below.
🎯 Follow Idea for updates.
📚 New Technical analysis for [ EOS ]
🎯 #EOS/BTC
🪄 EOS Chart ➖ Tradingview Idea
🔸 A Resistance Breakout and Confirmation has been detected on the $EOS / $BTC chart. The price has broken above a key resistance level and has been confirmed by a strong candle, indicating a potential bullish trend. The next resistance key levels are located at 0.0000509 | 0.0000541 | 0.0000592, and the major support zones can be found at 0.0000458 | 0.0000439 | 0.0000388. Consider entering a trade at the current price zone of 0.0000496 and targeting higher levels.
📊 Technical Metrics Index Summary:
🚥 Market Sentiment Index:
🪄 Unlock Trading Signal below.
🎯 Follow Idea for updates.
🎯 #EOS/BTC
┊ Rank: 44🪄 EOS Chart ➖ Tradingview Idea
🔸 A Resistance Breakout and Confirmation has been detected on the $EOS / $BTC chart. The price has broken above a key resistance level and has been confirmed by a strong candle, indicating a potential bullish trend. The next resistance key levels are located at 0.0000509 | 0.0000541 | 0.0000592, and the major support zones can be found at 0.0000458 | 0.0000439 | 0.0000388. Consider entering a trade at the current price zone of 0.0000496 and targeting higher levels.
📊 Technical Metrics Index Summary:
├Mrkt Price ⌁ 0.0000496 ₿├Change: 24h[🔺4.20%] 1W[-5.12%]┊ └ 1-M[4.00%] 3-M[21.93%]├24hVol: 31.620 ₿├Osciltrs: NEUTRAL├MAs: STRONG_BUY┊🚥 Market Sentiment Index:
├News: N/A├Twitter: 0.64 - Bullish├Reddit: 0.50 - Bearish┊🪄 Unlock Trading Signal below.
🎯 Follow Idea for updates.
Exciting news 💳!
You can now pay for your membership using a variety of payment methods, including credit and debit cards, Apple Pay, and Google Pay. Simply visit our Checkout page on BuyMeACoffee to choose your preferred membership plan to purchase. It's quick, secure, and hassle-free!
Upgrade your membership today and enjoy all the benefits we have to offer.
Crypto2AF™ Signals pinned «Exciting news 💳! You can now pay for your membership using a variety of payment methods, including credit and debit cards, Apple Pay, and Google Pay. Simply visit our Checkout page on BuyMeACoffee to choose your preferred membership plan to purchase. It's…»
📚 New Technical analysis for [ THORChain ]
🎯 #RUNE/USDT
🪄 RUNE Chart ➖ Tradingview Idea
🔸 A Resistance Breakout and Confirmation has been detected on the $RUNE / $USDT chart. The price has broken above a key resistance level and has been confirmed by a strong candle, indicating a potential bullish trend. The next resistance key levels are located at 1.819 | 1.986 | 2.285, and the major support zones can be found at 1.52 | 1.388 | 1.089. Consider entering a trade at the current price zone of 1.635 and targeting higher levels.
📊 Technical Metrics Index Summary:
🚥 Market Sentiment Index:
🪄 Unlock Trading Signal below.
🎯 Follow Idea for updates.
🎯 #RUNE/USDT
┊ Rank: N/A🪄 RUNE Chart ➖ Tradingview Idea
🔸 A Resistance Breakout and Confirmation has been detected on the $RUNE / $USDT chart. The price has broken above a key resistance level and has been confirmed by a strong candle, indicating a potential bullish trend. The next resistance key levels are located at 1.819 | 1.986 | 2.285, and the major support zones can be found at 1.52 | 1.388 | 1.089. Consider entering a trade at the current price zone of 1.635 and targeting higher levels.
📊 Technical Metrics Index Summary:
├Mrkt Price ⌁ 1.635 ₮├Change: 24h[🔻-0.73%] 1W[N/A]┊ └ 1-M[N/A] 3-M[N/A]├24hVol: 9,347,576.790 ₮├Osciltrs: NEUTRAL├MAs: STRONG_SELL┊🚥 Market Sentiment Index:
├News: N/A├Twitter: 0.70 - Bullish├Reddit: 0.38 - Bearish┊🪄 Unlock Trading Signal below.
🎯 Follow Idea for updates.
📚 New Technical analysis for [ EOS ]
🎯 #EOS/BTC
🪄 EOS Chart ➖ Tradingview Idea
🔸 A Resistance Breakout has been identified on the $EOS / $BTC chart. The price has broken above a key resistance level, indicating a potential bullish trend. The next resistance key levels are located at 0.0000509 | 0.0000541 | 0.0000592, and the major support zones can be found at 0.0000458 | 0.0000439 | 0.0000388. Consider entering at the current price zone of 0.0000502 and targeting higher levels.
📊 Technical Metrics Index Summary:
🚥 Market Sentiment Index:
🪄 Unlock Trading Signal below.
🎯 Follow Idea for updates.
🎯 #EOS/BTC
┊ Rank: 42🪄 EOS Chart ➖ Tradingview Idea
🔸 A Resistance Breakout has been identified on the $EOS / $BTC chart. The price has broken above a key resistance level, indicating a potential bullish trend. The next resistance key levels are located at 0.0000509 | 0.0000541 | 0.0000592, and the major support zones can be found at 0.0000458 | 0.0000439 | 0.0000388. Consider entering at the current price zone of 0.0000502 and targeting higher levels.
📊 Technical Metrics Index Summary:
├Mrkt Price ⌁ 0.0000502 ₿├Change: 24h[🔺1.21%] 1W[-0.05%]┊ └ 1-M[10.74%] 3-M[25.18%]├24hVol: 35.407 ₿├Osciltrs: BUY├MAs: STRONG_BUY┊🚥 Market Sentiment Index:
├News: N/A├Twitter: 0.57 - Bullish├Reddit: 0.69 - Bullish┊🪄 Unlock Trading Signal below.
🎯 Follow Idea for updates.
📚 New Technical analysis for [ ForTube ]
🎯 #FOR/BTC
🔸 A Bollinger Band breakout has been identified on the $FOR / $BTC chart. The price has moved outside of the upper Bollinger Band, indicating a potential bullish trend. The next resistance key levels are located at 0.00000137 | 0.00000173 | , and the major support zones can be found at 0.00000079 | 0.00000057 | None. Consider buying at the current price zone of 0.00000104 and targeting higher levels.BBand_Squeeze
📊 Technical Metrics Index Summary:
🎯 #FOR/BTC
┊ Rank: 673
🪄 FOR Chart ➖ Tradingview Idea🔸 A Bollinger Band breakout has been identified on the $FOR / $BTC chart. The price has moved outside of the upper Bollinger Band, indicating a potential bullish trend. The next resistance key levels are located at 0.00000137 | 0.00000173 | , and the major support zones can be found at 0.00000079 | 0.00000057 | None. Consider buying at the current price zone of 0.00000104 and targeting higher levels.BBand_Squeeze
📊 Technical Metrics Index Summary:
├Mrkt Price ⌁ 0.00000104 ₿
├P.Change: 24h[🔺1.96%]
└ 1-W[-2.93%] 30D[25.38%]
└ 90D[40.28%]
├24hVol: 20.362 ₿
├Osciltrs: BUY
├MAs: STRONG_BUY
┊
🚥 Market Sentiment Index:├News: N/A
├Twitter: 0.33 - Bearish
├Reddit: 0.51 - Bullish
┊
┊ 🪄 Unlock Trading Signal below.└ 🎯 Follow Idea for updates.
📚 New Technical analysis for [ Orion Protocol ]
🎯 #ORN/BTC
🪄 ORN Chart ➖ Tradingview Idea
🔸 A Resistance Breakout and Confirmation has been detected on the $ORN / $BTC chart. The price has broken above a key resistance level and has been confirmed by a strong candle, indicating a potential bullish trend. The next resistance key levels are located at 0.0000536 | 0.0000592 | 0.0000689, and the major support zones can be found at 0.0000439 | 0.0000398 | 0.0000301. Consider entering a trade at the current price zone of 0.0000478 and targeting higher levels.
📊 Technical Metrics Index Summary:
🚥 Market Sentiment Index:
🎯 #ORN/BTC
┊ Rank: 437🪄 ORN Chart ➖ Tradingview Idea
🔸 A Resistance Breakout and Confirmation has been detected on the $ORN / $BTC chart. The price has broken above a key resistance level and has been confirmed by a strong candle, indicating a potential bullish trend. The next resistance key levels are located at 0.0000536 | 0.0000592 | 0.0000689, and the major support zones can be found at 0.0000439 | 0.0000398 | 0.0000301. Consider entering a trade at the current price zone of 0.0000478 and targeting higher levels.
📊 Technical Metrics Index Summary:
├Mrkt Price ⌁ 0.0000478 ₿├P.Change: 24h[🔺4.83%]
└ 1-W[-5.63%] 30D[17.90%]└ 90D[4.85%]├24hVol: 10.240 ₿├Osciltrs: NEUTRAL├MAs: SELL┊🚥 Market Sentiment Index:
├News: N/A├Twitter: 0.62 - Bullish├Reddit: 0.58 - Bullish┊┊ 🪄 Unlock Trading Signal below.└ 🎯 Follow Idea for updates.
Crypto2AF™ Signals pinned «Our Top Signals Recap: Daily: 🥇 #FOR 9.62% Weekly: 🥇 #SNX 12.98% 🥈 #FOR 9.62% 🥉 #EOS 9.16% #KMD 6.74% | #DIA 3.43% #AVA 2.96% | #WTC 2.62% #ONT 2.56% | #ENS 2.47% | #FRONT 2.02%»
📚 New Technical analysis for [ Trader Joe ]
🎯 #JOE/BTC
🔸 A Resistance Breakout and Confirmation has been detected on the $JOE / $BTC chart. The price has broken above a key resistance level and has been confirmed by a strong candle, indicating a potential bullish trend. The next resistance key levels are located at 0.00001218 | 0.00001348 | 0.00001556, and the major support zones can be found at 0.0000101 | 0.00000932 | 0.00000724. Consider entering a trade at the current price zone of 0.00001113 and targeting higher levels.
📊 Technical Metrics Index Summary:
🎯 #JOE/BTC
┊ Rank: 294
🪄 JOE Chart ➖ Tradingview Idea🔸 A Resistance Breakout and Confirmation has been detected on the $JOE / $BTC chart. The price has broken above a key resistance level and has been confirmed by a strong candle, indicating a potential bullish trend. The next resistance key levels are located at 0.00001218 | 0.00001348 | 0.00001556, and the major support zones can be found at 0.0000101 | 0.00000932 | 0.00000724. Consider entering a trade at the current price zone of 0.00001113 and targeting higher levels.
📊 Technical Metrics Index Summary:
├Mrkt Price ⌁ 0.00001113 ₿
├P.Change: 24h[🔺0.18%]

└ 1-W[-3.55%] 30D[11.40%]
└ 90D[32.30%]
├24hVol: 1.533 ₿
├Osciltrs: NEUTRAL
├MAs: STRONG_BUY
┊
🚥 Market Sentiment Index:├News: N/A
├Twitter: N/A
├Reddit: N/A
┊
┊ 🪄 Unlock Trading Signal below.└ 🎯 Follow Idea for updates.
📚 New Technical analysis for [ EOS ]
🎯 #EOS/BTC
🪄 EOS Chart ➖ Tradingview Idea
🔸 A Resistance Breakout has been identified on the $EOS / $BTC chart. The price has broken above a key resistance level, indicating a potential bullish trend. The next resistance key levels are located at 0.0000509 | 0.0000541 | 0.0000592, and the major support zones can be found at 0.0000458 | 0.0000439 | 0.0000388. Consider entering at the current price zone of 0.0000564 and targeting higher levels.
📊 Technical Metrics Index Summary:
🚥 Market Sentiment Index:
🎯 #EOS/BTC
┊ Rank: 41🪄 EOS Chart ➖ Tradingview Idea
🔸 A Resistance Breakout has been identified on the $EOS / $BTC chart. The price has broken above a key resistance level, indicating a potential bullish trend. The next resistance key levels are located at 0.0000509 | 0.0000541 | 0.0000592, and the major support zones can be found at 0.0000458 | 0.0000439 | 0.0000388. Consider entering at the current price zone of 0.0000564 and targeting higher levels.
📊 Technical Metrics Index Summary:
├Mrkt Price ⌁ 0.0000564 ₿├P.Change: 24h[🚀7.84%]
└ 1-W[12.41%] 30D[16.69%]└ 90D[36.42%]├24hVol: 156.723 ₿├Osciltrs: NEUTRAL├MAs: STRONG_BUY┊🚥 Market Sentiment Index:
├News: 0.65 - Bullish├Twitter: 0.67 - Bullish├Reddit: 0.69 - Bullish┊┊ 🪄 Unlock Trading Signal below.└ 🎯 Follow Idea for updates.
📚 New Technical analysis for [ Coti ]
🎯 #COTI/BTC
🔸 A Resistance Breakout has been identified on the $COTI / $BTC chart. The price has broken above a key resistance level, indicating a potential bullish trend. The next resistance key levels are located at 0.00000415 | 0.00000449 | 0.00000507, and the major support zones can be found at 0.00000357 | 0.00000333 | 0.00000275. Consider entering at the current price zone of 0.0000037 and targeting higher levels.
📊 Technical Metrics Index Summary:
🎯 #COTI/BTC
┊ Rank: 265
🪄 COTI Chart ➖ Tradingview Idea🔸 A Resistance Breakout has been identified on the $COTI / $BTC chart. The price has broken above a key resistance level, indicating a potential bullish trend. The next resistance key levels are located at 0.00000415 | 0.00000449 | 0.00000507, and the major support zones can be found at 0.00000357 | 0.00000333 | 0.00000275. Consider entering at the current price zone of 0.0000037 and targeting higher levels.
📊 Technical Metrics Index Summary:
├Mrkt Price ⌁ 0.0000037 ₿
├P.Change: 24h[🔺1.09%]
└ 1-W[-4.75%] 30D[-18.31%]
└ 90D[14.20%]
├24hVol: 4.836 ₿
├Osciltrs: NEUTRAL
├MAs: BUY
┊
🚥 Market Sentiment Index:├News: N/A
├Twitter: 0.82 - Very Bullish
├Reddit: N/A
┊
┊ 🪄 Unlock Trading Signal below.└ 🎯 Follow Idea for updates.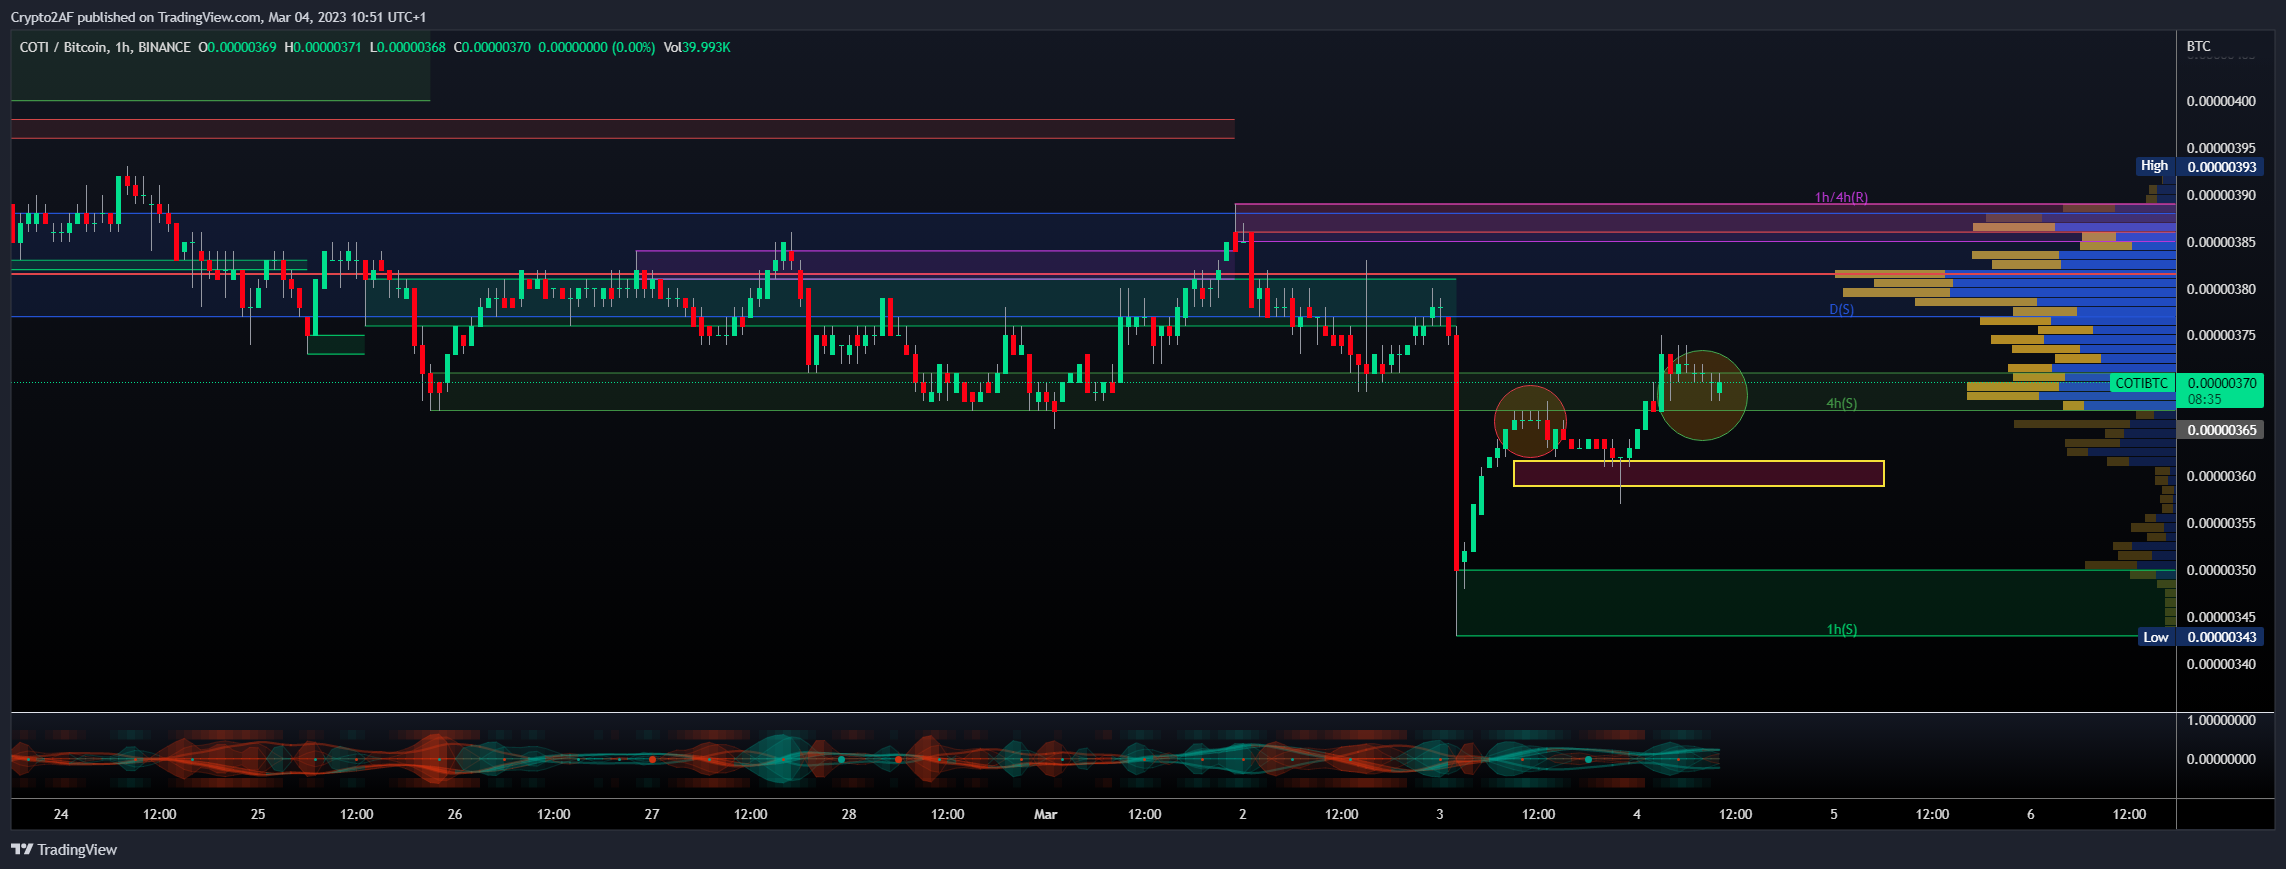
Crypto2AF™ Signals pinned «Our Top Signals Recap: Daily: 🥇 #EOS 6.38% Weekly: 🥇 #SNX 12.98% 🥈 #FOR 9.62% 🥉 #EOS 9.16% #KMD 6.74% | #DIA 3.43% #WTC 2.62% | #ONT 2.56% #ENS 2.47% | #ICX 1.83% #BADGER 1.42%»
https://telegra.ph/Fundamental-and-TA-updates-03-05
Please open Telegram to view this post
VIEW IN TELEGRAM
Telegraph
Fundamental and TA updates
🚥 Market Sentiment Index: Data sentiments analysis on crypto-related Reddit, news, and Twitter
📚 New Technical analysis for [ Monero ]
🎯 #XMR/BTC
🔸 A Resistance Breakout has been identified on the $XMR / $BTC chart. The price has broken above a key resistance level, indicating a potential bullish trend. The next resistance key levels are located at 0.006806 | 0.007185 | 0.007824, and the major support zones can be found at 0.006167 | 0.005907 | 0.005268. Consider entering at the current price zone of 0.006648 and targeting higher levels.
📊 Technical Metrics Index Summary:
🎯 #XMR/BTC
┊ Rank: 28
🪄 XMR Chart ➖ Tradingview Idea🔸 A Resistance Breakout has been identified on the $XMR / $BTC chart. The price has broken above a key resistance level, indicating a potential bullish trend. The next resistance key levels are located at 0.006806 | 0.007185 | 0.007824, and the major support zones can be found at 0.006167 | 0.005907 | 0.005268. Consider entering at the current price zone of 0.006648 and targeting higher levels.
📊 Technical Metrics Index Summary:
├Mrkt Price ⌁ 0.006648 ₿
├├ P.Change: 24h[🔺1.22%]
├├ 1-W[-1.81%] 30D[-13.50%]
├├ 90D[2.42%]
├24hVol: 121.750 ₿
├Osciltrs: BUY
├MAs: STRONG_BUY
┊
🚥 Market Sentiment Index:├News: N/A
├Twitter: 0.56 - Bullish
├Reddit: 0.77 - Very Bullish
┊Binance┊Kucoin┊Huobipro┊
┊┊🪄Unlock Trading Signal below.
┊┊🎯Follow Idea to get updates.
Have a rest!
Please open Telegram to view this post
VIEW IN TELEGRAM
👍1
📚 New Technical analysis for [ Alpaca City ]
🎯 #ALPACA/BTC
🔸 Hey traders, we've identified bullish signals on the $ALPACA / $BTC chart through the detection of both a Bollinger Band breakout and a Resistance Breakout. The Bollinger Band indicates a potential bullish trend as the price has moved outside of the upper band, while the Resistance Breakout confirms this trend by showing the price breaking above a key resistance level. Given the alignment of these signals, it may be a good idea to consider entering a long position and targeting higher levels. Our analysis indicates that the key resistance levels are at 0.00001394 | 0.00001491 | 0.00001643 and the major support zones are at 0.00001242 | 0.00001187 | 0.00001035. However, it is important to also consider other factors such as overall market conditions and other technical indicators before making a trade decision.
📊 Technical Metrics Index Summary:
🎯 #ALPACA/BTC
┊ Rank: 1408
🪄 ALPACA Chart ➖ Tradingview Idea🔸 Hey traders, we've identified bullish signals on the $ALPACA / $BTC chart through the detection of both a Bollinger Band breakout and a Resistance Breakout. The Bollinger Band indicates a potential bullish trend as the price has moved outside of the upper band, while the Resistance Breakout confirms this trend by showing the price breaking above a key resistance level. Given the alignment of these signals, it may be a good idea to consider entering a long position and targeting higher levels. Our analysis indicates that the key resistance levels are at 0.00001394 | 0.00001491 | 0.00001643 and the major support zones are at 0.00001242 | 0.00001187 | 0.00001035. However, it is important to also consider other factors such as overall market conditions and other technical indicators before making a trade decision.
📊 Technical Metrics Index Summary:
├Mrkt Price ⌁ 0.00001539 ₿
├├ P.Change: 24h[🚀16.41%]
├├ 1-W[N/A] 30D[-16.00%]
├├ 90D[-5.42%]
├24hVol: 47.071 ₿
├Osciltrs: BUY
├MAs: STRONG_BUY
┊
🚥 Market Sentiment Index:├News: N/A
├Twitter: 0.44 - Bearish
├Reddit: 0.18 - Very Bearish
┊Binance┊Kucoin┊
┊┊🪄Unlock Trading Signal below.
┊┊🎯Follow Idea to get updates.