
📚 New Technical analysis for [ Stellar ]
🎯 #XLM/USDT
🪄 XLM Chart ➖ Tradingview Idea
🔸 We've detected a Resistance Breakout and Confirmation on the $XLM / $USDT chart. The price has broken above a key resistance level and has been confirmed by a strong candle, indicating a potential bullish trend. The next resistance key levels are at 0.0955 | 0.1005 | 0.1124 and the major support zones are respectively at 0.0836 | 0.0767 | 0.0648. We may consider entering a trade at the current price zone at 0.0947 and targetting higher levels.
📊 Technical Metrics Index Summary:
🚥 Market Sentiment Index:
* Curated by MPDBreakout System.
* Unlock Trading Signal below.
🎯 #XLM/USDT
🪄 XLM Chart ➖ Tradingview Idea
🔸 We've detected a Resistance Breakout and Confirmation on the $XLM / $USDT chart. The price has broken above a key resistance level and has been confirmed by a strong candle, indicating a potential bullish trend. The next resistance key levels are at 0.0955 | 0.1005 | 0.1124 and the major support zones are respectively at 0.0836 | 0.0767 | 0.0648. We may consider entering a trade at the current price zone at 0.0947 and targetting higher levels.
📊 Technical Metrics Index Summary:
⎿ Mrkt Price ⌁ 0.0947 ₮⎿ 24hChng: 🔺 1.175%⎿ 24hVol: 11,029,334.616 ₮⎿ Osciltrs: NEUTRAL⎿ MAs: BUY🚥 Market Sentiment Index:
⎿ News: N/A⎿ Twitter: 0.61 - Bullish⎿ Reddit: 0.58 - Bullish* Curated by MPDBreakout System.
* Unlock Trading Signal below.
📚 New Technical analysis for [ Komodo ]
🎯 #KMD/BTC
🪄 KMD Chart ➖ Tradingview Idea
🔸 We've detected a Resistance Breakout and Confirmation on the $KMD / $BTC chart. The price has broken above a key resistance level and has been confirmed by a strong candle, indicating a potential bullish trend. The next resistance key levels are at 0.00001304 | 0.00001379 | 0.00001531 and the major support zones are respectively at 0.00001152 | 0.00001075 | 0.00000923. We may consider entering a trade at the current price zone at 0.00001288 and targetting higher levels.
📊 Technical Metrics Index Summary:
🚥 Market Sentiment Index:
* Curated by MPDBreakout System.
* Unlock Trading Signal below.
🎯 #KMD/BTC
🪄 KMD Chart ➖ Tradingview Idea
🔸 We've detected a Resistance Breakout and Confirmation on the $KMD / $BTC chart. The price has broken above a key resistance level and has been confirmed by a strong candle, indicating a potential bullish trend. The next resistance key levels are at 0.00001304 | 0.00001379 | 0.00001531 and the major support zones are respectively at 0.00001152 | 0.00001075 | 0.00000923. We may consider entering a trade at the current price zone at 0.00001288 and targetting higher levels.
📊 Technical Metrics Index Summary:
⎿ Mrkt Price ⌁ 0.00001288 ₿⎿ 24hChng: 🔻 -0.31%⎿ 24hVol: 17.668 ₿⎿ Osciltrs: NEUTRAL⎿ MAs: STRONG_BUY🚥 Market Sentiment Index:
⎿ News: N/A⎿ Twitter: 0.47 - Bearish⎿ Reddit: 0.82 - Very Bullish* Curated by MPDBreakout System.
* Unlock Trading Signal below.
📚 New Technical analysis for [ aelf ]
🎯 #ELF/BTC
🪄 ELF Chart ➖ Tradingview Idea
🔸 We have identified both a Super Trend pattern and a Resistance Breakout on the $ELF / $BTC chart. Both indicators are signaling a bullish trend, with the Super Trend showing a bullish trend and the Resistance Breakout confirming this trend by showing the price breaking above a key resistance level. Given the alignment of these signals, it may be a good idea to consider entering a long position and targeting higher levels. Our analysis indicates that the key resistance levels are at 0.00001076 | 0.00001159 | 0.00001307 and the major support zones are at 0.00000928 | 0.00000863 | 0.00000715. However, it is important to also consider other factors such as overall market conditions and other technical indicators before making a trade decision.
📊 Technical Metrics Index Summary:
🚥 Market Sentiment Index:
* Curated by MPDBreakout System.
* Unlock Trading Signal below.
🎯 #ELF/BTC
🪄 ELF Chart ➖ Tradingview Idea
🔸 We have identified both a Super Trend pattern and a Resistance Breakout on the $ELF / $BTC chart. Both indicators are signaling a bullish trend, with the Super Trend showing a bullish trend and the Resistance Breakout confirming this trend by showing the price breaking above a key resistance level. Given the alignment of these signals, it may be a good idea to consider entering a long position and targeting higher levels. Our analysis indicates that the key resistance levels are at 0.00001076 | 0.00001159 | 0.00001307 and the major support zones are at 0.00000928 | 0.00000863 | 0.00000715. However, it is important to also consider other factors such as overall market conditions and other technical indicators before making a trade decision.
📊 Technical Metrics Index Summary:
⎿ Mrkt Price ⌁ 0.00001016 ₿⎿ 24hChng: 🔺 0.994%⎿ 24hVol: 17.623 ₿⎿ Osciltrs: NEUTRAL⎿ MAs: STRONG_BUY🚥 Market Sentiment Index:
⎿ News: N/A⎿ Twitter: 0.34 - Bearish⎿ Reddit: 0.61 - Bullish* Curated by MPDBreakout System.
* Unlock Trading Signal below.
⚡1
📚 New Technical analysis for [ Basic Attention Token ]
🎯 #BAT/BTC
🪄 BAT Chart ➖ Tradingview Idea
🔸 Hey traders, we've identified a Resistance Breakout on the $BAT / $BTC chart. The price has broken above a key resistance level, which can indicate a potential bullish trend. Taking in consideration the next resistance key levels are at 0.00001375 | 0.0000148 | 0.00001661 and the major support zones are respectively at 0.00001194 | 0.00001118 | 0.00000937. It is a bullish indication and we may consider entering at the current price zone at 0.00001348 and targetting higher levels.
📊 Technical Metrics Index Summary:
🚥 Market Sentiment Index:
* Curated by MPDBreakout System.
* Unlock Trading Signal below.
🎯 #BAT/BTC
🪄 BAT Chart ➖ Tradingview Idea
🔸 Hey traders, we've identified a Resistance Breakout on the $BAT / $BTC chart. The price has broken above a key resistance level, which can indicate a potential bullish trend. Taking in consideration the next resistance key levels are at 0.00001375 | 0.0000148 | 0.00001661 and the major support zones are respectively at 0.00001194 | 0.00001118 | 0.00000937. It is a bullish indication and we may consider entering at the current price zone at 0.00001348 and targetting higher levels.
📊 Technical Metrics Index Summary:
⎿ Mrkt Price ⌁ 0.00001348 ₿⎿ 24hChng: 🚀 6.815%⎿ 24hVol: 16.478 ₿⎿ Osciltrs: NEUTRAL⎿ MAs: STRONG_BUY🚥 Market Sentiment Index:
⎿ News: N/A⎿ Twitter: 0.56 - Bullish⎿ Reddit: 0.35 - Bearish* Curated by MPDBreakout System.
* Unlock Trading Signal below.
Forwarded from Crypto2AF™ Signals VIP
https://s3.tradingview.com/snapshots/t/tB9aXMrf.png
Please open Telegram to view this post
VIEW IN TELEGRAM
😱1
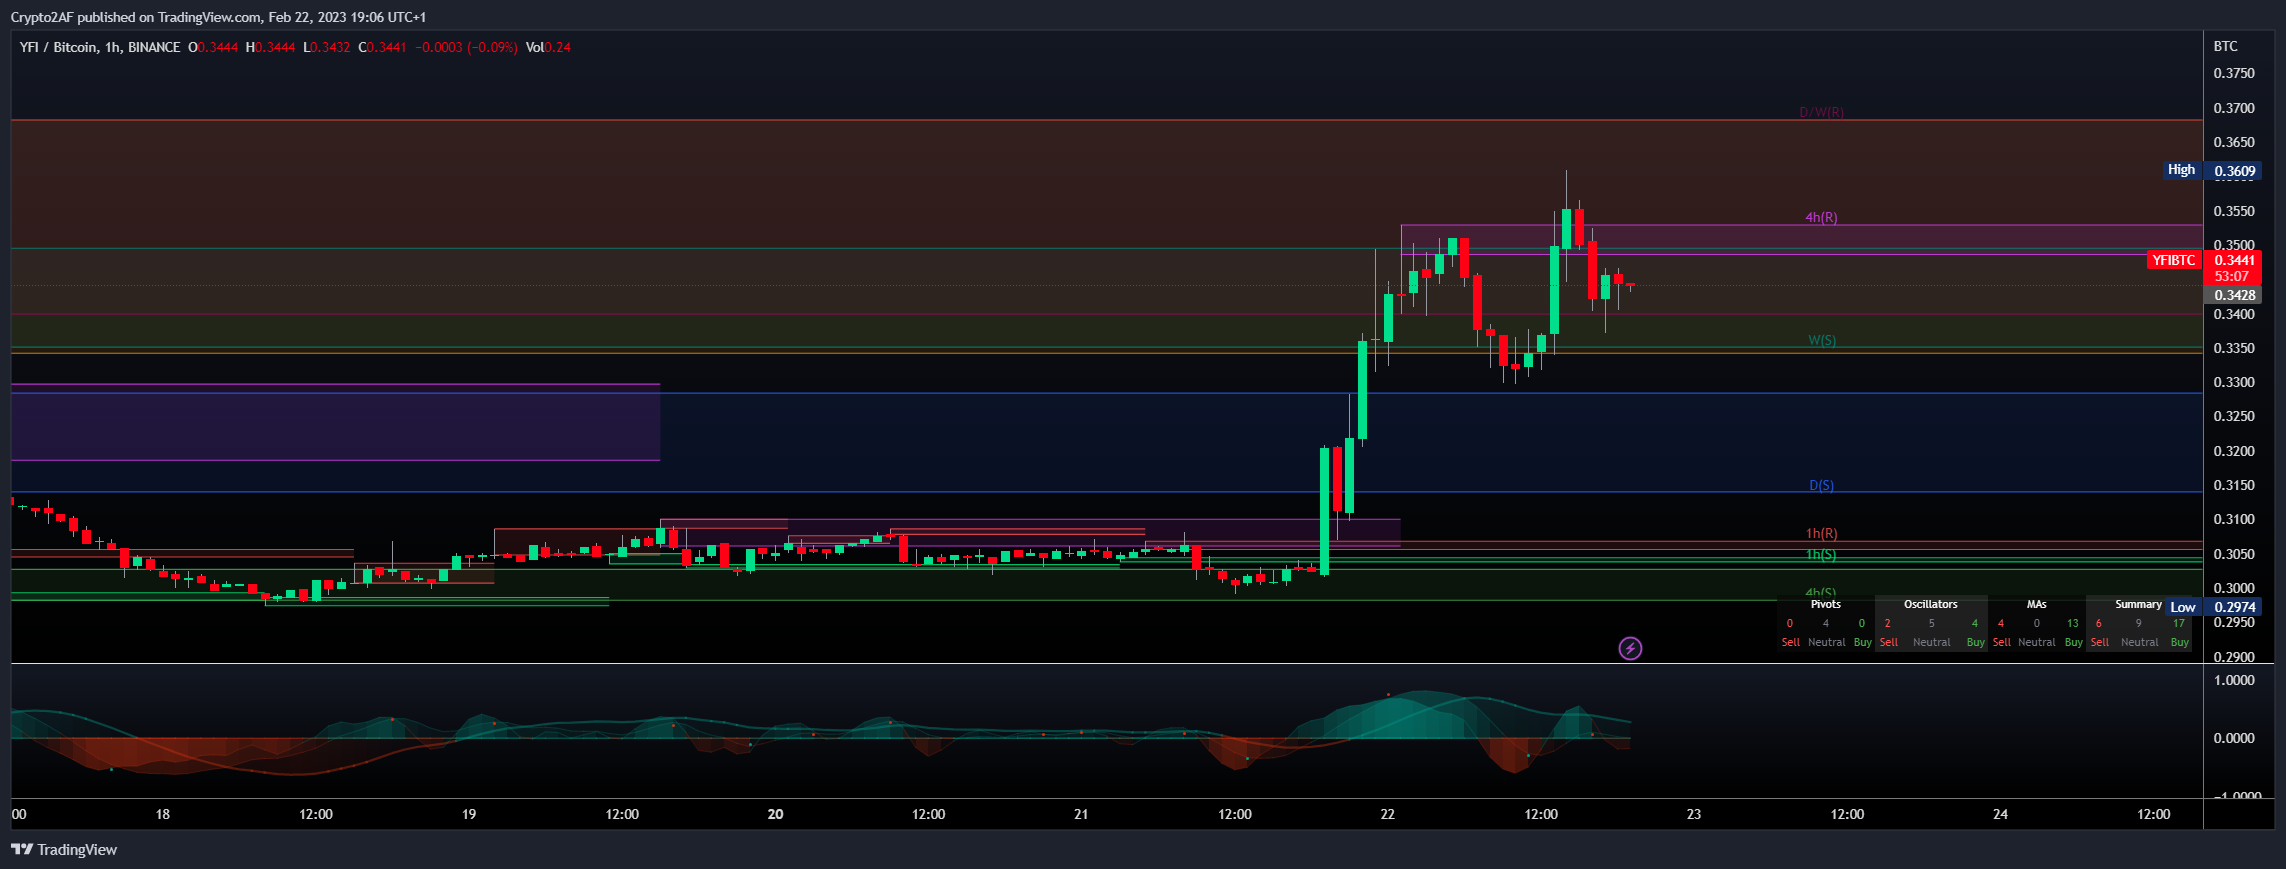
📚 New Technical analysis for [ yearn.finance ]
🎯 #YFI/BTC
🪄 YFI Chart ➖ Tradingview Idea
🔸 Hey traders, we've identified a Resistance Breakout on the $YFI / $BTC chart. The price has broken above a key resistance level, which can indicate a potential bullish trend. Taking in consideration the next resistance key levels are at 0.3241 | 0.343 | 0.3753 and the major support zones are respectively at 0.2918 | 0.2784 | 0.2461. It is a bullish indication and we may consider entering at the current price zone at 0.3441 and targetting higher levels.
📊 Technical Metrics Index Summary:
🚥 Market Sentiment Index:
* Curated by MPDBreakout System.
* Unlock Trading Signal below.
🎯 #YFI/BTC
🪄 YFI Chart ➖ Tradingview Idea
🔸 Hey traders, we've identified a Resistance Breakout on the $YFI / $BTC chart. The price has broken above a key resistance level, which can indicate a potential bullish trend. Taking in consideration the next resistance key levels are at 0.3241 | 0.343 | 0.3753 and the major support zones are respectively at 0.2918 | 0.2784 | 0.2461. It is a bullish indication and we may consider entering at the current price zone at 0.3441 and targetting higher levels.
📊 Technical Metrics Index Summary:
⎿ Mrkt Price ⌁ 0.3441 ₿⎿ 24hChng: 🚀 13.79%⎿ 24hVol: 116.698 ₿⎿ Osciltrs: NEUTRAL⎿ MAs: STRONG_BUY🚥 Market Sentiment Index:
⎿ News: N/A⎿ Twitter: 0.68 - Bullish⎿ Reddit: 0.53 - Bullish* Curated by MPDBreakout System.
* Unlock Trading Signal below.
📚 New Technical analysis for [ Secret ]
🎯 #SCRT/BTC
🪄 SCRT Chart ➖ Tradingview Idea
🔸 Hey traders, we've identified a Trend Reversal on the $SCRT / $BTC chart. The trend of the price has reversed, indicating a potential trend change. The next resistance levels are located at 0.00003534 | 0.00003776 | 0.00004191, while the main support levels can be found at 0.00003119 | 0.00002946 | 0.00002531. It may be wise to consider buying at the current price of 0.0000344 and benefit from the trend continuation.
📊 Technical Metrics Index Summary:
🚥 Market Sentiment Index:
* Curated by MPDBreakout System.
* Unlock Trading Signal below.
🎯 #SCRT/BTC
🪄 SCRT Chart ➖ Tradingview Idea
🔸 Hey traders, we've identified a Trend Reversal on the $SCRT / $BTC chart. The trend of the price has reversed, indicating a potential trend change. The next resistance levels are located at 0.00003534 | 0.00003776 | 0.00004191, while the main support levels can be found at 0.00003119 | 0.00002946 | 0.00002531. It may be wise to consider buying at the current price of 0.0000344 and benefit from the trend continuation.
📊 Technical Metrics Index Summary:
⎿ Mrkt Price ⌁ 0.0000344 ₿⎿ 24hChng: 🚀 5.038%⎿ 24hVol: 8.909 ₿⎿ Osciltrs: NEUTRAL⎿ MAs: STRONG_BUY🚥 Market Sentiment Index:
⎿ News: N/A⎿ Twitter: N/A⎿ Reddit: N/A* Curated by MPDBreakout System.
* Unlock Trading Signal below.
📚 New Technical analysis for [ Radicle ]
🎯 #RAD/BTC
🪄 RAD Chart ➖ Tradingview Idea
🔸 We've detected a Resistance Breakout and Confirmation on the $RAD / $BTC chart. The price has broken above a key resistance level and has been confirmed by a strong candle, indicating a potential bullish trend. The next resistance key levels are at 0.0000905 | 0.0000941 | 0.0001031 and the major support zones are respectively at 0.0000815 | 0.0000761 | 0.0000671. We may consider entering a trade at the current price zone at 0.00009 and targetting higher levels.
📊 Technical Metrics Index Summary:
🚥 Market Sentiment Index:
* Curated by MPDBreakout System.
* Unlock Trading Signal below.
🎯 #RAD/BTC
🪄 RAD Chart ➖ Tradingview Idea
🔸 We've detected a Resistance Breakout and Confirmation on the $RAD / $BTC chart. The price has broken above a key resistance level and has been confirmed by a strong candle, indicating a potential bullish trend. The next resistance key levels are at 0.0000905 | 0.0000941 | 0.0001031 and the major support zones are respectively at 0.0000815 | 0.0000761 | 0.0000671. We may consider entering a trade at the current price zone at 0.00009 and targetting higher levels.
📊 Technical Metrics Index Summary:
⎿ Mrkt Price ⌁ 0.00009 ₿⎿ 24hChng: 🔺 4.167%⎿ 24hVol: 14.591 ₿⎿ Osciltrs: BUY⎿ MAs: STRONG_BUY🚥 Market Sentiment Index:
⎿ News: N/A⎿ Twitter: 0.72 - Bullish⎿ Reddit: 0.66 - Bullish* Curated by MPDBreakout System.
* Unlock Trading Signal below.
TradingView
$RAD/#BTC [#Radicle]: Resistance_Breakout_Confirmation for BINANCE:RADBTC by Crypto2AF
◳◱ We've detected a Resistance Breakout and Confirmation on the $RAD / $BTC chart. The price has broken above a key resistance level and has been confirmed by a strong candle, indicating a potential bullish trend. The next resistance key levels are at 0.0000905…
📚 New Technical analysis for [ Travala com ]
🎯 #AVA/BTC
🪄 AVA Chart ➖ Tradingview Idea
🔸 Hey traders, we've identified a Resistance Breakout on the $AVA / $BTC chart. The price has broken above a key resistance level, which can indicate a potential bullish trend. Taking in consideration the next resistance key levels are at 0.00003164 | 0.00003322 | 0.00003696 and the major support zones are respectively at 0.0000279 | 0.00002574 | 0.000022. It is a bullish indication and we may consider entering at the current price zone at 0.0000332 and targetting higher levels.
📊 Technical Metrics Index Summary:
🚥 Market Sentiment Index:
* Curated by MPDBreakout System.
* Unlock Trading Signal below.
🎯 #AVA/BTC
🪄 AVA Chart ➖ Tradingview Idea
🔸 Hey traders, we've identified a Resistance Breakout on the $AVA / $BTC chart. The price has broken above a key resistance level, which can indicate a potential bullish trend. Taking in consideration the next resistance key levels are at 0.00003164 | 0.00003322 | 0.00003696 and the major support zones are respectively at 0.0000279 | 0.00002574 | 0.000022. It is a bullish indication and we may consider entering at the current price zone at 0.0000332 and targetting higher levels.
📊 Technical Metrics Index Summary:
⎿ Mrkt Price ⌁ 0.0000332 ₿⎿ 24hChng: 🚀 7.097%⎿ 24hVol: 9.446 ₿⎿ Osciltrs: SELL⎿ MAs: STRONG_BUY🚥 Market Sentiment Index:
⎿ News: N/A⎿ Twitter: 0.75 - Bullish⎿ Reddit: 0.76 - Very Bullish* Curated by MPDBreakout System.
* Unlock Trading Signal below.
📚 New Technical analysis for [ Ethereum Name Service ]
🎯 #ENS/BTC
🪄 ENS Chart ➖ Tradingview Idea
🔸 Hey traders, we've identified a Resistance Breakout on the $ENS / $BTC chart. The price has broken above a key resistance level, which can indicate a potential bullish trend. Taking in consideration the next resistance key levels are at 0.0007104 | 0.0007417 | 0.0008238 and the major support zones are respectively at 0.0006283 | 0.0005775 | 0.0004954. It is a bullish indication and we may consider entering at the current price zone at 0.0006875 and targetting higher levels.
📊 Technical Metrics Index Summary:
🚥 Market Sentiment Index:
* Curated by MPDBreakout System.
* Unlock Trading Signal below.
🎯 #ENS/BTC
🪄 ENS Chart ➖ Tradingview Idea
🔸 Hey traders, we've identified a Resistance Breakout on the $ENS / $BTC chart. The price has broken above a key resistance level, which can indicate a potential bullish trend. Taking in consideration the next resistance key levels are at 0.0007104 | 0.0007417 | 0.0008238 and the major support zones are respectively at 0.0006283 | 0.0005775 | 0.0004954. It is a bullish indication and we may consider entering at the current price zone at 0.0006875 and targetting higher levels.
📊 Technical Metrics Index Summary:
⎿ Mrkt Price ⌁ 0.0006875 ₿⎿ 24hChng: 🔺 2.064%⎿ 24hVol: 12.040 ₿⎿ Osciltrs: NEUTRAL⎿ MAs: STRONG_BUY🚥 Market Sentiment Index:
⎿ News: N/A⎿ Twitter: 0.59 - Bullish⎿ Reddit: 0.71 - Bullish* Curated by MPDBreakout System.
* Unlock Trading Signal below.
📚 New Technical analysis for [ FIO Protocol ]
🎯 #FIO/USDT
🪄 FIO Chart ➖ Tradingview Idea
🔸 We've detected a Resistance Breakout and Confirmation on the $FIO / $USDT chart. The price has broken above a key resistance level and has been confirmed by a strong candle, indicating a potential bullish trend. The next resistance key levels are at 0.0472 | 0.0536 | 0.0678 and the major support zones are respectively at 0.033 | 0.0252 | 0.011. We may consider entering a trade at the current price zone at 0.0453 and targetting higher levels.
📊 Technical Metrics Index Summary:
🚥 Market Sentiment Index:
* Curated by MPDBreakout System.
* Unlock Trading Signal below.
🎯 #FIO/USDT
🪄 FIO Chart ➖ Tradingview Idea
🔸 We've detected a Resistance Breakout and Confirmation on the $FIO / $USDT chart. The price has broken above a key resistance level and has been confirmed by a strong candle, indicating a potential bullish trend. The next resistance key levels are at 0.0472 | 0.0536 | 0.0678 and the major support zones are respectively at 0.033 | 0.0252 | 0.011. We may consider entering a trade at the current price zone at 0.0453 and targetting higher levels.
📊 Technical Metrics Index Summary:
⎿ Mrkt Price ⌁ 0.0453 ₮⎿ 24hChng: 🚀 7.092%⎿ 24hVol: 1,388,249.465 ₮⎿ Osciltrs: BUY⎿ MAs: STRONG_BUY🚥 Market Sentiment Index:
⎿ News: N/A⎿ Twitter: 0.56 - Bullish⎿ Reddit: 0.73 - Bullish* Curated by MPDBreakout System.
* Unlock Trading Signal below.
📚 New Technical analysis for [ Decred ]
🎯 #DCR/BTC
🪄 DCR Chart ➖ Tradingview Idea
🔸 We have identified both a Super Trend pattern and a Resistance Breakout on the $DCR / $BTC chart. Both indicators are signaling a bullish trend, with the Super Trend showing a bullish trend and the Resistance Breakout confirming this trend by showing the price breaking above a key resistance level. Given the alignment of these signals, it may be a good idea to consider entering a long position and targeting higher levels. Our analysis indicates that the key resistance levels are at 0.001123 | 0.001189 | 0.001334 and the major support zones are at 0.000978 | 0.000899 | 0.000754. However, it is important to also consider other factors such as overall market conditions and other technical indicators before making a trade decision.
📊 Technical Metrics Index Summary:
🚥 Market Sentiment Index:
* Curated by MPDBreakout System.
* Unlock Trading Signal below.
🎯 #DCR/BTC
🪄 DCR Chart ➖ Tradingview Idea
🔸 We have identified both a Super Trend pattern and a Resistance Breakout on the $DCR / $BTC chart. Both indicators are signaling a bullish trend, with the Super Trend showing a bullish trend and the Resistance Breakout confirming this trend by showing the price breaking above a key resistance level. Given the alignment of these signals, it may be a good idea to consider entering a long position and targeting higher levels. Our analysis indicates that the key resistance levels are at 0.001123 | 0.001189 | 0.001334 and the major support zones are at 0.000978 | 0.000899 | 0.000754. However, it is important to also consider other factors such as overall market conditions and other technical indicators before making a trade decision.
📊 Technical Metrics Index Summary:
⎿ Mrkt Price ⌁ 0.001103 ₿⎿ 24hChng: 🚀 6.058%⎿ 24hVol: 11.004 ₿⎿ Osciltrs: SELL⎿ MAs: STRONG_BUY🚥 Market Sentiment Index:
⎿ News: N/A⎿ Twitter: 0.65 - Bullish⎿ Reddit: 0.50 - Bearish* Curated by MPDBreakout System.
* Unlock Trading Signal below.
📚 New Technical analysis for [ Ambire AdEx ]
🎯 #ADX/BTC
🪄 ADX Chart ➖ Tradingview Idea
🔸 We've detected a Resistance Breakout and Confirmation on the $ADX / $BTC chart. The price has broken above a key resistance level and has been confirmed by a strong candle, indicating a potential bullish trend. The next resistance key levels are at 0.00000889 | 0.00000977 | 0.00001128 and the major support zones are respectively at 0.00000738 | 0.00000675 | 0.00000524. We may consider entering a trade at the current price zone at 0.00000867 and targetting higher levels.
📊 Technical Metrics Index Summary:
🚥 Market Sentiment Index:
* Curated by MPDBreakout System.
* Unlock Trading Signal below.
🎯 #ADX/BTC
🪄 ADX Chart ➖ Tradingview Idea
🔸 We've detected a Resistance Breakout and Confirmation on the $ADX / $BTC chart. The price has broken above a key resistance level and has been confirmed by a strong candle, indicating a potential bullish trend. The next resistance key levels are at 0.00000889 | 0.00000977 | 0.00001128 and the major support zones are respectively at 0.00000738 | 0.00000675 | 0.00000524. We may consider entering a trade at the current price zone at 0.00000867 and targetting higher levels.
📊 Technical Metrics Index Summary:
⎿ Mrkt Price ⌁ 0.00000867 ₿⎿ 24hChng: 🔺 4.458%⎿ 24hVol: 29.971 ₿⎿ Osciltrs: NEUTRAL⎿ MAs: STRONG_BUY🚥 Market Sentiment Index:
⎿ News: N/A⎿ Twitter: 0.57 - Bullish⎿ Reddit: 0.77 - Very Bullish* Curated by MPDBreakout System.
* Unlock Trading Signal below.
📚 New Technical analysis for [ Origin Protocol ]
🎯 #OGN/BTC
🪄 OGN Chart ➖ Tradingview Idea
🔸 Hey traders, we've identified a Resistance Breakout on the $OGN / $BTC chart. The price has broken above a key resistance level, which can indicate a potential bullish trend. Taking in consideration the next resistance key levels are at 0.00000721 | 0.00000822 | 0.00000999 and the major support zones are respectively at 0.00000544 | 0.00000468 | 0.00000291. It is a bullish indication and we may consider entering at the current price zone at 0.00000633 and targetting higher levels.
📊 Technical Metrics Index Summary:
* Unlock Trading Signal below.
🎯 #OGN/BTC
🪄 OGN Chart ➖ Tradingview Idea
🔸 Hey traders, we've identified a Resistance Breakout on the $OGN / $BTC chart. The price has broken above a key resistance level, which can indicate a potential bullish trend. Taking in consideration the next resistance key levels are at 0.00000721 | 0.00000822 | 0.00000999 and the major support zones are respectively at 0.00000544 | 0.00000468 | 0.00000291. It is a bullish indication and we may consider entering at the current price zone at 0.00000633 and targetting higher levels.
📊 Technical Metrics Index Summary:
⎿  Mrkt Price ⌁ 0.00000633 ₿
⎿  24hChng: 🔺 3.601%
⎿  24hVol: 9.767 ₿
⎿  Osciltrs: NEUTRAL
⎿  MAs: STRONG_BUY
🚥 Market Sentiment Index:⎿ News: N/A
⎿ Twitter: 0.75 - Bullish
⎿ Reddit: 0.63 - Bullish
* Curated by MPDBreakout System.* Unlock Trading Signal below.
📚 New Technical analysis for [ WazirX ]
🎯 #WRX/BTC
🪄 WRX Chart ➖ Tradingview Idea
🔸 We have identified both a Super Trend pattern and a Resistance Breakout on the $WRX / $BTC chart. Both indicators are signaling a bullish trend, with the Super Trend showing a bullish trend and the Resistance Breakout confirming this trend by showing the price breaking above a key resistance level. Given the alignment of these signals, it may be a good idea to consider entering a long position and targeting higher levels. Our analysis indicates that the key resistance levels are at 0.00000895 | 0.00000937 | 0.00001036 and the major support zones are at 0.00000796 | 0.00000739 | 0.0000064. However, it is important to also consider other factors such as overall market conditions and other technical indicators before making a trade decision.
📊 Technical Metrics Index Summary:
🚥 Market Sentiment Index:
* Curated by MPDBreakout System.
* Unlock Trading Signal below.
🎯 #WRX/BTC
🪄 WRX Chart ➖ Tradingview Idea
🔸 We have identified both a Super Trend pattern and a Resistance Breakout on the $WRX / $BTC chart. Both indicators are signaling a bullish trend, with the Super Trend showing a bullish trend and the Resistance Breakout confirming this trend by showing the price breaking above a key resistance level. Given the alignment of these signals, it may be a good idea to consider entering a long position and targeting higher levels. Our analysis indicates that the key resistance levels are at 0.00000895 | 0.00000937 | 0.00001036 and the major support zones are at 0.00000796 | 0.00000739 | 0.0000064. However, it is important to also consider other factors such as overall market conditions and other technical indicators before making a trade decision.
📊 Technical Metrics Index Summary:
⎿ Mrkt Price ⌁ 0.00000853 ₿⎿ 24hChng: 🔺 2.771%⎿ 24hVol: 3.274 ₿⎿ Osciltrs: BUY⎿ MAs: STRONG_BUY🚥 Market Sentiment Index:
⎿ News: 0.23 - Very Bearish⎿ Twitter: 0.30 - Bearish⎿ Reddit: 0.28 - Very Bearish* Curated by MPDBreakout System.
* Unlock Trading Signal below.
📚 New Technical analysis for [ 0x ]
🎯 #ZRX/BTC
🪄 ZRX Chart ➖ Tradingview Idea
🔸 We've detected a Resistance Breakout and Confirmation on the $ZRX / $BTC chart. The price has broken above a key resistance level and has been confirmed by a strong candle, indicating a potential bullish trend. The next resistance key levels are at 0.00001107 | 0.00001158 | 0.00001263 and the major support zones are respectively at 0.00001002 | 0.00000948 | 0.00000843. We may consider entering a trade at the current price zone at 0.00001179 and targetting higher levels.
📊 Technical Metrics Index Summary:
🚥 Market Sentiment Index:
* Curated by MPDBreakout System.
* Unlock Trading Signal below.
🎯 #ZRX/BTC
🪄 ZRX Chart ➖ Tradingview Idea
🔸 We've detected a Resistance Breakout and Confirmation on the $ZRX / $BTC chart. The price has broken above a key resistance level and has been confirmed by a strong candle, indicating a potential bullish trend. The next resistance key levels are at 0.00001107 | 0.00001158 | 0.00001263 and the major support zones are respectively at 0.00001002 | 0.00000948 | 0.00000843. We may consider entering a trade at the current price zone at 0.00001179 and targetting higher levels.
📊 Technical Metrics Index Summary:
⎿ Mrkt Price ⌁ 0.00001179 ₿⎿ 24hChng: 🚀 9.471%⎿ 24hVol: 19.704 ₿⎿ Osciltrs: NEUTRAL⎿ MAs: STRONG_BUY🚥 Market Sentiment Index:
⎿ News: N/A⎿ Twitter: 0.62 - Bullish⎿ Reddit: 0.21 - Very Bearish* Curated by MPDBreakout System.
* Unlock Trading Signal below.
Today marks the 13th anniversary of an iconic moment in the history of Bitcoin. It was on this day, 13 years ago, that the creator of Bitcoin, Satoshi Nakamoto, updated the Bitcoin logo by embedding the symbol '₿' within a gold coin. This logo has since become synonymous with the world's first cryptocurrency and has become an iconic symbol of the digital currency revolution.
The logo update not only marked a milestone in the development of Bitcoin, but it also cemented the currency's status as a legitimate form of currency. The use of the gold coin design was a nod to the currency's potential as a store of value, while the '₿' symbol within it represented the currency's digital nature.
Today, we can still appreciate the elegance and simplicity of the Bitcoin logo. The logo has become an iconic symbol of the cryptocurrency movement and is recognized around the world. It has become a visual representation of the power of blockchain technology and the potential of decentralized finance.
As we look back on this momentous occasion, we are reminded of the incredible journey that Bitcoin has taken since its inception. From a white paper to a global phenomenon, Bitcoin has come a long way in just over a decade. Today, it continues to be a leading force in the cryptocurrency space, inspiring new innovations and driving forward the adoption of blockchain technology.
In conclusion, the Bitcoin logo update of 13 years ago was a defining moment in the history of cryptocurrency. The simplicity and elegance of the logo have made it an iconic symbol of the digital currency revolution. As we look ahead to the future, we can be confident that Bitcoin will continue to lead the way in transforming the world of finance.
Forwarded from Crypto2AF™ Signals VIP
Happy 13th anniversary
#Bitcoin! Let's continue to drive innovation and adoption in the cryptocurrency space.
#cryptocurrencies #blockchaintechnology
#Bitcoin! Let's continue to drive innovation and adoption in the cryptocurrency space.
#cryptocurrencies #blockchaintechnology
TradingView
On this day, 13 years ago, Satoshi Nakamoto updated the BTC logo for BINANCE:BTCUSDT by Crypto2AF
🎯 Today marks the 13th anniversary of an iconic moment in the history of Bitcoin. It was on this day, 13 years ago, that the creator of Bitcoin, Satoshi Nakamoto, updated the Bitcoin logo by embedding the symbol '₿' within a gold coin. This logo has since…
📚 New Technical analysis for [ Frontier ]
🎯 #FRONT/BTC
🪄 FRONT Chart ➖ Tradingview Idea
🔸 Hey crypto lovers, we've identified bullish signals on the $FRONT / $BTC chart through the detection of both a Bollinger Band and a Resistance Breakout. The Bollinger Band indicates a potential bullish trend as the price has moved outside of the upper band, while the Resistance Breakout confirms this trend by showing the price breaking above a key resistance level. Given the alignment of these signals, it may be a good idea to consider entering a long position and targeting higher levels. Our analysis indicates that the key resistance levels are at 0.00001107 | 0.00001158 | 0.00001279 and the major support zones are at 0.00000986 | 0.00000916 | 0.00000795. However, it is important to also consider other factors such as overall market conditions and other technical indicators before making a trade decision.
📊 Technical Metrics Index Summary:
🚥 Market Sentiment Index:
* Curated by MPDBreakout System.
* Unlock Trading Signal below.
🎯 #FRONT/BTC
🪄 FRONT Chart ➖ Tradingview Idea
🔸 Hey crypto lovers, we've identified bullish signals on the $FRONT / $BTC chart through the detection of both a Bollinger Band and a Resistance Breakout. The Bollinger Band indicates a potential bullish trend as the price has moved outside of the upper band, while the Resistance Breakout confirms this trend by showing the price breaking above a key resistance level. Given the alignment of these signals, it may be a good idea to consider entering a long position and targeting higher levels. Our analysis indicates that the key resistance levels are at 0.00001107 | 0.00001158 | 0.00001279 and the major support zones are at 0.00000986 | 0.00000916 | 0.00000795. However, it is important to also consider other factors such as overall market conditions and other technical indicators before making a trade decision.
📊 Technical Metrics Index Summary:
⎿ Mrkt Price ⌁ 0.00001189 ₿⎿ 24hChng: 🚀 5.877%⎿ 24hVol: 6.807 ₿⎿ Osciltrs: BUY⎿ MAs: STRONG_BUY🚥 Market Sentiment Index:
⎿ News: N/A⎿ Twitter: 0.59 - Bullish⎿ Reddit: 0.59 - Bullish* Curated by MPDBreakout System.
* Unlock Trading Signal below.
TradingView
$FRONT/#BTC [#Frontier]: BBand_Breakout Resistance_Breakout for BINANCE:FRONTBTC by Crypto2AF
◳◱ Hey crypto lovers, we've identified bullish signals on the $FRONT / $BTC chart through the detection of both a Bollinger Band and a Resistance Breakout. The Bollinger Band indicates a potential bullish trend as the price has moved outside of the upper…
📚 New Technical analysis for [ SushiSwap ]
🎯 #SUSHI/BTC
🪄 SUSHI Chart ➖ Tradingview Idea
🔸 We've detected a Failure Swing pattern on the $SUSHI / $BTC chart. This pattern is a bullish indication and could indicate a potential trend reversal. The next resistance key levels are at 0.0000616 | 0.0000646 | 0.0000708 and the major support zones are respectively at 0.0000554 | 0.0000522 | 0.000046. It is a bullish indication and we may consider buying at the current price zone of 0.000062 and targetting higher levels.
📊 Technical Metrics Index Summary:
🚥 Market Sentiment Index:
* Curated by MPDBreakout System.
* Unlock Trading Signal below.
🎯 #SUSHI/BTC
🪄 SUSHI Chart ➖ Tradingview Idea
🔸 We've detected a Failure Swing pattern on the $SUSHI / $BTC chart. This pattern is a bullish indication and could indicate a potential trend reversal. The next resistance key levels are at 0.0000616 | 0.0000646 | 0.0000708 and the major support zones are respectively at 0.0000554 | 0.0000522 | 0.000046. It is a bullish indication and we may consider buying at the current price zone of 0.000062 and targetting higher levels.
📊 Technical Metrics Index Summary:
⎿ Mrkt Price ⌁ 0.000062 ₿⎿ 24hChng: 🚀 5.442%⎿ 24hVol: 62.582 ₿⎿ Osciltrs: NEUTRAL⎿ MAs: STRONG_BUY🚥 Market Sentiment Index:
⎿ News: N/A⎿ Twitter: 0.61 - Bullish⎿ Reddit: 0.58 - Bullish* Curated by MPDBreakout System.
* Unlock Trading Signal below.